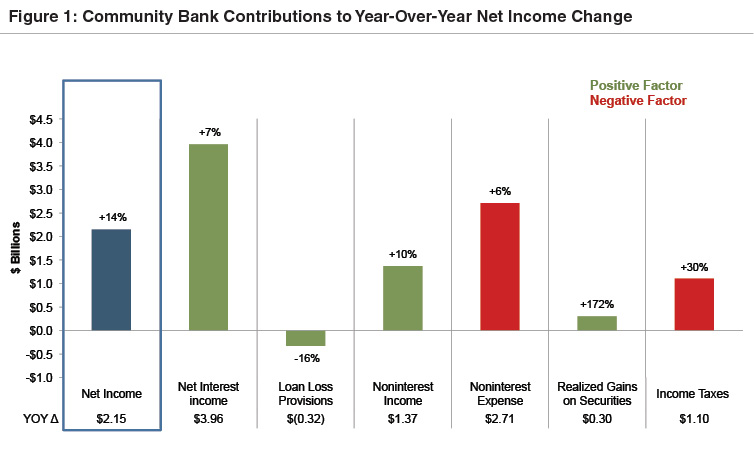
Despite much commentary about the significant economic and regulatory headwinds impacting community banks, profitability is on the mend. Community bank earnings improved in the trailing twelve months ended June 30, 2015 with net income up 14% to $17.6 billion compared to $15.5 billion in the twelve months ended June 30, 2014.1 Nearly 60% of community banks reported higher profitability based upon annualized first half 2015 net income compared to 2014 levels. The number of unprofitable banks also declined to 41 in the second quarter of 2015, compared to 109 in 2014 and 167 in 2013. The median return on assets (ROA) for community banks was up to 0.96% (annualized based upon the first half of 2015), which was the highest level since 2008.
As detailed in Figure 1, key contributors to improving earnings were higher net interest income and lower loan loss provisions. Loan growth drove the improvement in net interest income as 84% of community banks reported loan growth in the trailing twelve month period, with the median community bank’s loan growth rate reported at 7.2%. Loan growth offset net interest margin (“NIM”) compression as NIMs were at their lowest level over the 10-year historical period. As the Federal Reserve’s zero-interest rate policy (“ZIRP”) grinds on, asset yields continue to compress while funding costs have essentially reached a floor. One interesting item to gauge in future quarters is how much interest rate and credit risk is being taken by community banks to grow loans and earnings.
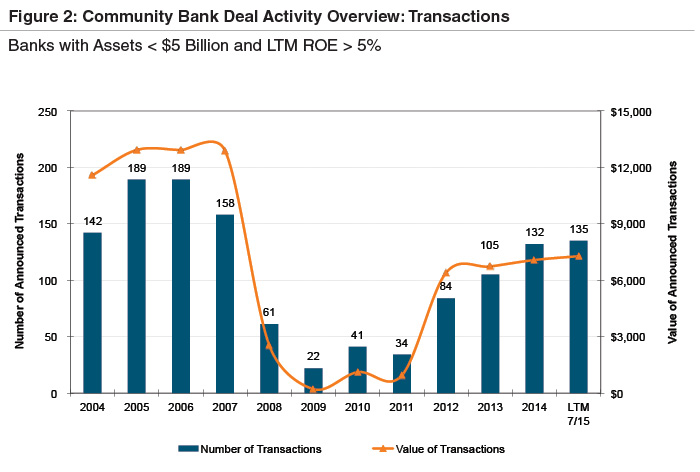
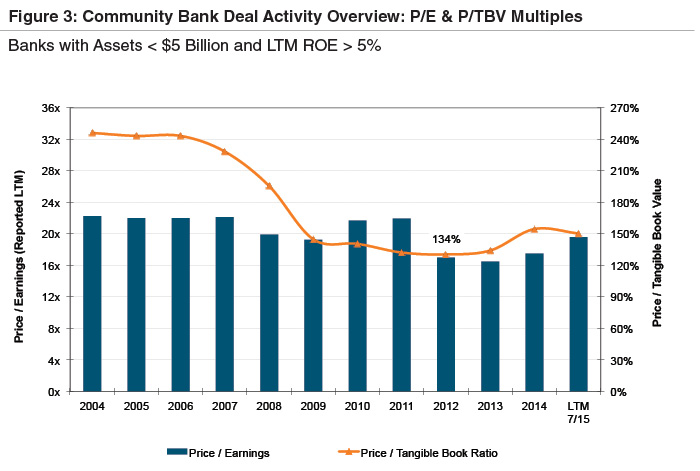
 Another sign of improving community bank health is that deal activity is up from recent prior periods as shown in Figure 2. Price/earnings multiples have also improved in recent periods (Figure 3) and appear to be relatively in line with long-term trends at approximately 20x. Price/tangible book multiples are still below longer-term trends, largely reflecting that although improved from the Great Recession returns on assets and equity remain below pre-financial crisis levels.
 While it is difficult to tell whether community bank earnings have peaked and how long this cycle may last, improving profitability expands the strategic options available to community banks. A recent article by SNL Financial noted that a number of community banks are looking to sell as earnings may have plateaued. While selling is one option available to community banks in this environment, the range of strategic options available is much broader than that. A well-rounded strategic planning session should include an assessment of the bank’s unique strengths, weaknesses, and opportunities as well as a review of the bank’s performance and outlook relative to both its history and peers. Then, a broader discussion of a range of options that can deliver growth and enhance shareholder value should be discussed. Those other options could include organic and/or acquisitive growth and other ways to provide liquidity and enhance returns to shareholders such as special dividends, share repurchases, management buy-outs, and employee stock ownership plans.
Founded in 1982, in the midst of and in response to a previous crisis affecting the financial services industry, Mercer Capital has witnessed the industry’s cycles. Despite industry cycles, Mercer Capital’s approach has remained the same – understanding key factors driving the industry, identifying the impact of industry trends on our clients, and delivering a reasoned and supported analysis in light of industry and client specific trends.
Mercer Capital has experience facilitating strategic planning sessions for community banks and providing a broad range of specialized advisory services to the sector. Contact us to discuss scheduling a strategic planning session or your institution’s specific needs in confidence.
While it is difficult to tell whether community bank earnings have peaked and how long this cycle may last, improving profitability expands the strategic options available to community banks. A recent article by SNL Financial noted that a number of community banks are looking to sell as earnings may have plateaued. While selling is one option available to community banks in this environment, the range of strategic options available is much broader than that. A well-rounded strategic planning session should include an assessment of the bank’s unique strengths, weaknesses, and opportunities as well as a review of the bank’s performance and outlook relative to both its history and peers. Then, a broader discussion of a range of options that can deliver growth and enhance shareholder value should be discussed. Those other options could include organic and/or acquisitive growth and other ways to provide liquidity and enhance returns to shareholders such as special dividends, share repurchases, management buy-outs, and employee stock ownership plans.
Founded in 1982, in the midst of and in response to a previous crisis affecting the financial services industry, Mercer Capital has witnessed the industry’s cycles. Despite industry cycles, Mercer Capital’s approach has remained the same – understanding key factors driving the industry, identifying the impact of industry trends on our clients, and delivering a reasoned and supported analysis in light of industry and client specific trends.
Mercer Capital has experience facilitating strategic planning sessions for community banks and providing a broad range of specialized advisory services to the sector. Contact us to discuss scheduling a strategic planning session or your institution’s specific needs in confidence.


