March 2020 probably will prove to be among the most dramatic months for financial markets in US history.Likewise, the fallout for banks may take a year or so to fully appreciate.Nonetheless, in this issue of BankWatch, we offer our initial thoughts as it relates to the industry.
Market Performance
U.S. equity markets have entered a bear market, the definition of which is a drop of at least 20%.As of March 27, 2020, the S&P 500 had declined 21% year-to-date and the Russell 2000 was down 32%.Not surprisingly banks have fared worse with the SNL Large Cap Bank Index falling 39% given the implications for credit because of the government’s mandated shutdown of broad swaths of the economy due to COVID-19.
Bear markets vary in length and depend upon the severity of the economic downturn, the value of assets before the downturn started, and policy responses among other factors.The 2001 recession, which was shallow, started in March and ended in November according to government statisticians; however, the bear market for equities as measured by the S&P 500 was brutal (-49%) that ran from March 2000 to November 2002. Banks trended modestly higher during 2000-2002 because they entered the downturn cheap to their late 1990s valuations and because real estate values did not fall.
The Great Financial Crisis (“GFC1”) that ran from August 2007, when the Bear Stearns hedge funds failed, through year-end 2009 entailed a bear market that saw a 57% reduction in the S&P 500 between October 2007 and the bottom on March 9, 2009.Economists tell us the recession occurred from year-end 2007 throughJune 30, 2009.Unlike 2000-2002, banks were a disaster for investors because credit losses were high, and many had to raise equity at low prices to survive.
We do not know how much further bank stocks may fall if at all from late March in what we are taking liberty to define as GFC2.Figure 1 provides perspective on how banks—here defined as SNL’s Small Cap US Bank Index—performed in the two-year period ended March 9, 2009, and March 27, 2020. During GFC1 the bank index fell almost 70% to when the bear market ended. (March 9 was near the date when FASB eased mark-to-market rules and the Obama Administration signaled it would not nationalize the banks.)
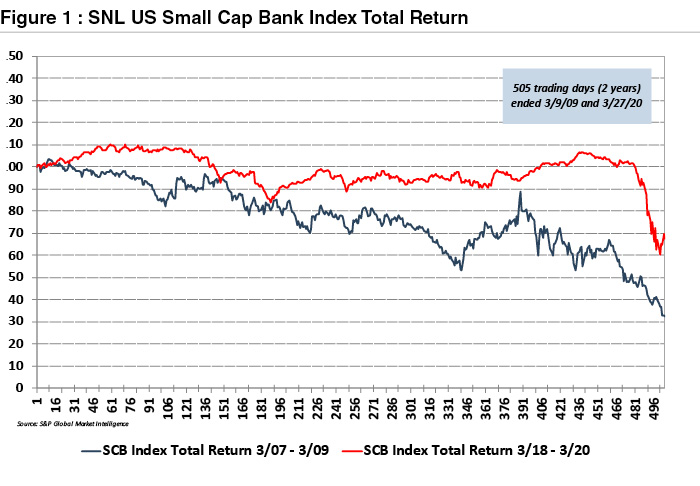
By contrast the bank index traded sideways between March 2018 and early 2020 before plummeting about 40% at the lowest point in March as investors rushed for the exits as economic activity crashed. Massive intervention in the markets by the Fed has arrested the decline in financial assets for now, but in doing so the important market function of price discovery and therefore capital allocation has been distorted.
Revaluation of Banks
Relative to history banks are cheap, but that does not mean they cannot get cheaper.Alternatively, valuation multiples may rise because EPS and TBVPS fall more than share prices fall or even trade sideways or higher from here.Presumably GFC2 will be like GFC1 and most bear markets in which prices fall in anticipation of earnings that will decline later as the market discounts fundamentals that are expected to prevail 6-18 months in the future.
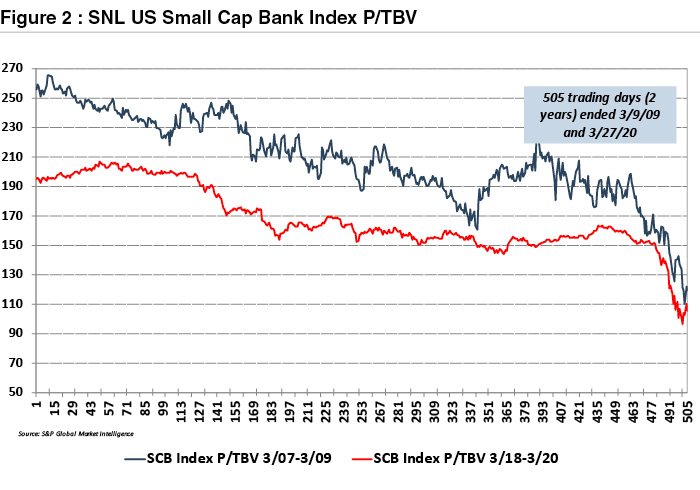
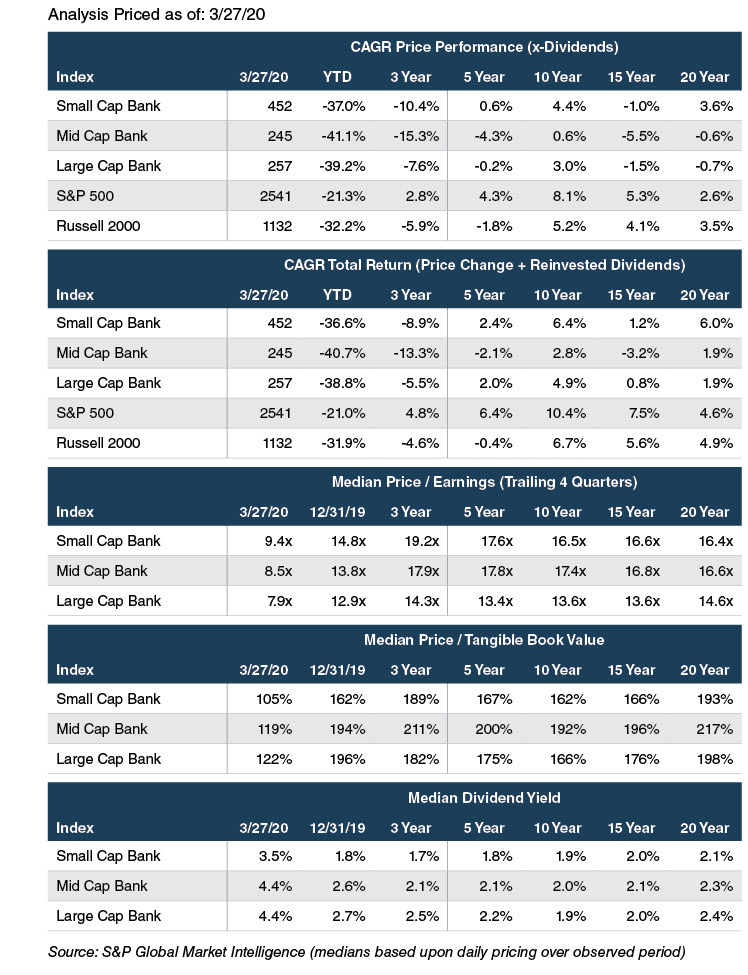
As of late March, bank stocks were cheap to long-term average multiples with small cap banks trading for 9.4x trailing 12-month earnings and 105% of TBV compared to 7.9x and 122% for the large cap bank index.Dividend yields around 4% are enticing, too, but the downturn could be sufficiently severe to force widescale dividend cuts.We do not know and will not know until the future arrives.
Interestingly, small cap banks as of March 27 were trading below the March 9, 2009, bottom at 105% of TBV vs. 118% nine years ago.
Net Interest Margins—Lower for Longer
Perhaps one of the more depressing expectations for banks is not that credit losses will increase but the Fed promise that short-term rates will remain anchored near zero for the foreseeable future.As shown in Figure 3, the market expects 30/90 day LIBOR to fall from current distressed levels in excess of 1.0% to around 0.3% within a few months and remain anchored there for a couple of years.
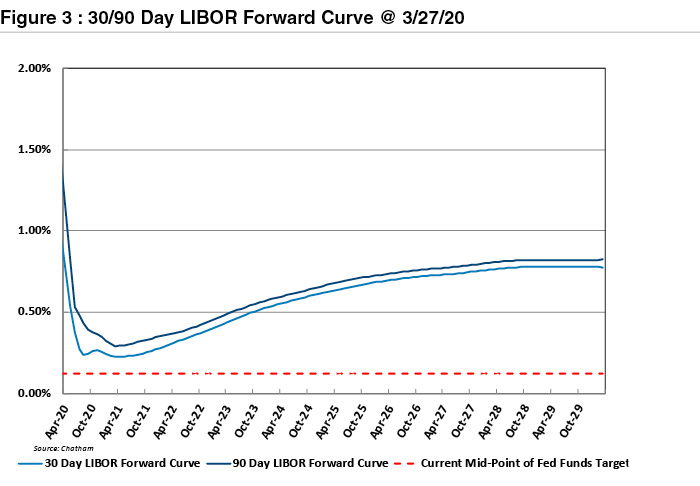
Those who follow the forward curves know that forward rate expectations can change quickly.Nonetheless, the market today expects LIBOR benchmark rates (and SOFR) to fall toward the Fed Funds target range.
Our expectation is that NIMs may fall below the last cycle low of ~3.5% recorded in 1H09 because asset yields are much lower today than in 2008 when the GFC1 was gathering steam.Likewise, deposit rates can be cut somewhat but they, too, are much lower now than was the case in 2008.By way of comparison the NIM for banks with $1 billion to $10 billion of assets in 4Q06 was 3.74% according to the FDIC.By 1H09 the NIM for the group had declined to less than 3.4%.As of 4Q19 the NIM was 3.67%.
Credit—Regulatory Forbearance Possible
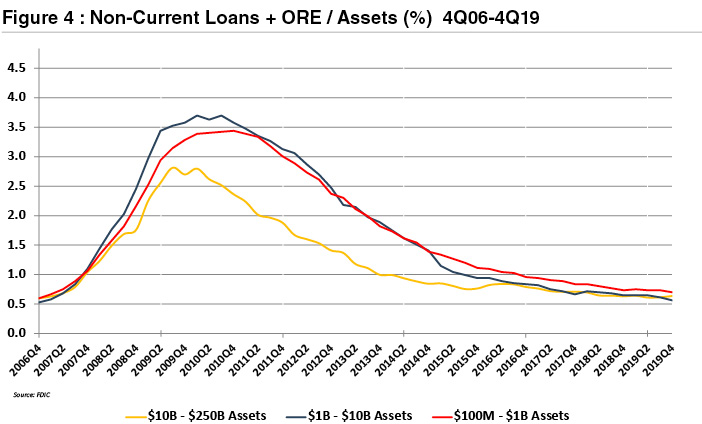
We do not know how high credit costs will go.According to the FDIC, losses approximated 2% of loans in 2009 for banks with $1 billion to $10 billion of assets and 3% for banks with $10 billion to $250 billion of assets.Losses were especially high in C&D portfolios because residential mortgage was the epicenter of the last downturn.
This time more asset classes look to be at risk because a deflationary shock has been unleashed on the global economy.
The hardest hit sectors within most bank loan portfolios will be hotels and restaurants as part of the travel and leisure industry that has been impacted the most by COVID-19.Among a subset of banks in the Southwest, Dakotas and Appalachia potentially will be sizable losses in energy-related credits as oil and gas are at the epicenter of this deflationary shock. Retail CRE will see more problem assets, too, as the shutdown accelerates the shift to digital commerce.
An unknown element is how shifts in consumer and business behaviors may impact credit losses.One surprise from the last recession was the move by consumers to pay auto and credit card loans while defaulting on mortgages in order to commute to work and maintain access to revolving credit.Previously consumers would default on other borrowings to save the home. The behavior was an admission by many consumers that they overpaid for houses and were willing to return to renting.
In this downturn maybe consumers will let auto loans go because the average auto loan is much larger and has a longer duration than a decade ago, and ride sharing lessens the need for a car.Businesses may decide that much less office space is needed as employees become more adept at working remotely.
In short, it is easy to construct a scenario in which credit losses are higher than those experienced during 2008-2010, but it is too early to know for certain.One interesting market data point arguing perhaps not is high yield bonds.The option-adjusted spread (“OAS”) on the ICE BofA High Yield Index peaked on March 23 at 1087bps versus 1988bps in November 2008.
If credit losses are notably higher than what was experienced in 2008 then an informal form of regulatory forbearance may be allowed in which losses are slowly recognized to protect capital.Past precedence includes the Lesser Developed Country (“LDC”) crisis of the early and mid-1980s in which money center banks took 5-6 years to write-off large exposures to LDCs as a result of a collapse in oil and commodity prices.
Capital and Dividends
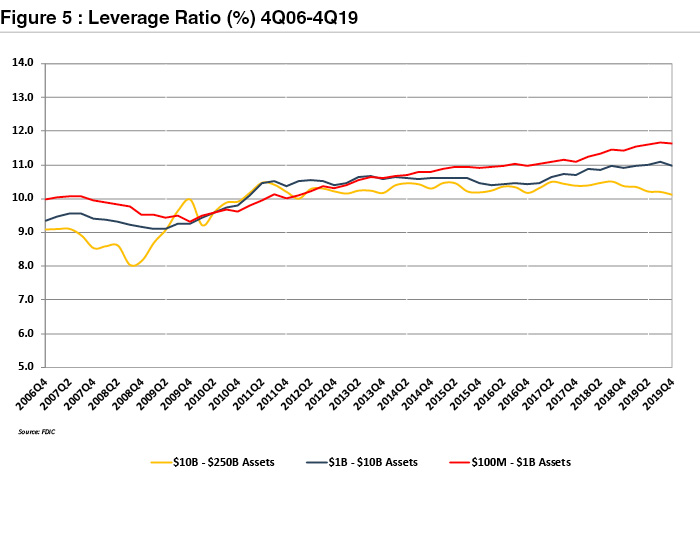
As shown in Figure 5, US banks are much better capitalized today than at year-end 2006 immediately before GFC1 began.Ironically, the severely adverse scenario in the DFAST-mandated stress tests will be tested given the magnitude of the economic shut-down.All 18 large-cap banks that were subjected to the Fed’s 2019 test passed with leverage ratios bottoming over an eight-quarter period in the vicinity of 6-7%.Results can be found at the following link http://mer.cr/2JswW1d.
A secondary issue is the outlook for common and preferred dividends.We expect first quarter and perhaps second quarter dividends to be paid; however, beginning in the third quarter dividend reductions and omissions are possible if not probable once a better estimate of losses is developed.Aside from written agreements with regulators that preclude payments we assume sub debt coupon payments will continue to be made because a missed coupon payment is an event of default unlike trust preferred securities that provided issuers 20 quarters to miss a payment without tripping a default.
M&A—Down but Eventual Upturn
Finally, M&A will become more imperative among commercial banks as NIMs go much lower.Executives of Truist Financial Corporation likely are relieved that the respective boards of directors of SunTrust and BB&T had the courage to combine to extract significant cost savings on what will be a lower run-rate of revenues than originally envisioned.
As for investors and M&A participants, the challenge as always will be first to think about earning power rather than next year’s estimate and what is a reasonable valuation in terms of earning power.That, of course, is easier said than done when markets are rapidly repricing for a new order.
Originally published in Bank Watch, March 2020.


