The January Bank Watch provided an overview of the mortgage industry and its importance in boosting bank earnings in the current low-rate environment. As we discussed, mortgage volume is inversely correlated to interest rates and more volatile than net interest income. In this article, we discuss key considerations in valuing a mortgage company/subsidiary, including how the public markets price them.
Valuation Approaches
Similar to typical bank valuations, there are three approaches to consider when determining the value of a mortgage company/subsidiary: the asset approach, the market approach, and the income approach. However, since the composition of both the balance sheet and income statement differ from banks, several nuances arise.
Asset Approach
Asset based valuation methods include those methods that write up (or down) or otherwise adjust the various tangible and/or intangible assets of an enterprise. For a mortgage company, these assets may include mortgage servicing rights (“MSR”). The fair value of the MSR book is the net present value of servicing revenue minus related expenses, giving consideration to prepayment speeds, float, and servicing advances. MSR fair value tends to move opposite to origination volume. For example, MSR values tend to increase in periods marked by low origination activity. Other key items to consider include any non-MSR intangible assets, proprietary technology, funding, relationships with originators and referral sources, and the existence of any excess equity.
Market Approach Market
methods include a variety of methods that compare the subject with transactions involving similar investments, including publicly traded guideline companies and sales involving controlling interests in public or private guideline companies. Historically, publicly traded pure-play mortgage companies were a rare breed; however, the COVID-19 mortgage boom has produced several IPOs, and others may follow. There are many publicly traded banks that derive significant revenues from mortgage operations, especially in this low-rate environment.
The basic method utilized under the market approach is the guideline public company or guideline transactions method. The most commonly used version of the guideline company method develops a price/earnings (P/E) ratio with which to capitalize net income. If the public company group is sufficiently homogeneous with respect to the companies selected and their financial performance, an average or median P/E ratio may be calculated as representative of the group. Other activity-based valuation metrics for the mortgage industry include EBITDA, revenues, or originations.
Another relevant indicator includes price/tangible book value as investors tend to treat tangible book value as a proxy for the institution’s earnings capabilities. The key to this method lies in finding comparable companies with a similar revenue mix (high fee income) and profitability.
When examining the public markets, there are generally two types of companies that can be useful in gathering financial and valuation data: banks emphasizing mortgage activities and non-bank mortgage companies.
Group 1: Banks with Mortgage Revenue Emphasis
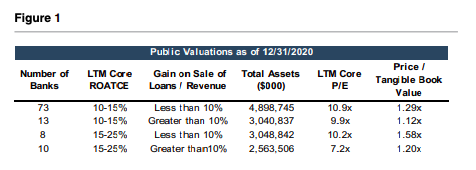
Figure 1 details the first step in identifying a group of banks with significant mortgage operations. First, financial data from the most recently available quarter (4Q20) regarding banks with assets between $1 billion and $20 billion were identified. Once that broad group of banks is identified, it is then important to segment the group further to identify those with significant gain on loan sales as a proportion of revenue and particularly those with higher than typical mortgage revenues/originations as opposed to SBA or PPP loan originations.
Group 2: Non-Bank Mortgage Companies
Non-bank mortgage companies found favor with the public markets in 2020 as beneficiaries of the sharp reduction in mortgage rates. In 2021 investor sentiment has faltered due to the impact of rising long-term rates on consensus earning estimates. Several companies undertook IPOs, while another company went public via merging with a SPAC. This expanded the group of non-bank mortgage companies from which to derive valuation multiples and benchmarking information. Figure 2 includes total return data for non-bank mortgage companies.
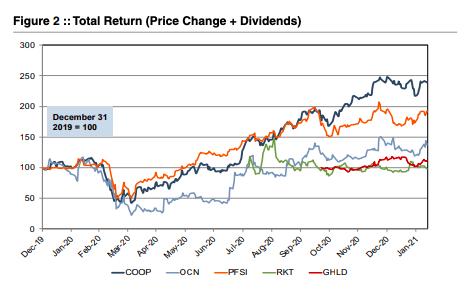 Notable transactions include the following: Rocket Mortgage (NYSE: RKT) raised $1.8 billion via an IPO at an approximate $36 billion valuation in August; Guild Holdings (NASDAQ: GHLD) raised ~$98 million in a November IPO; United Wholesale Mortgage (NYSE: UWM) went public in the largest SPAC deal in history (~$16 billion) that closed in 2021; and Loan Depot (NYSE: LDI) went public during February by raising $54 million.
Other pending IPOs based upon public S-1 filings include Caliber Home Loans and Better.com. Amerihome Mortgage Company had filed a registration statement but apparently obtained better pricing through an acquisition by Western Alliance Bancorp (NYSE: WAL) during February that was valued at ~ $1.0 billion at announcement, or about 1.4x the company’s tangible book value.
While this activity is positive for mortgage companies, the IPOs were downsized in terms of the number of shares sold with pricing below the initial target range or at the low end of the range as investors hedged how far and how fast earnings could fall in a rising rate environment.
For guideline M&A transactions, the data is often limited as there may only be a handful of transactions in a given year and even fewer with reported deal values and pricing multiples. However, meaningful data can sometimes be derived from announced transactions with transparent pricing and valuation metrics.
After deriving the “core” earnings estimate for the mortgage company as well as reasonable valuation multiples, other key valuation elements to consider include: any excess equity, mortgage servicing rights, unique technology solutions that differentiate the company, origination mix (refi vs. purchase; retail vs. correspondent or wholesale), geographic footprint of originations/ locations, and risk profile of the balance sheet and originations (for example, agency vs. non-agency loans).
Notable transactions include the following: Rocket Mortgage (NYSE: RKT) raised $1.8 billion via an IPO at an approximate $36 billion valuation in August; Guild Holdings (NASDAQ: GHLD) raised ~$98 million in a November IPO; United Wholesale Mortgage (NYSE: UWM) went public in the largest SPAC deal in history (~$16 billion) that closed in 2021; and Loan Depot (NYSE: LDI) went public during February by raising $54 million.
Other pending IPOs based upon public S-1 filings include Caliber Home Loans and Better.com. Amerihome Mortgage Company had filed a registration statement but apparently obtained better pricing through an acquisition by Western Alliance Bancorp (NYSE: WAL) during February that was valued at ~ $1.0 billion at announcement, or about 1.4x the company’s tangible book value.
While this activity is positive for mortgage companies, the IPOs were downsized in terms of the number of shares sold with pricing below the initial target range or at the low end of the range as investors hedged how far and how fast earnings could fall in a rising rate environment.
For guideline M&A transactions, the data is often limited as there may only be a handful of transactions in a given year and even fewer with reported deal values and pricing multiples. However, meaningful data can sometimes be derived from announced transactions with transparent pricing and valuation metrics.
After deriving the “core” earnings estimate for the mortgage company as well as reasonable valuation multiples, other key valuation elements to consider include: any excess equity, mortgage servicing rights, unique technology solutions that differentiate the company, origination mix (refi vs. purchase; retail vs. correspondent or wholesale), geographic footprint of originations/ locations, and risk profile of the balance sheet and originations (for example, agency vs. non-agency loans).
Income Approach
Valuation methods under the income approach include those methods that provide for the direct capitalization of earnings estimates, as well as valuation methods calling for the forecasting of future benefits (earnings or cash flows) and then discounting those benefits to the present at an appropriate discount rate. For banks, the discounted cash flow (“DCF”) method can be a useful indication of value due to the availability and reliability of bank forecast/capital plans. However, due to the volatile and unpredictable nature of mortgage earnings, this method faces challenges when applied to a mortgage company. In certain situations, the DCF method may not be utilized due to uncertainties regarding the earnings outlook. In others, the DCF method may be applied with the subject company’s level of mortgage origination activity tied to a forecast for overall industry originations and historical gain on sale margins.
Given the potentially limited comparable company data and the difficulty associated with developing a long-term forecast for a DCF analysis, the single period income capitalization method may be useful.
This method involves determining an ongoing level of earnings for the company, usually by estimating an ongoing level of mortgage origination activity and a pretax margin and capitalizing it with a “cap rate”. The cap rate is a function of a perpetual earnings growth rate and a discount rate that is correlated with the entity’s risk. Whereas we would likely use recent earnings in the market approach, in the income capitalization method it makes sense to normalize earnings using a longer-term average, which considers origination and margin levels over an entire mortgage operating cycle.
Mortgage earnings and margins are cyclical. Due to the volatile nature of mortgage earnings, a higher discount rate is normally used. Therefore, a mortgage company’s earnings typically receive a lower multiple than a bank’s more stable earnings.
Conclusion
A mortgage subsidiary can be a beneficial tool for community banks to increase earnings and diversify revenue. This strategy, while clearly beneficial now, can be utilized throughout the business cycle. As rates fall and net interest income faces pressure, gains on the sale of loans should increase (and vice versa) to create counter-cyclical revenues. As we’ve discussed, the inherently volatile income from a mortgage subsidiary is not usually treated equally to net interest income in the public markets. Although, when it comes to price/tangible book value multiples, profitability is critical whether it is driven by mortgage activity or not. There are many factors to consider in valuing a mortgage company.
If you are considering this line of business to diversify your bank or desire a valuation of a mortgage operation, feel free to reach out for further discussion.
Originally appeared in Mercer Capital’s Bank Watch, February 2021.


