So how does one value private equity and credit when financial conditions are tightening, IPO and M&A activity is moribund, and a recession may be developing?
The accountants provide perspective and guidance on valuation, but not precision beyond the preference hierarchy of Level 1 vs Level 2 vs Level 3 valuation inputs. ASC 820-10-20 defines fair value as, “the price that would be received to sell an asset or paid to transfer a liability in an orderly transaction between market participants at the measurement date.” Fair value from the accountant’s perspective represents the exit price of the subject asset for a market participant in the principal or most advantageous market.
Alternatively, years ago we once heard sage valuation advice given to an analyst who would one day become an executive: focus on getting earning power and all of the variables that drive it (e.g., revenue sustainability, margins, etc.) rather than the multiple.
Primacy of Cash Flow
Figure 1 (on the next page) provides a sample overview of the template we use at Mercer Capital. The process is not intended to create an alternate reality in which adjusted EBITDA is ridiculous due to a myriad of addbacks; rather, it is designed to shed light on core trends about where the company has been and where it may be headed. Adjustments are intended to strip-out non-recurring items and items that are not related to the operations of the business.
In addition, EBITDA is but one measure to be examined because EBITDA is a good base earnings measure, but it does measure cash flow, capex, working capital and debt service requirements.
The adjusted earnings history should create a bridge to next year’s budget, and the budget a bridge to multi-year projections. The basic question to be addressed: Does the historical trend in adjusted earnings lead one to conclude that the budget and multi-year projections are reasonable with the underlying premise that the adjustments applied are reasonable?
The analysis also is to be used to derive “earning power,” which represents a base earning measure through the firm’s (or industry’s) business cycle. Therefore, the analysis requires examination of earnings over an entire business cycle. If the company has grown (or contracted) such that adjusted earnings several years ago are less relevant, then earning power can be derived from the product of a representative revenue measure such as the latest 12 months or even the budget and an average EBITDA margin over the business cycle.
Build-Up Multiples vs Transaction Multiples
Marking private equity (and credit) can be challenging during and after a period of extreme valuations that intuitively do not make sense. For instance, relying upon transaction data from 2021 when some valuations could be characterized as extreme relative to the pre-COVID years would not make sense if the subject company could not reasonably be expected to obtain the same multiple today. Stated differently, transaction data from a bubble is factual, but is it useful or just misleading?
Likewise, transaction data from a bear market such as the 4Q07-1Q09 is what it is, but the observations may not be relevant given the context of why a transaction occurred (e.g., distress).
One way to navigate the issue is to apply a fundamental discount to data to reflect a material change in market conditions. Another would be to put more weight on build-up methods where capitalization factors (multiples) are derived from the cost of capital, targeted capital structure and the expected long-term growth rates in a company’s debt-free earning power. Build-up multiples are used in the Direct Capitalization of Earnings Method and can be used in lieu of or in conjunction with transaction multiples to derive the terminal value in the Discounted Cash Flow Method.
Figure 1
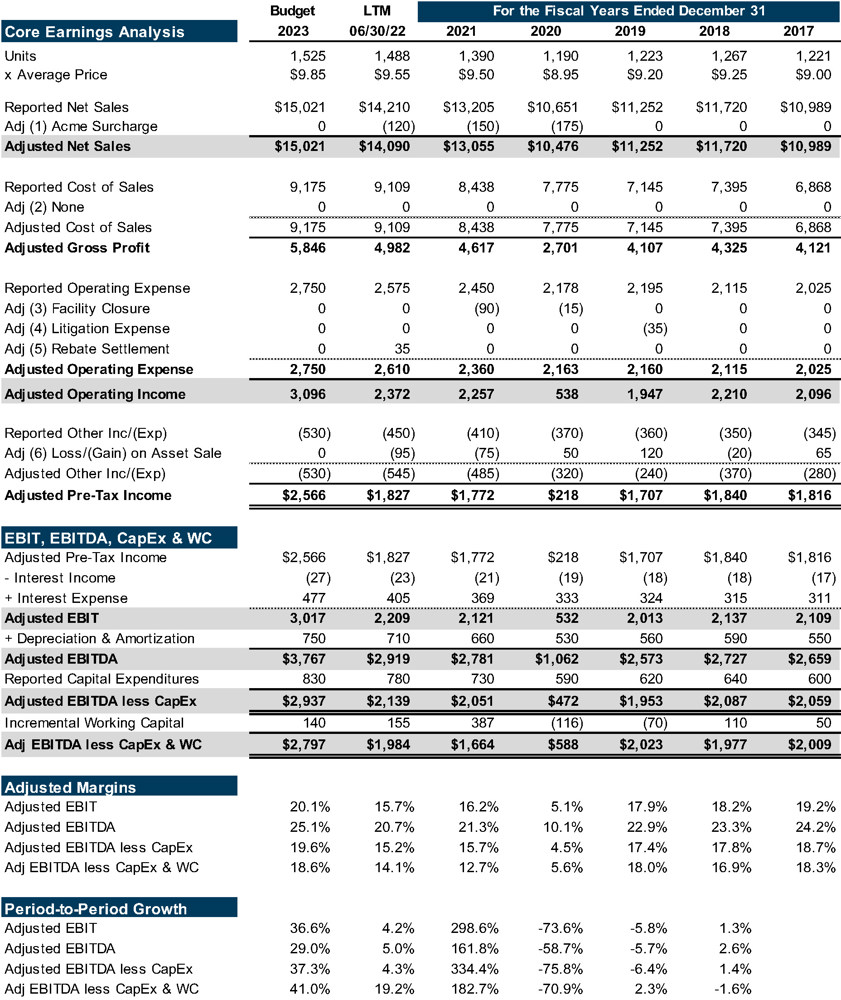
Figure 2
 An example of using a build-up to derive the capitalization factor (multiple) is presented in Figure 2. The method has subjectivity that unadjusted observed transaction data multiples do not have, but that is the beauty of the method as assumptions for risk and growth are varied depending upon the subject company’s profile.
Build-up multiples are affected by market conditions, too. Changes in long-term interest rates are immediately reflected (the rising rate environment of 2022 translates into lower multiples on a stand-alone basis), while equity premia evolve over time as historical return data is updated.
The balance of 2022 is shaping up as a period when investors and plan sponsors may have more questions and disagreements about how assets are marked after 2022 when many asset values moved steadily higher from 2H20 through year-end 2021. Each investment will have its own facts and circumstances to consider, the primary one being the trend in earning power.
About Mercer Capital
Mercer Capital is a valuation and transaction advisory firm. Over the last four decades we have valued tens of thousands of equity and credit investments in virtually every industry and sub-industry grouping that exist in a variety of markets. We also have significant M&A experience. Please call if we can assist in the valuation of your portfolio companies.
Originally featured in Mercer Capital's Portfolio Valuation Newsletter: Second Quarter 2022