The Wall Street Journal (WSJ) ran a post on June 22 that compared AI-enabler Nvidia (NASDAQ:NVDA) to Cisco (NASDAQ:CSCO) at the top of the dot.com bubble in early 2000. At the time, CSCO traded for ~130x forward earnings compared to “only” 45x for NVDA, though NVDA’s impact on the market-cap weighted S&P 500 is staggering at 7% of the index today.
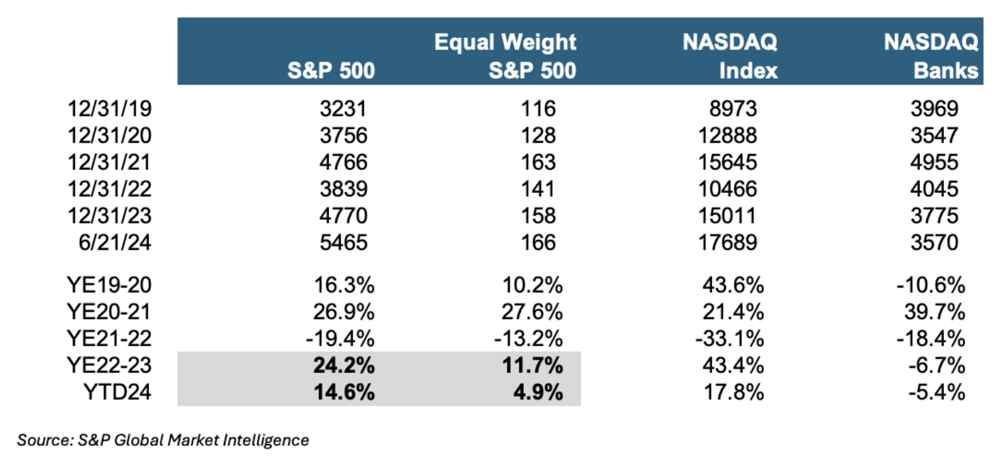
The magnificent seven, which includes NVDA and six other mega-cap tech stocks, account for ~25% of the S&P 500 and the bulk of the index’s return over the past several years. For example, the S&P 500 gained 24% in 2023 and 15% year-to-date through June 21 compared to 12% and 5%, respectively, for the equally weighted S&P 500 (NYSE:RSP).
Figure 1: 2000 Redux?
In effect, the current bull market reflects a narrowing breadth. Bull markets are stronger when there is broad participation. Sometimes, narrow advances give way to a broadening advance, and sometimes narrow advances presage downturns. A quarter of a century ago, the latter occurred as the dot.com mania produced a blowoff top and then a collapse — though with a twist.
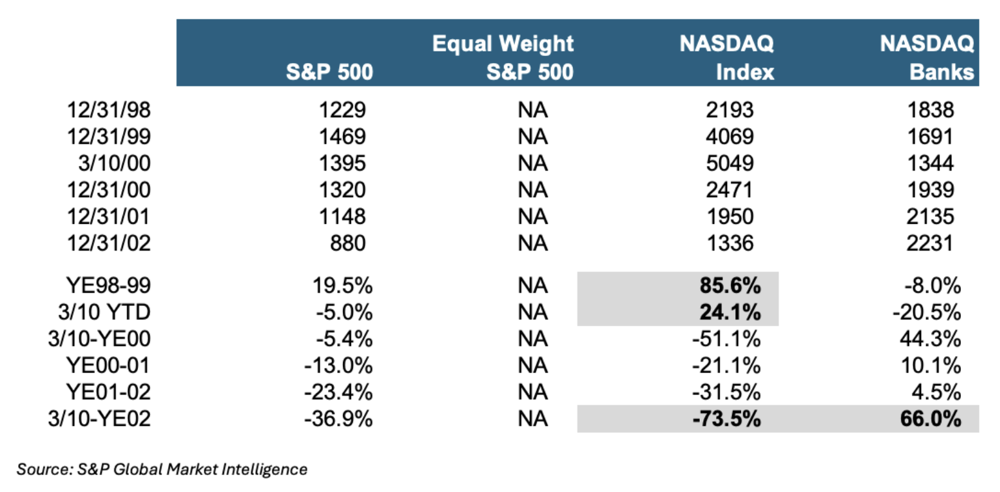
As shown in Figure 2, the NASDAQ index rose a staggering 86% in 1999 as CSCO, TMT (telecom, media, and technology), and money-losing dotcom stocks defined the bubble moniker that was common at the beginning of that year. The NASDAQ then rose another 24% by the cycle peak on March 10, 2000.
Bank stocks, as measured by the NASDAQ Bank Index, fell 27% between year-end 1998 and March 10, 2000. Bank multiples declined to 10-12x earnings in March from +20x in the summer of 1998 as the M&A frenzy peaked with nosebleed valuations (based upon stock swaps rather than cash).
The popping of the NASDAQ bubble in March 2000 became the catalyst for a shift in capital flows to banks and other value stocks such as REITs, insurance, manufacturers, and retail. Banks rose 44% over the balance of 2000 and 66% between March 10 and year-end 2002. In contrast, the NASDAQ and S&P 500 fell 74% and 37%, respectively, as CSCO posted a massive loss in 2001, and many dotcom companies would fail.
Figure 2: 2000 Bubble Burst
The setup for the market today is similar to early 2000. Tech has been on a tear while bank stocks and other value stocks have languished. Bank stocks could be poised to enter a bull market as occurred in 2000, though there are also meaningful differences to consider with the prior era.
Profitability. The average ROE for banks with $10 billion to $250 billion of assets was 15.6% for the LTM period ended March 2000 compared to 10.2% as of March 2024. Given the reduction in corporate tax rates in 2018, the pretax comparative is more striking at 24.9% vs 13.1%, with the difference attributable to a lower pretax ROA and higher equity capital today.
Interest Rates. Unlike the deeply inverted yield curve that exists today, the yield curve was flat to slightly inverted in early 2000 as the Fed hiked 175bps during 2H 1999-1H 2000 when Fed Funds peaked at 6.50% in May 2000. The Fed would subsequently cut rates to 1.0% by June 2003, with 475bps of cuts in 2001. Could a similar rate cycle occur today? It is possible, but likely something “bad” would have to occur given the level of inflation.
Real Estate. Real estate secured loans and mortgage banking performed superbly during 2000-2002 as the sharp reduction in rates pushed real estate values higher and drove retail and commercial refinancing activity. Absent a replay of the deep rate cutting of 2001-1H 2003, it is hard to see how CRE avoids a down credit cycle that will vary depending upon the sector and area of the country.
Commercial. While CRE net charge-offs were negligible during 2000- 2002, C&I losses peaked near 1.5% as telecom leverage lending and industries negatively impacted by 9/11 posted sharp losses. Leverage lending could push C&I losses to much higher levels in any downturn, but a counter-argument is that vast pools of private credit and a reinvigorated LL/HY public market have refinanced many potential problem loans.
Ownership. An enormous difference between 2000 and today is the ownership structure of the market. Three of the top five shareholders with 15-25% ownership of most institutionally significant banks (market caps > $1 billion) are passive funds (Vanguard, Blackrock, and State Street Global) due to the rise of index investing. Allocation of funds directed to the market cap-weighted S&P 500 is dictated by relative capitalization. If the magnificent seven fall sharply and bank earnings improve, capital flows into banks could be magnified.
Federal Government Spending. The federal government ran small surpluses in fiscal years 1999-2001 compared to ~$2 trillion deficits that equate to 6-7% of GDP today. In 2001, the Fed had more capacity to cut policy rates sharply compared to now where the massive supply of bonds to be issued implies rates cannot fall as much absent Fed monetization.
Bifurcation. Sectors always have dispersions among companies. During 2000-2002, small banks outperformed large banks because many large banks were in the process of digesting massive acquisitions that eventually resulted in the Street recognizing that it had overestimated forward EPS. Today, large banks paced by JPMorgan (NYSE: JPM), Bank of America (NYSE:BAC), and Citigroup (NYSE:C) have outperformed small banks by a wide margin due to favorable deposit flows, less CRE exposure, and more diverse revenues anchored by sizable Wall Street business units.
* * * * * *
An interesting side note to the CSCO-NVDA comparison is that on November 11, 2001, S&P announced that NVDA would replace Enron in the index, given the demise of the latter. The press release noted that NVDA’s market cap was $7.8 billion compared to about $ 3 trillion today. By way of comparison, JPM’s market cap has increased from $75 billion to $563 billion.
* * * * * *
We at Mercer Capital do not know which way markets will go in the coming quarters and years, but we can speculate. Mercer Capital does know bank valuation and transaction advisory. Please call if we can assist.
Originally appeared in the June 2024 issue of Bank Watch.