November 2025 SAAR


Key Takeaways
- Sales Rebound but Still Soft YoY: November SAAR improved to 15.6M, yet industry volumes posted a second month of year-over-year declines amid tariff impacts and expiring EV incentives.
- BEV Demand Pullback: After September’s tax-credit rush, BEV market share has fallen by more than half, signaling a sharp reset in EV sales momentum.
- Margins Tighten as Inventory Varies by OEM: Despite likely topping 16M units for 2025, per-unit profitability is slipping, and dealer performance is increasingly dependent on brand-specific inventory discipline.
In November 2025, the U.S. auto industry rebounded from a 2025-low as the SAAR of 15.6 million units represented a 2.0% increase from the prior month. However, this was the second straight month of year-over-year declines, as volumes were down 6.4% from November 2024. Prior to this two-month slump, volumes had only declined on an annual basis once (May) since August 2024. Despite the recent declines, vehicles sales over the last twelve months total 16.2 million, so unless December 2025 underperforms December 2024 by more than 16.4%, we’ll see volumes eclipse 16 million for a full calendar year for the first time since 2019.
Reasons for the Q4 slowdown include tariff-related price increases on 2026 model year vehicles and the expiration of EV tax credits in September 2025. Expiring tax credits led to an all-time high market share for BEV vehicles at 11.8% in September, which has since plummeted to 5.9% in October and 5.1% in November. On an unadjusted basis, volumes increased by 2.6% from September to November, so the significant decline in market share implies a 54% decrease in BEV volumes.
Unadjusted Sales Data
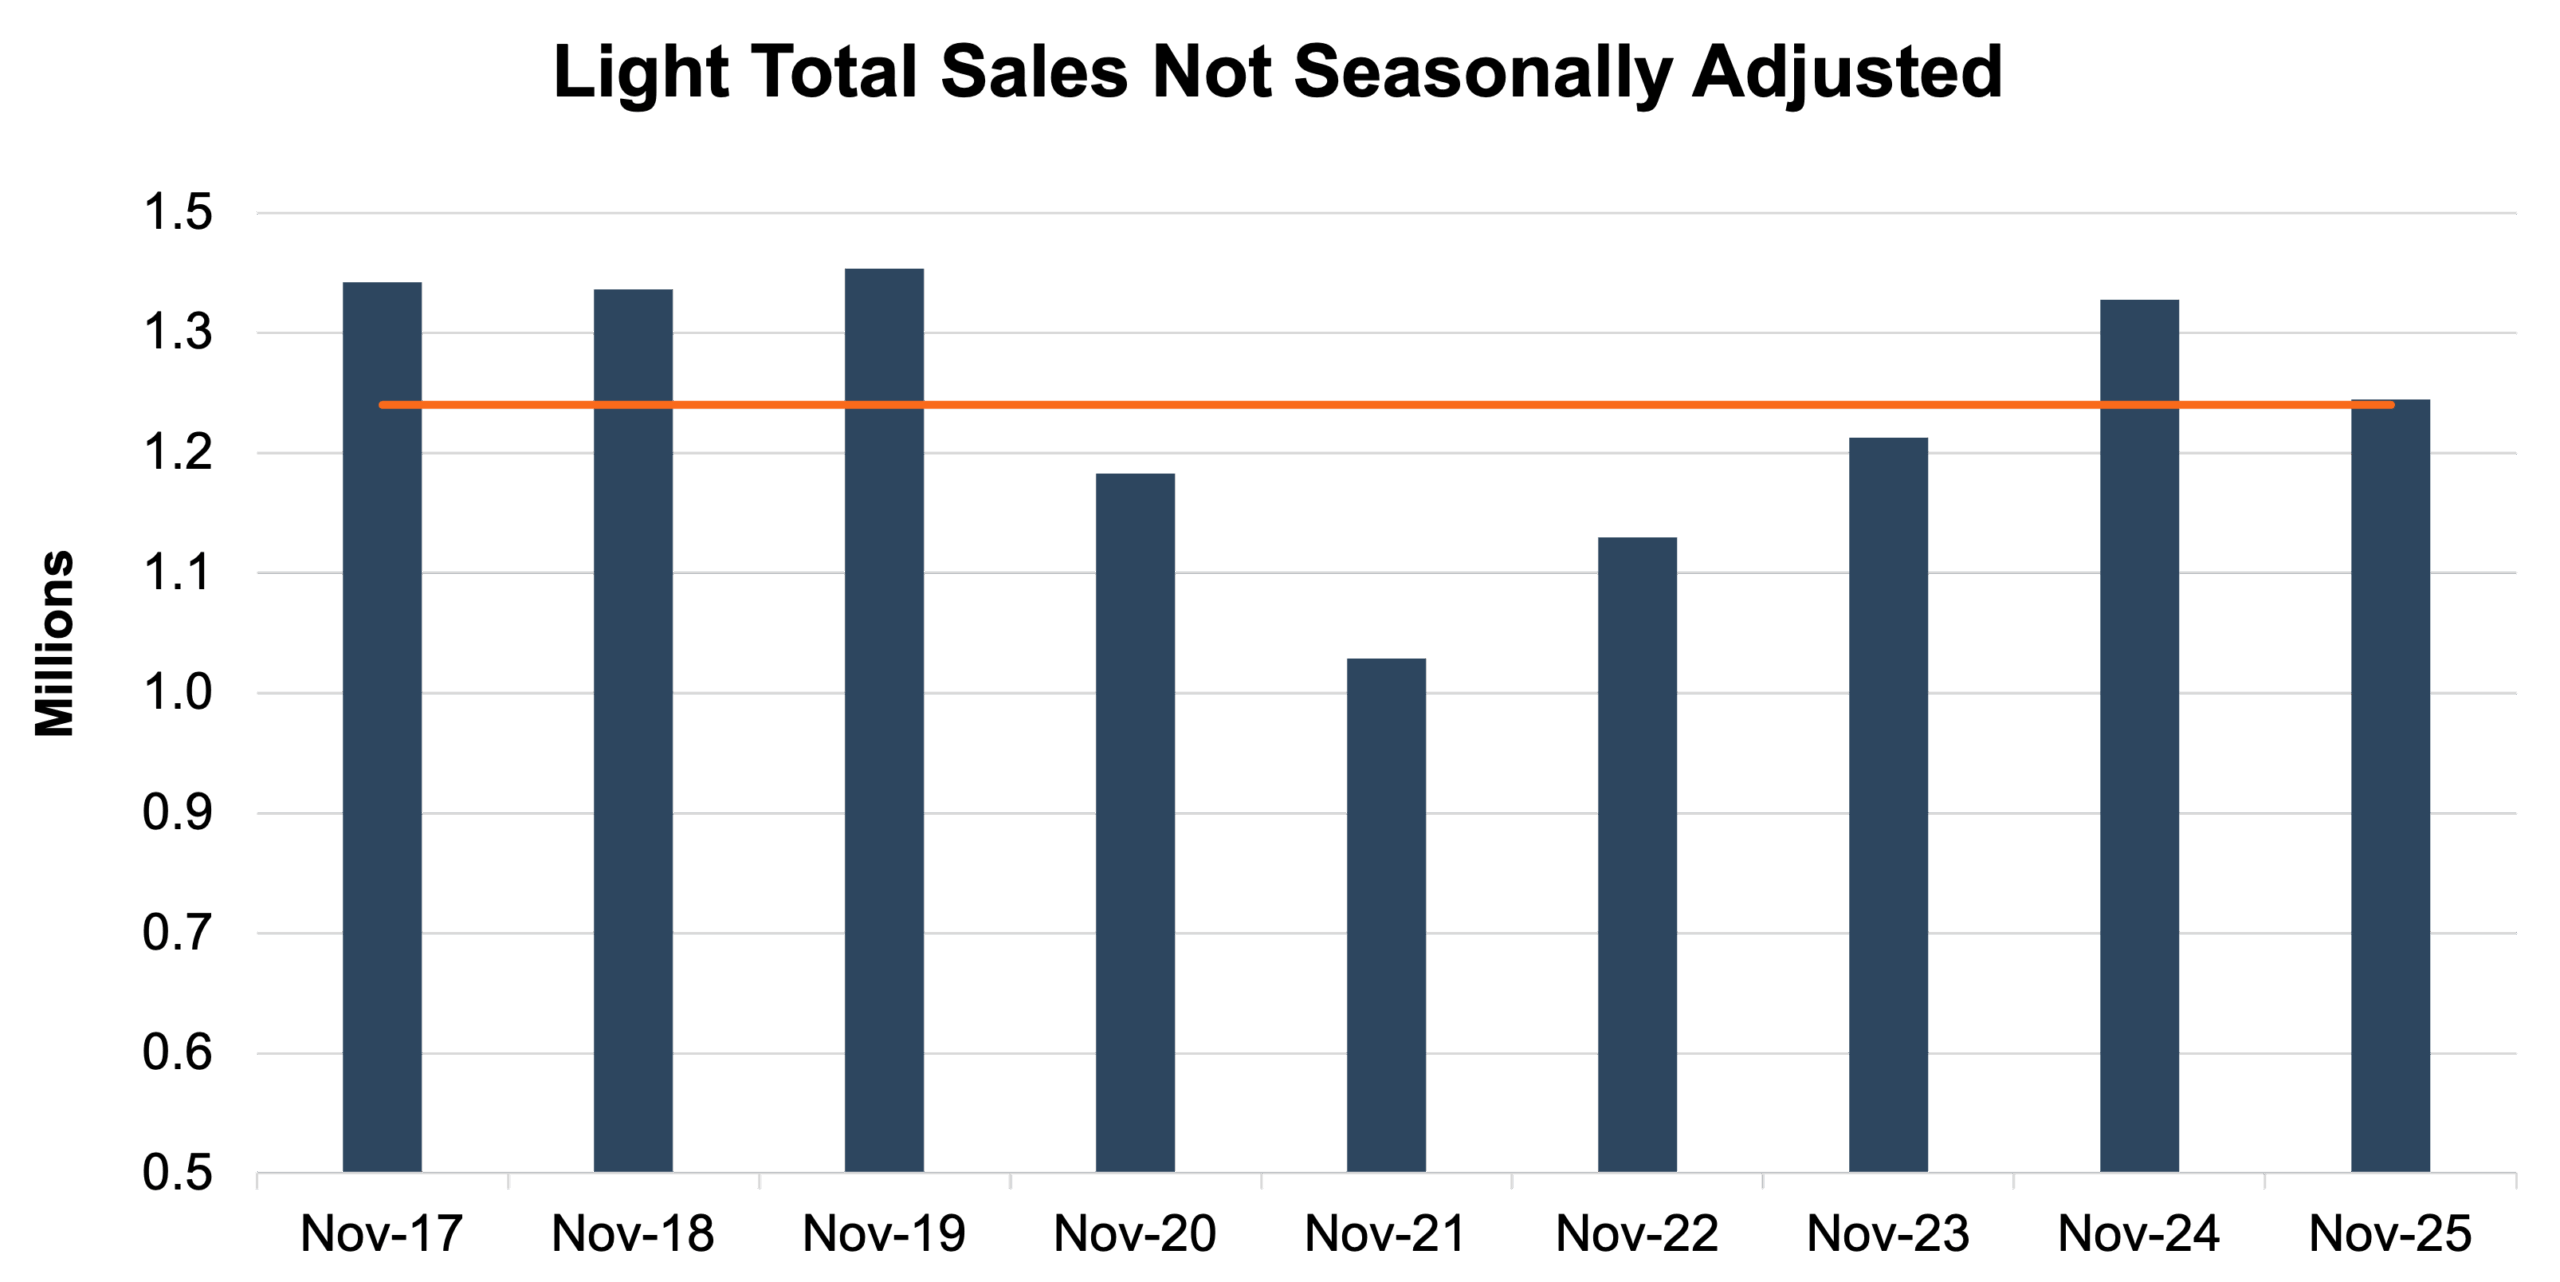
On an unadjusted basis, November 2025 industry sales finished at 1.27 million units, a 0.4% increase from last month but a 7.3% decrease from November 2024. This month’s unadjusted sales modestly exceeded the nine-year November average of 1.27 million units (2017 – 2025) by approximately 6 thousand units. See the chart below for a look at unadjusted sales over the last nine Augusts.
Inventory Metrics
After a couple of months without publication of the SAAR due to the government shutdown, the inventory/sales ratio has yet to be updated.
Brand-level days’ supply data from Cox Automotive offers a more granular perspective on how manufacturers are handling their supply chains, emphasizing that a dealer’s inventory situation is increasingly shaped by the specific OEM or brand rather than the industry-wide average. See the chart below for a look at days’ supply by brand in October 2025.

Inventory management continues to be a key differentiator among OEMs. Evaluating franchise worth now requires a closer examination of how effectively a brand maintains operational steadiness. Lexus and Toyota dealerships, on the far left of this chart and meaningfully below other OEMs, command some of the highest valuations. In the Q3 Haig Report, the firm noted average supply had returned to healthy levels but in many cases, there is too much supply, as dealers representing brands on the far right of the above chart are likely well aware.
Transaction Prices
According to J.D. Power, the average new-vehicle retail transaction price in November 2025 is projected to be around $46,029, an increase of approximately 1.6% from November 2024. Affordability issues remain as consumers increasingly turn to longer loan terms to reduce monthly payments. Monthly payments are further offset by a declining interest rate environment and higher trade-in equity from rising used vehicle prices.
Incentive Spending and Profitability
Thomas King, the president of OEM solutions at J.D. Power, discussed the factors impacting incentive spending in November:
“The average manufacturer’s incentive spend per vehicle is on track to reach $3,211, which is $375 higher than October but $125 lower than a year ago. The year-over-year decline in incentive spending is mostly due to sales shifting away from heavily discounted EVs and moving towards non-EVs with much lower discounts. The declining percentage of vehicles leased compared to a year ago is adding secondary pressure to lower incentive spending.”
Total retailer profit per unit, encompassing vehicle gross and finance/insurance income, is projected at $2,161 a slight rise ($6) from November 2024 but a $54 decrease from October 2025. This change in per-unit profitability considers a shift in mix away from EVs among other factors.
December 2025 Outlook
After two months of depressed sales, we’re expecting more of the same on an adjusted basis, while year-end sales will still likely lead to higher unadjusted volumes. While December SAAR may not eclipse 16 million, we believe 2025’s annual volumes will reach this level. While volume improvement is welcome, declining per-unit profitability may lead to lower total performance for dealers. The industry has yet to reach the 17 million unit threshold since pre-COVID, and we are not expecting that to happen in 2026.
Mercer Capital provides business valuation and financial advisory services, and our auto team helps dealers, their partners, and family members understand the value of their business. Contact a member of the Mercer Capital auto dealership team today to learn more about the value of your dealership.