Corporate Valuation, Auto Dealerships

July 12, 2021

The Electric Vehicle Race

Tesla vs. Everyone

Is Tesla’s Grip On the EV Market as Iron Clad as It Once Seemed?

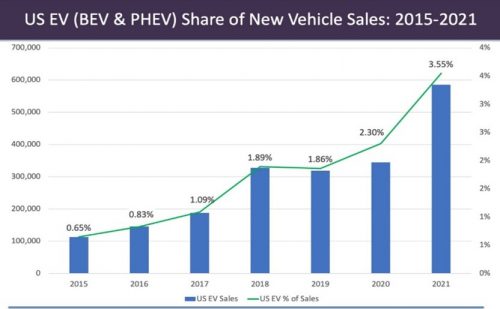
Electric vehicles have continued to gain momentum, forecasted to reach 3.55% of the U.S. market share of total vehicles by the end of this year. While this is still a relatively small portion of total auto sales, manufacturers continue to invest in their electric technology to prepare for a future in which electric vehicles may be the norm.
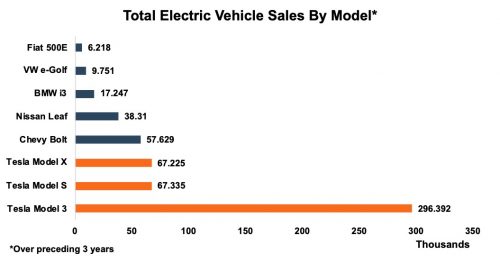
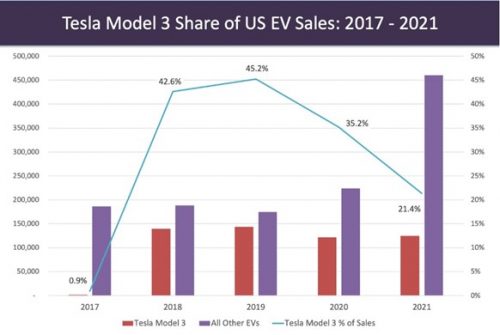
When you think “electric vehicles,” there has been one brand that has established itself as a clear leader: Tesla. Elon Musk, Tesla CEO, when he’s not tweeting about Dogecoin or other memes, is solidifying the company as the go-to manufacturer for electric vehicles. According to data from Experian, Tesla accounted for 79%of U.S. EV registrations in 2020, with 200,561 of its electric battery operated vehicles registered.  This is an increase of 16% from 2019 when owners registered 172,438 Teslas.  Tesla has dominated the industry, with the three highest selling EV models since 2018 as seen in the graph below. Tesla’s Model 3 alone has more sales than all the other electric vehicles combined and when you consider the Model S and the Model X, there have been three times more Tesla vehicles sold than the trailing top 5 competitors.  While Tesla’s dominance in the U.S. is clear, the graph below helps illustrate that Tesla’s lead may not be as iron clad as it once was when looking at market share on a year-to-year basis. Tesla’s Model 3 has been losing market share since 2019, largely attributable to the influx of new EV options in the marketplace.  In 2021, Model 3 market share is anticipated to drop even further, with expected new EV options diluting the market.  With more auto groups intent on gaining a slice of the pie, competition is expected to continue to steepen going forward.
Competitors

Who is challenging Tesla in the EV space? We have laid out the top competitors:

Volkswagen

After half a million diesel Volkswagen models were cited for violations in the 2014 emissions scandal, the company is clearly trying to clean up its image.  One way they are doing this is in electric vehicle initiatives.  In 2020, the brand delivered nearly three times as many pure-electric vehicles as they did the year before, up to 134,000 electric vehicles and 212,000 electrified cars in total worldwide.  By 2030, the company hopes that their fully-electric vehicles will account for more than 70% of the brand’s European sales and a market share of over 50% in U.S. and China.

Deutsche Bank analysts have bullish predictions for Volkswagen.  As a team of analysts led by Tim Rokossa noted that with a new target for electric vehicles of 1 million this year, the majority of which will be electric battery vehicles, the German automobile maker should come “very close to Tesla’s battery electric vehicle sales.”  Volkswagen is already taking a lead in European markets, as they accounted for more than 22%of the market shares after 10,193 vehicles were registered.  This compares to Tesla’s market share in 2020 of only 13% across the pond.  Looking forward, Volkswagen’s ability to convert customers in the U.S. market will be crucial in gaining market share.

Stellantis

Like Volkswagen, Stellantis presents a substantial threat to Tesla’s electric vehicle dominance in the United States after it has performed impressively in Europe.  The world’s fourth largest car maker’s electric vehicle share accounts for nearly 17% of the market share in Europe, trailing only Volkswagen. The company announced last Thursday that it would invest more than $36 billion through 2025 as a plan to accelerate in the EV race.  The company had already announced in April that they set out targets to offer an electrified version of nearly 100% of its models by 2025.  With this investment initiative is the bold plan of targeting 70% of European sales and 40% of U.S. sales coming from low emission vehicles by 2030.  The company has significant ground to make up in the U.S. markets in order to achieve this goal, and like Volkswagen, will need to focus efforts on conversion in this market.

Ford

Ford’s sales of EVs expanded 117% in June, reaching a new first half sales record of 56,570 vehicles. Behind these figures were the success of Ford’s fully electric Mustang Mach-E and F-150 PowerBoost Hybrid.  More importantly than just the recent increase is the fact that 70% of customers who bought the battery electric SUVs are new to Ford, meaning the additions may be helping them to capture market share.

Ford’s ability to produce an electric pick-up, the F-150 Lightning Electric truck, makes them dangerous in a U.S. auto market driven by light truck sales (light trucks accounted for 75.9%share of U.S. auto sales in 2020). With Ford having thesecond largest total vehicle market share in the U.S., trailing only GM, their ability to convert current users of their traditional vehicles to electric will be just as important as gaining new customers in expanding their EV market share reach.

General Motors

The largest auto manufacturer of traditional vehicles in the U.S. is hoping to have success in the EV space as well.  The Chevy Bolt has the highest number of sales in the U.S. of non-Tesla brand vehicles. Additionally the company has committed to becoming an all-electric vehicle company by 2035, meaning there is significant investment in this business line that is occurring.  The company is also hoping to cut costs through making their own battery cells through a joint venture with LG Chem in Ohio.  A facility is under construction and expected to be completed by 2022.  Like Ford, a key component in gaining electric vehicle market share will be converting some of their current users of traditional vehicles.

Batteries Are Key

Despite the encroachment of other traditional OEMs on Tesla in the EV space, the hurdle that they will have to overcome to catch up lies in one specific part of the vehicle: the battery.  It is currently a race to the bottom, with the battery costs in an electric vehicle being a primary reason that electric vehicles continue to be pricier more costly than traditional vehicles.  However, this price has been dropping, with Tesla leading the way.  Tesla has managed to drop their cylindrical cell battery pack down to around $150 per kWh last year, nearly an 87% decline from 2010 as seen in the graph below:
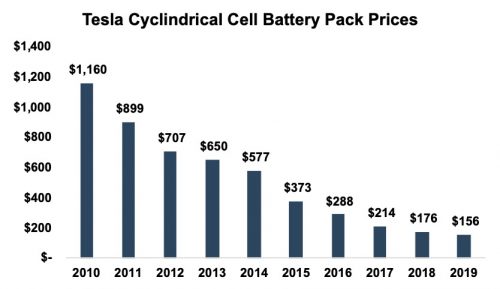
Tesla is the only automaker to use this type of cylindrical battery cells in its battery pack.  Its competitors, like those discussed above, use battery packs containing pouch or prismatic battery cells.  According to Cairn, these cost on average more than $200per kWh in 2019.  Automakers are aware that even though they are throwing billions of dollars at batteries and EV production, Tesla’s lead on the technology of these vehicles is undeniable. Colin Rusch, auto analyst for Oppenheimer notes, “At core there is really incredible battery technology within the organization and that is material science that they have been working on for well over a decade.  We think they have some substantial advantages on that.”  Tesla competitors eager to get the edge on the EV giant will have to continue to invest in their battery technology in order to drive down prices.

The Real Winners

Though uncertainty remains surrounding whether or not Tesla will be dethroned in the U.S. EV space, there is one clear winner among all of this investment and competition: the consumer.  More investment into EV technology and competition between brands means that electric vehicles likely will become more readily available to car buyers at more affordable prices.  While Tesla is the largest player in the U.S. market, their image of luxury vehicles prevents many people interested in electric from joining the market.  Larger offerings of mass market vehicles will help to show the true demand that is there for these types of cars and trucks.

Additionally, auto dealerships also stand to benefit from this push.  With two thirds of car consumers interested in electric vehicles, they may present a unique opportunity for dealerships particular those whose OEM is able to produce the most attractive models.  However, there are some concerns about how EV’s will affect the bottom line on the service portions of the business. A 2019 reportfrom AlixPartners estimates that dealers could see $1,300 less revenue in service and parts over the life of each EV they sell.  If electric vehicles ultimately gain the market share that they are anticipated to, dealerships may need to become more savvy in mitigating these service and parts revenue declines.  Like NADA, we remain bullish on the role of auto dealerships in the EV sales process despite concerns regarding direct-to-consumer sales channels from the OEMs.  Additionally, dealership owners have expressed some concern over how OEMs will handle the EV units from their traditional dealership models. If OEMs continue to allocate units to each dealership, this presents an opportunity.  However, if they instead follow Tesla’s lead and adopt a more direct to market approach to selling new units, this may pose a problem for dealerships.

If you would like to know more about the electric vehicle industry and what this all may mean for your auto dealership, feel free to reach out to anyone on Mercer Capital’s Auto Team.

Continue Reading

Themes from Q1 2020 Earnings Calls (2)
Themes from Q1 2020 Earnings Calls

Part 1: E&P Companies

In the first quarter of 2020, oil benchmarks ended arguably their worst quarter in history with a thud.  The concurrent overlapping impact of (i) discord created by the OPEC / Russian rift and resulting supply surge; and (ii) the drop in demand due to COVID-19 related issues was historic.  Brent crude prices began the quarter around $67 per barrel and dropped to $50 per barrel by early March before plummeting to $19 per barrel by the end of the month. WTI pricing behaved similarly although it continued to trail Brent pricing by a narrowing margin (about $5 per barrel) at the end of the quarter.  For context, WTI recovered to a range of roughly $25 per barrel to $30 per barrel relative to when the earnings calls occurred in late April and early/mid-May.  As of yesterday, WTI closed at $37.29 per barrel.  Natural gas has trended downward but has been more stable in the U.S. as its pricing is generally more tied to region-specific factors.This week, we examine some of the most discussed items and trends from E&P companies’ Q1 earnings calls. We will turn our attention to those in the mineral aggregator space in a subsequent post.E&P CompaniesOperators experienced mixed earnings in the first quarter.  Although operators started the year with a positive outlook, the events that occurred in March quickly forced them to reconsider their forecasts.  Investors and participants were far less concerned with earnings figures for the quarter than future implications of current events.Theme 1: Setting Priorities During Uncertain TimesOperators seemed inclined to comment on their priorities moving forward.  Making cuts to capital expenditures was predicted and unanimous among the group; however, the operators discussed other measures that they are implementing to combat the current depressed environment.“Paying our interest expense, retaining our people and paying our dividend remain our priorities through these uncertain times.” – Travis Stice, CEO, Diamondback Energy“First, optimizing our cash flow by adjusting our spend rate, production and cost structure.  Second, maintaining a strong balance sheet.  Third, continuing to return capital to shareholders through our dividend.  And finally, maintaining flexibility to cut further while also preserving our operational capacity.” – Timothy Leach, Chairman & CEO, Concho Resources“Our capital allocation priorities are balance sheet, dividend and capital spending.” – Scott Sheffield, Chairman & CEO, Pioneer Natural ResourcesTheme 2: Maintaining Bank Relationships in Times of NeedBanks will continue to play a substantial role as many of the operators relied on tapping into their credit lines and/or other debt instruments to satisfy liquidity needs.“Our banks are very strong.  Our credit facility is strong.  We don’t have covenants really in there, debt-to-capital covenants, only one we have, and we’re well south below that and we’re not in any realm of even approaching that.  Our debt would have to go up by $8 billion to hit that covenant level.  So, I told you we’ve got a lot of cushion.” – John Hart, CFO & Treasurer, Continental Resources“As of today, the undrawn capacity on our credit facilities total $6.75 billion.  We believe a strong balance sheet is essential to succeeding in this industry and we are committed to maintain our investment grade credit rating.” – Don Templin, CFO, Marathon Petroleum CorporationTheme 3: Prepared for the Worst While Hoping for the BestMany operators focused on their individual advantages to convey their resilience during the difficult pricing environment.“Diamondback is prepared to operate in a lower oil price environment and our cost structure will prove to be a differentiator through this downturn.  Low interest expense, low leverage, industry leading low cash G&A, a full hedge book, strong midstream contracts and benefit of Viper and Rattler will allow them to operate effectively through these uncertain times.” – Travis Stice, CEO, Diamondback Energy“Just as Pioneer entered this downturn as one of the best positioned companies, we will emerge just as strong.  The key points here, obviously, is maintaining our top-tier balance sheet through capital discipline, combined with significant cost reductions in 2020.” – Scott Sheffield, Chairman & CEO, Pioneer Natural Resources“We still have levers we can pull if conditions deteriorate further, and we will maintain flexibility to make additional cuts to our spending.” – Timothy Leach, Chairman & CEO, Concho ResourcesTheme 4: Providing Flexibility with LiquidityE&P companies are attempting to maximize liquidity to allow financial flexibility.“Just to be on the safe side, we did increase our liquidity position in early April by adding a 364-day credit facility, a little over $900 million that get our liquidity up to $2.4 billion.” – Scott Sheffield, Chairman & CEO, Pioneer Natural Resources“We’ve taken steps to maintain our financial flexibility.  We’ve secured $3.5 billion of additional liquidity, including a new $1 billion 364-day revolver, and issued $2.5 billion of senior notes.” – Mike Hennigan, CEO, Marathon Petroleum Corporation“With our reduction in spending, current hedge protection and suspensions of our buyback program, we expect to maximize liquidity and retain cash to pay down debt.” – Travis Stice, CEO, Diamondback Energy There is no question that E&P companies were forced to react quickly during the first quarter of 2020.  Macroeconomic events mixed with a global pandemic slashed demand and caused prices to plummet.  The operators tried to convey their confidence and resilience with their strategies moving forward.  Time will tell whether they come out of this situation as stronger companies.
Non-Operated Working Interests: Are You Investing in the Operator, the Oilfield, or Both? (1)
Non-Operated Working Interests: Are You Investing in the Operator, the Oilfield, or Both?

Joint Ventures in Oil and Gas

Joint ventures (JVs) are fairly ubiquitous in the energy sector with as much as 71% of upstream investment through alliance or JV relationships. Companies will often enter into JVs to share the sheer capital intensive load of upstream and midstream activities.An oil and gas JV in its most basic form is fairly straightforward. A company will take on the operator role by working the field and constructing or managing the infrastructure in a given area, and another company will assume a non-operator role by providing capital so that each player is mutually benefited. Those entering into these relationships may contribute assets, capital, technologies, or even combinations of the aforementioned in order to access advantages such as scale, risk sharing, or entry into a specific market or play and both share in the future costs.Megaprojects of over $1 billion are largely structured as JVs and are especially useful to capitalize on synergies, infrastructure, and risk sharing. In an EY study of 365 megaprojects, JVs made up 85% of the projects in upstream activities and over 50% were in LNG and pipeline projects. On the surface, this may seem like an effective way for companies to structure a hedge and mitigate systematic risk through diversification of assets, but in reality, the benefits of a JV are much harder to realize. Management considerations quickly become complicated and time horizons tend to be short-lived. Research has shown that as many as 70% of JVs in oil and gas tend to fail within 5 years. From a valuation perspective, struggling or failing JVs can put a strain on overall company value as future income streams are subjected to a greater amount of uncertainty and, thus, are further discounted. In addition, most JVs lack a defined exit plan as a study from Boston Consulting showed that only 19% of respondents had a clear exit strategy. Even in a well-structured JV agreement, the absence of an exit strategy in an environment of high failure rates inevitably results in large tangible and intangible exit costs that can erode the value the JV initially was set up to create. Does the success of the JV hinge on the quality of the oilfield or the technical ability of the operator?Put simply, executing a successful joint venture requires a number of items working in harmony such as solid due diligence, good location, cooperation between both firms, and a degree of luck on the bet they are making.It seems a bit contradictory that a large number of projects are structured as joint ventures if they have such a high failure rate. This begs the question, does the success of the JV hinge on the quality of the oilfield or the technical ability of the operator? The answer, we think, lies somewhere in the middle.Location, Location, LocationEven with the difficulties of maintaining a successful JV, many companies have been entering into joint ventures to take advantage of the oil boom that the U.S. has enjoyed for the past several years. Not surprisingly, a large portion of recently formed upstream JVs since 2016 has been in the Permian Basin, and several large midstream JVs have been formed in the Gulf of Mexico. Recently, Williams Companies Inc. announced that it is forming a joint venture with privately-held Brazos midstream in the Permian Basin to gain exposure to crude and NGL and position itself for potential midstream opportunities. Williams is offering their gas gathering assets for a 15% stake in Brazos as part of the JV terms, with Brazos retaining 85% in the venture as well as operatorship. Almost all of the assets including gas and crude pipelines, storage and a planned processing plant are coming from Brazos Midstream with Williams offering dedicated acreage, a small amount of gas gathering infrastructure and inexpensive sources of financing. Companies have been scrambling to get a piece of the pie in the more recent surge in demand for natural gas.Even though the Permian has seen a large amount of activity and natural gas prices remain low, companies have been scrambling to get a piece of the pie in the more recent surge in demand for natural gas. Royale Energy has recently entered in a JV with California Resources Corp. to drill 30 wells throughout the Rio Vista Field, the largest dry gas field in California. This agreement expands on a previous JV and will give Royale up to three years to drill in any of the formations on the property.The historic property is abundant with gas, producing approximately 4 trillion cubic feet from more than 15 stacked gas reservoirs, and according to Royale, “The joint venture will lead to multiple years of drilling activity at Rio Vista at a time of upward trending natural gas prices due to declining natural gas inventories nationwide.”These transactions are but a few of the many JVs structured in areas to take advantage of the location and the resources it has to offer in a demanding market. And while it may seem like a no-brainer for the non-operator to search out operators in successful plays, many have had a history of missing the mark when it comes to structuring effective non-operated portfolios resulting in value being left on the table or outright failure.Adding Value to Non-Operating PortfoliosOil and gas companies are typically skilled at maximizing value with their operated assets. But more often than not, these companies tend to take a backseat approach to their non-operating portfolios, almost akin to treating them like equity investments. The detached and unsystematic treatment conflicts with the shared responsibility for the success or failure of their ventures.Boston Consulting Group identifies three main sources of value loss due to failure of material participation by non-operators: A nonstrategic approach, inconsistency, and lack of priority.They also outline a four-step framework for non-operators to add value to their non-operational portfolios:Clear strategic intent about what each non-operating venture (NOV) asset contributes to broader company goalsSharp risk and opportunity assessmentConsistent NOV organization and governanceRigorous execution strategies for each NOV asset The critical factors within this framework that can really determine success within a JV are operator assessment and analyzing venture risk. Non-operators with longstanding relationships and clearly defined roles and objectives (for example, ExxonMobil and Shell’s continued relationship in the North Sea) would most likely apply a less stringent approach to assessing key operator risk. But those looking to invest in active plays in the U.S. from a non-operator perspective should assess operators on the following criteria:Level of experience and familiarity of the play/assetUnderstanding and application of proven technologiesHistory of productivity and efficiencyClear understanding of role within the partnershipStrong safety, environment, and previous contract records andAlignment on ethics. Venture risk must be analyzed by non-operators to properly determine uncertainties related to the underlying objective within the JV. Resource size, character, and technology application must be considered especially when undertaking more exploratory ventures. Commercial and economic uncertainties should also be analyzed since a major culprit for failing JVs are large cost overruns and other unexpected costs.Final ThoughtsA major benefit of a JV is to gain exposure to areas and effectively deploy resources and capital where it could be best used and thus create maximum value. As we have mentioned above, however, failure rates are very high in the short term mostly as a consequence of cost overruns due to inadequate planning. But the natural frictions associated with a JV make planning and communication all the more important. While non-operators need the proper location for success in a joint venture, they can get further through proper due diligence and planning concerning operators.We have assisted many clients with various valuation needs in operator and non-operator roles in North America and around the world.  In addition to our corporate valuation services, Mercer Capital provides investment banking and transaction advisory services to a broad range of public and private companies and financial institutions.  We have relevant experience working with companies in the oil and gas space and can leverage our historical valuation and investment banking experience to help you navigate a critical transaction, providing timely, accurate and reliable results. Contact a Mercer Capital professional to discuss your needs in confidence.
How to Value an Oil and Gas Mineral Royalty Interest (1)
How to Value an Oil and Gas Mineral Royalty Interest
Well-informed buyers and sellers are critical to an efficient market for royalty interests because there is a specialized and relatively complex body of knowledge to consider in the transfer of these types of assets.Often called a net revenue interest (NRI), royalty interests do not bear the costs of production and only participate in the potential upside of a resource.  The value of a royalty interest, however, is often difficult to observe because they are typically closely held.  In addition, once discovered and drilled, the natural resources are physically depleted, resulting in a declining asset as opposed to a growing one.A lack of knowledge regarding the worth of a royalty interest can be very costly. A shrewd buyer may offer a bid far below the interest’s fair market value, opportunities for successful liquidity may be missed, or estate planning could be incorrectly implemented based on misunderstandings about value.Understanding how royalty interests are properly appraised will ensure that you maximize the value of your royalty, whenever and however you decide to transfer it.This blog post summarizes our whitepaper – providing an informative overview of the valuation of mineral royalty interests within the oil and gas industry.  While there are a myriad of factors (mostly out of a royalty holder’s control) impacting the economics of a royalty interest, this blog post focuses on valuation methodology.What Does the Valuation Process Entail?Valuation approaches refer to the basis upon which value is measured.There are three commonly accepted approaches to determining value:Asset-based ApproachMarket ApproachIncome Approach In the realm of business valuation, each approach incorporates procedures that may enhance awareness about specific economic attributes that may be relevant to determining the final value of a given entity. Ultimately, the concluded valuation will reflect consideration of one or more of these approaches (and perhaps several underlying methods) as being most indicative of value for the subject interest under consideration. However, due to fundamental structural differences between businesses and assets, the available valuation methodologies tend to be utilized differently when valuing royalty interests. 1The Asset-Based ApproachThe asset-based approach can be applied in different ways, but the general idea is that the enterprise value of a business is given by subtracting the market value of liabilities from the market value of assets. While the asset-based approach can be useful when valuing companies operating within the oil and gas industry, this approach is not typically employed to determine the value of a royalty interest.Oftentimes a mineral royalty owner purchased land which included the mineral rights and an allocation of surface vs mineral rights was not performed. Additionally, considerable time may have passed between the time the surface and mineral rights were purchased and the valuation date. Adding to the ambiguity of the cost basis of the asset, mineral royalty interests are often family assets that are handed down for generations. For this reason, the asset-approach is rarely used to determine the market value of mineral royalty interests unless the mineral rights were recently purchased.The Market ApproachThe market approach utilizes transaction pricing from guideline transaction data or valuation multiples from a group of publically held companies to determine the value of a privately held enterprise or asset. To develop an indication of mineral royalty interest value using the market approach, you can utilize data from market transactions of mineral interests in similar plays. This data can be derived from direct transactions of mineral royalty interests or from publically traded royalty trusts and partnerships.Direct comparable transactions of mineral royalty interests are often the best indication of fair market value.  However, the data with which to benchmark a subject mineral royalty interest against is often unavailable.  If it is available, a careful comparative analysis must be made.  Royalty trusts and partnerships hold various mineral royalty interests in wells operated by large exploration and production companies. Royalty trusts and partnerships tend to have very low, if any, operating expenses and can be an investment to provide exposure to oil and gas prices.Acquisition data from these trusts can be utilized to calculate valuation multiples on the subject royalty’s performance measure(s). This will often provide a meaningful indication of value as it takes into account industry factors (or at least the market participants’ perception of these factors) far more directly than the asset-based approach or income-based approach.Traditional oil and gas earnings multiples, such as EV/ EBITDAX, should not be used to calculate indication of values because royalty trusts do not have high operating costs and operational earnings margins are not a necessarily meaningful indication of performance for a royalty owner. Rather, a royalty trust's performance can be better understood by its distribution yield and potential for future revenue streams from new, undrilled wells.In many ways, this approach goes straight to the heart of value: a mineral royalty is worth what someone is willing to pay for it. However, the market approach is not a perfect method by any means for businesses or for mineral royalties.Royalty trust transaction data may not provide for a direct consideration of specific mineral royalty characteristics; it is imperative that the value conclusion be adjusted for differences in value level and in well economics, potential future drilling locations, among other factors. In any valuation, the more comparable the transactions are, the more meaningful the indication of value will be.The Income ApproachThe income approach can be applied in several different ways. Generally, such an approach is applied through the development of a cash flow or ongoing earnings figure and the application of a multiple to those earnings based on market returns. For mineral royalty interests, however, we oftentimes perform a discounted cash flow analysis. This approach allows for the consideration of characteristics specific to the subject mineral royalty, such as its well economics making it the most commonly used approach for mineral royalty interest valuations.To perform a royalty’s DCF analysis, production levels must be projected over the well’s useful life. Given that well production decreases at a decreasing rate, these projections can be calculated through deriving a decline rate from historical production. Revenue is a function of both production and price; as such, after developing a legitimate prediction of production volumes, analysts must predict future price values. The stream of revenue is then discounted back to present value using a discount rate that accounts for risk in the industry.Because revenue cash flows are the main driver of mineral royalty values, the income approach is the most reasonable and supportable valuation approach when determining the value of a mineral royalty interest.ConclusionA proper valuation of a mineral royalty interest will factor, to varying degrees, the indications of value developed utilizing the market-based and income-based approaches outlined above. A valuation, however, is much more than the calculations that result in the final answer. It is the underlying analysis of the mineral royalty and its unique characteristics that provide relevance and credibility to these calculations. This is why industry "rules-of-thumb" are dangerous to rely on in any meaningful transaction.Such "rules-of-thumb" fail to consider the specific characteristics of an interest and, as such, often fail to deliver insightful indications of value. A mineral royalty owner executing or planning a transition of ownership can enhance confidence in the decisions being made only through reliance on a complete and accurate valuation of the interest.Mercer Capital's Oil & Gas team has extensive experience valuing mineral royalty interests. Despite attempts to homogenize value through the use of simplistic rules of thumb, our experience is that each valuation is truly unique given the purpose for the valuation and the circumstances of the interest. We hope this information, which admittedly only scratches the surface, helps you better shop for royalty valuation services and understand valuation mechanics.We encourage you to extend your wealth planning dialogue to include valuation of any mineral interests because, sooner or later, a valuation is going to happen. Proactive planning and valuation services can alleviate the potential for a negative surprise that could complicate an already stressful time in your personal life.For more information or to discuss a valuation or transaction issue in confidence, do not hesitate to contact us at (901) 685-2120 or (214) 468-8400.End Note1 Treasury Regulations 1.611-2(d) asserts that the income approach will not be used if the value of a mineral property can be determined using the cost-approach (under the asset approach) or the market approach.  However, those circumstances are rare and not consistent with industry norms.  The income approach is most often employed to estimate the fair market value of mineral properties such as this.

Cart

Your cart is empty