The option pricing model, or OPM, is one of the shiniest new tools in the valuation specialist’s toolkit. While specialists have grown accustomed to working with the tool and have faith in the results of its use, many non-specialists remain wary, as the model – and its typical presentation – has all the trappings of a proverbial black box. The purpose of this post is to clarify the fundamental insight underlying the model and illustrate its application so that non-specialist users of valuation reports can gain greater comfort with the model. In Part 2, we will provide address some qualitative concerns regarding use of the method in practice.
What is the OPM Used For?
First, a bit of ground-clearing. What does the OPM not do? The OPM is not a method for determining the value of a business enterprise. The method does not consider the value of the subject business enterprise’s assets and liabilities, evaluate the present value of projected cash flows, or concern itself with a comparison of the subject business enterprise to similar businesses with observable market values.
The OPM becomes useful only after the value of the business enterprise has been determined through application of valuation methods under the asset-based, income and market approaches. The OPM is a tool for allocating the total equity value to individual ownership classes in a complex capital structure. For enterprises with a simple capital structure (i.e., a single class of common equity), the OPM is not necessary and should not be used. However, when the subject business enterprise features multiple classes of preferred and/or common equity with differing economic rights, the OPM can be a most effective tool for differentiating the value of the various ownership classes. Such complex capital structures are most frequently encountered in early-stage enterprises, which are frequently valued for equity compensation and portfolio fair value reporting.
What is the Fundamental Insight Underlying the OPM?
The “Eureka!” moment behind the OPM is the recognition that the payoffs to complex securities with arcane features can be mimicked through an appropriately-constructed portfolio of component securities (most commonly fractional call options or digital options with varying strike prices). As a result, what may seem on the surface to be an impossible valuation task can be mastered if the economic payoffs for a complex security are untangled and re-cast as a bundle of simple securities that can be more readily valued. The method holds out the promise of replacing subjective judgment with replicable analysis. Hence, the esteem in which the method is held among auditors.
Consider a simple example. SimpleCo is capitalized with a single class of preferred shares and a single class of common shares. Upon liquidation or sale of SimpleCo, the preferred shareholders are entitled to receive $500, with the residual accruing to the common shareholders. The economic terms of the capital structure are summarized in Exhibit 1.
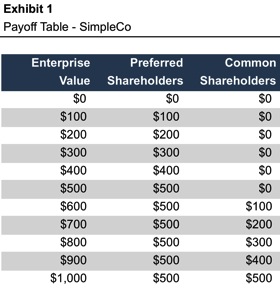
Two observations can be made from a brief study of Table 1.
- Financial engineering does not create value. In every possible state of the world, the sum of the payoffs to the preferred and common shareholders is equal to the equity value. Creative pie-slicing does not make the pie any bigger.
- The payoffs to the common shareholders have the same basic shape as a call option. The holder of a call option receives no payoff when the stock price is less than or equal to the strike price. However, the call option holder participates dollar-for-dollar in appreciation above the strike price.
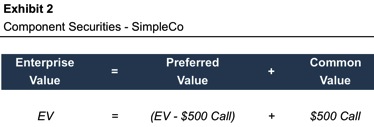
In light of these observations, we can express the value of the preferred and common share as shown in Exhibit 2.
By recasting the preferred and common equity classes into the component securities, the subjective judgment associated with selecting the appropriate yield on the preferred shares has been eliminated, as the value of the preferred shares is simply the excess of equity value over the value of a call option with a strike price of $500.
What is a “Breakpoint”?
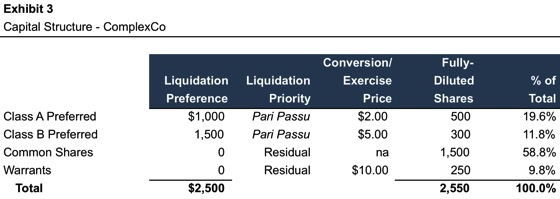
Moving to a more complex example will allow us to explain and define additional vocabulary terms from the OPM. Exhibit 3 summarizes the capital structure for ComplexCo.
While this capital structure is still quite tame relative to many real-world counterparts, it is sufficiently complex to illustrate the fundamental tools used in OPM applications.
One could construct a payoff table similar to that in Exhibit 1. While certainly possible, doing so can become a bit cumbersome as the complexity of the capital structure increases. As a shortcut, valuation specialists identify the relevant “breakpoints” in the capital structure. In the OPM, a breakpoint is an equity value beyond which the marginal allocation of incremental value to the various equity classes changes. SimpleCo had a single breakpoint, while ComplexCo will prove to have four. We often see cases in which a dozen or more can be identified.
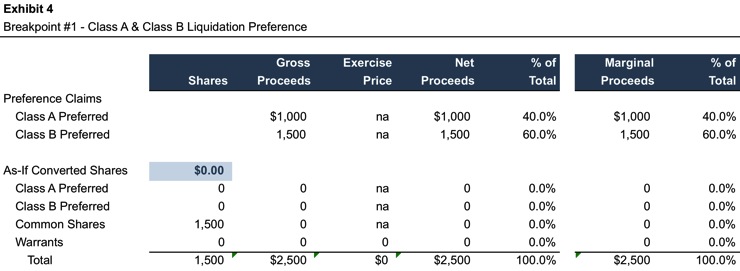
Breakpoints are identified starting with an equity value of $0. For ComplexCo, the Class A and Class B preferred shares participate on a pari passu basis, so the first breakpoint is the aggregate liquidation preference, or $2,500 (the total “Net Proceeds” in Exhibit 4). Additional elements of Exhibit 4 will be explained as we proceed through the example.
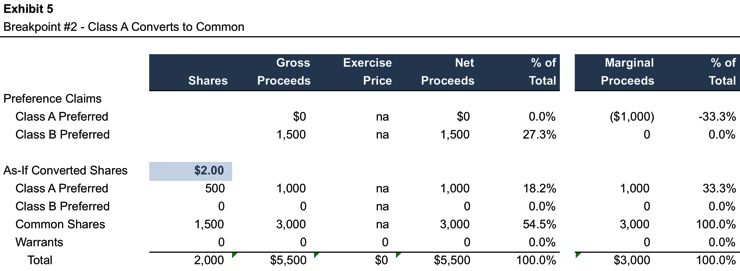
For equity values from $0 to $2,500, the Class A preferred shareholders will receive 40% of value, and the Class B preferred shareholders will receive 60%. For equity values above $2,500, the marginal proceeds will be allocated differently, as shown in Exhibit 5. This change in allocation is what makes $2,500 a breakpoint in this example.
The next change in the allocation of proceeds will occur when the Class A Preferred shares convert to common. At common share values greater than $2.00 per share, the Class A Preferred shareholders will elect to convert, as their net proceeds from conversion will exceed the liquidation preference. As a result, the number of as-if converted shares increases, but the liquidation preference attributable to the Class A shares is forfeited. The corresponding breakpoint equity value is $5,500.
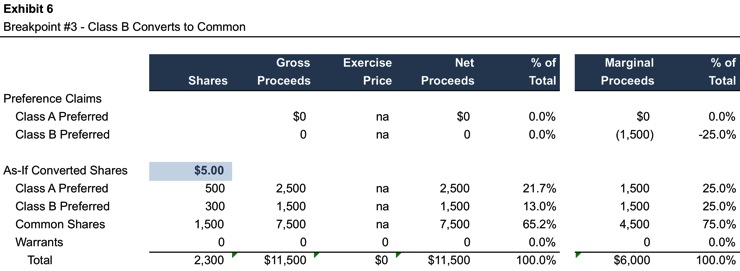
Breakpoint #3 corresponds to the common share price that will induce the Class B Preferred shareholders to convert to common shares ($5.00). In other words, the Class B Preferred shareholders will elect to convert, and be treated as common shareholders when the total equity value exceeds $11,500.
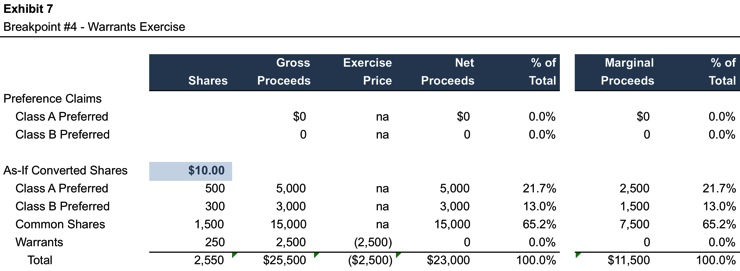
As shown in Exhibit 7, Breakpoint #4 corresponds to the exercise of outstanding warrants. Note that while the warrants will be exercised at $10.00 per share, the warrant holders will pay $10.00 per share to do so, so the net proceeds to the warrants remains $0 at that point, and the equity value breakpoint is the total “Net Proceeds”.
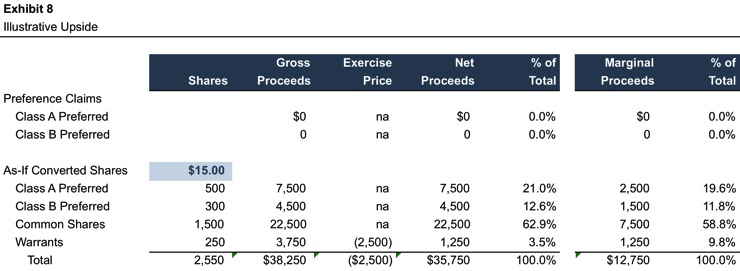
Beyond the last breakpoint, marginal proceeds can be allocated according to an additional illustrative payoff schedule assuming some arbitrary share price in excess of the last breakpoint, as shown in Exhibit 8.
What is a “Tranche”?
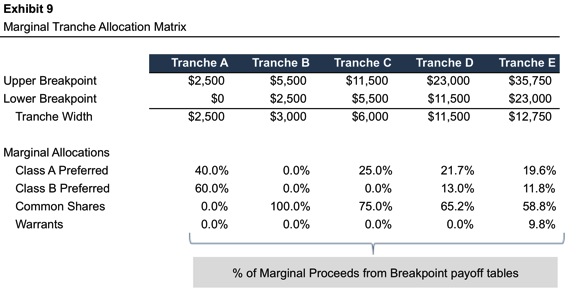
The next step in applying the OPM is to build a matrix that identifies the marginal allocation percentages between the various breakpoints. For purposes of the OPM, a “tranche” is the difference between two adjacent breakpoints. The marginal proceeds within a given tranche are allocated to the various equity classes in fixed proportions.
The marginal tranche allocation matrix summarizes the relative allocation to the various equity classes within the respective tranches. The allocations were calculated in the corresponding breakpoint tables. The illustrative upside scenario (Exhibit 8) allows us to confirm marginal allocation percentages for values in excess of the final breakpoint. Note that the marginal allocation percentages for the final tranche are equal to the proportion of total fully-diluted shares outstanding from each equity class.
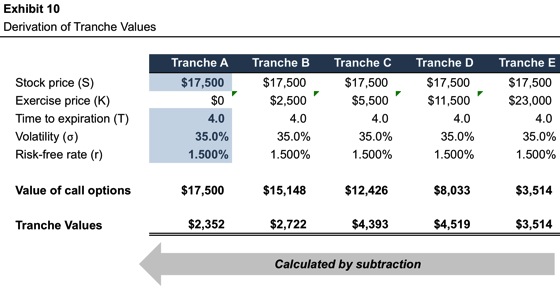
The next step is to determine the value of each tranche. In doing so, we will work from right to left. Recall from our SimpleCo example that the portion of equity value in excess of a given amount can be calculated with reference to a call option on the underlying equity value with a corresponding strike price. In the case of ComplexCo, the value of the upside in excess of the final breakpoint ($23,000) is equal to the value of a call option having a strike price equal to that breakpoint value.
What about the value of the next tranche down? Following the same approach, the value of all of the upside beyond $11,500 is equal to the value of a call option on the underlying equity value having that strike price. The value of this call option represents the combined value of Tranche D and Tranche E. Since the value of Tranche E is known, the value of Tranche D can readily be calculated by subtraction. As shown in Exhibit 10, the value of lower tranches is measured following the same procedure. Note that – in keeping with first observation above – the sum of the individual tranche values is equal to the equity value. Financial engineering can create complexity, but does not create value.
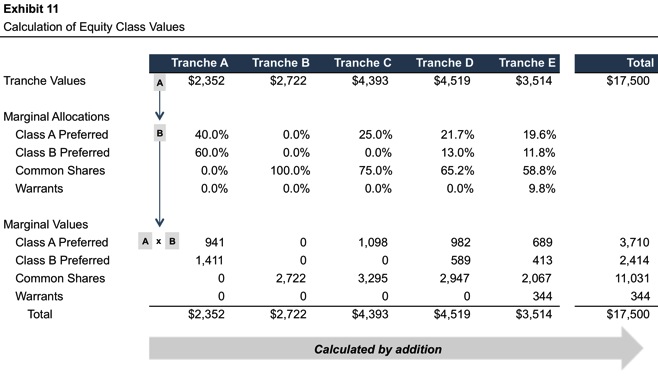
Finally, the tranche values are apportioned to the individual equity classes in accordance with the percentages from the marginal tranche allocation matrix (Exhibit 9). As shown in Exhibit 11, the value of a particular equity class is the sum of the values of that class’s respective allocations for each tranche.
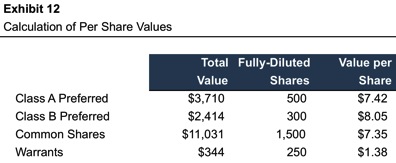
The aggregate values are converted to per share amounts in Exhibit 12.
On a per share basis, the results conform to expectations regarding the relative value of the various classes. The higher liquidation preference of the Class B preferred shares causes those shares to be most valuable. The common shares, which do not have any liquidation preference, are worth less than either class of preferred shares. Finally, the strike price on the warrants reduces the value of those instruments relative to common shares.
In Part 2 of this post, we will offer some concluding thoughts on the use of the OPM in practice.
- Additional economic features that can be accommodated in the OPM
- Assessing the reasonableness of required inputs & sensitivity to inputs
- Comparison of strengths and weaknesses relative to the probability-weighted expected return method
- Whether the OPM backsolve method is always an appropriate way to convert per share transaction prices to an implied equity value
- Reconciling the OPM with market participant perspectives on value
Related Links
- Marking Illiquid Investments in Liquid Funds
- Preferences and FinTech Valuations
- Unicorn Valuations: What’s Obvious Isn’t Real, and What’s Real Isn’t Obvious
- Consequences of Calcified Cap Charts: A Few Thoughts on Startup Equity-Based Compensation
Mercer Capital’s Financial Reporting Blog
Mercer Capital monitors the latest financial reporting news relevant to CFOs and financial managers. The Financial Reporting Blog is updated weekly. Follow us on Twitter at @MercerFairValue.
