October 2023 SAAR


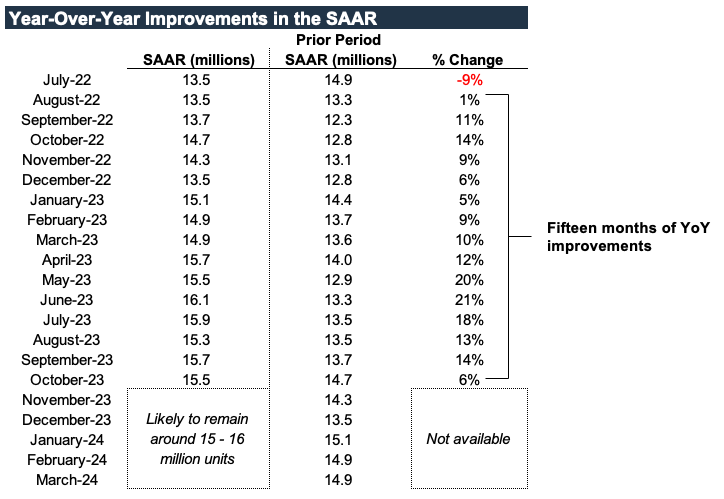
The October 2023 SAAR was 15.5 million units, down 1.2% from last month but up 5.6% compared to this time last year. As we predicted in last month’s SAAR blog, this month officially marks the end of a seven-month streak of consecutive double-digit year-over-year improvements in the SAAR. While we do expect to see double-digit improvements pop up over the next few months, the end of this streak is a reminder that the industry has been on the path to recovery for some time now and is slowing down to a more normalized, sustainable level.
However, while this month’s year-over-year improvement happens to be less than 10%, the larger trend of consecutive year-over-year improvements has stayed strong and extended to 15 consecutive months. Going forward, we expect this streak to extend to at least 17 months to finish 2023 and perhaps even 20 months through March 2024. January 2024 is the most likely month in which the streak could be broken during this time period. See the table below for a look at the last fifteen months of year-over-year improvements and the next five months of anticipated improvements.
Unadjusted Sales Data
The chart below shows unadjusted total sales volumes for the last eight Octobers:
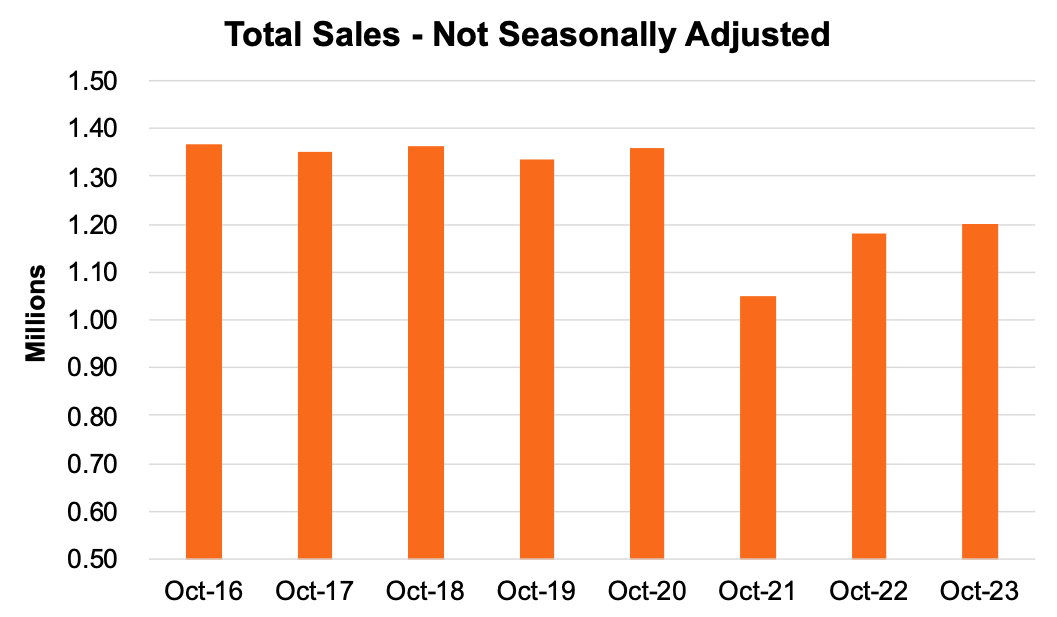
On an unadjusted basis, the industry sold 1.20 million total units last month, marking the highest level of October sales since 2020 and bringing the 2023 total to 12.8 million units. Total sales of 15.5 – 16 million units seem almost inevitable at this point, especially considering that December is typically the highest-selling month of the year. Just under 16 million units would compare favorably to last year’s 14.2 million units and 2021’s 15.4 million units.
Inventory and Days’ Supply
According to the NADA, new light vehicle inventory on the ground and in transit is expected to total 2.15 million units at the end of October 2023, which compares favorably to the beginning of last month and the reported 2.06 million units at the beginning of October. This is a bit of a surprise, as the United Auto Workers (“UAW”) strike dominated headlines throughout most of October. While we understand that there should be a lag in the effects as a result of the strike, it seems like OEMs have felt no immediate hunger pangs in response to these production stoppages. It’s worth noting the UAW strike only impacted domestic OEMs, who were generally in greater supply than their peers heading into the strike.
See our blog from a few weeks ago for more on the UAW strike. Furthermore, keep an eye on Mercer Capital’s weekly auto blog over the next few months for a review of the final results of the strike once the dust settles. Upon writing this blog, there are currently tentative agreements between the UAW and each of the Detroit Three automakers. However, this labor dispute has not been formally resolved quite yet.
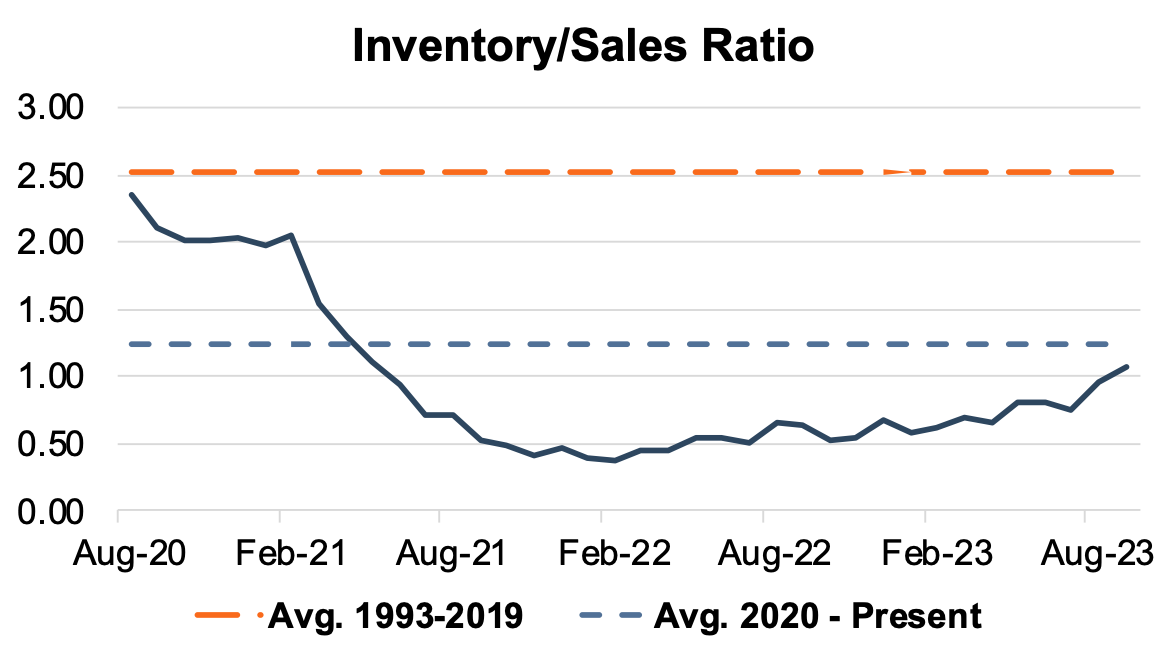
We have seen signs of recovery in the industry inventory-to-sales ratio for quite some time now. As a result of this steady recovery, the most recent September 2023 data marks the first time the ratio has been above 1.0x since May 2021, almost two and a half years ago. For perspective, an inventory-to-sales ratio in excess of 1.0x means that the seasonally adjusted inventory level at the end of the month was greater than reported sales in that month. This implies an expansion in nationwide inventory during September, as opposed to the inventory stagnation or drawing-down we have seen over the past two and a half years. See the chart below for a look at the industry’s inventory-to-sales ratio over the last three years.
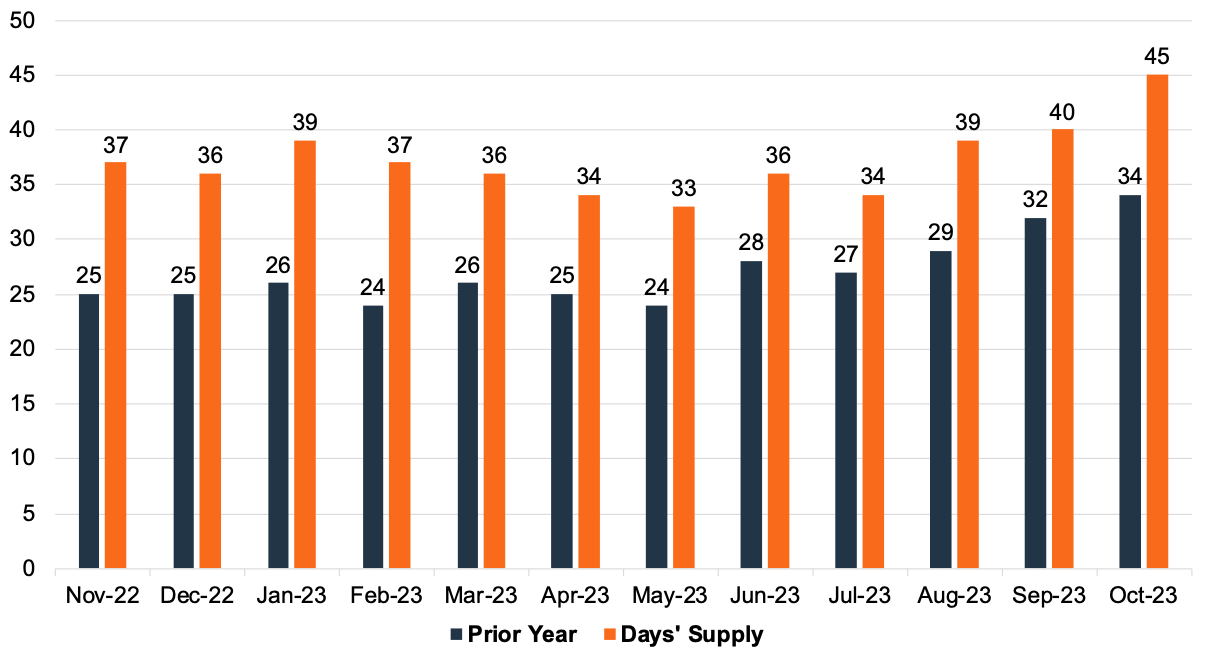
Another way to view the relationship between auto sales and inventory balances is through Days’ Supply, which has steadily increased over the past year. A Days’ Supply of 45 in October 2023 marks the highest level of Day’s Supply reported by Ward’s Intelligence in recent memory. See the chart below for a close look at Days’ Supply for the entire industry over the past year (per Wards Intelligence):
Thomas King, president of data and analytics at J.D. Power, had these statements to make about inventory availability and its relationship with sales volumes in September:
“Retailers continue to pre-sell vehicles, however higher inventory levels enable more shoppers to buy directly from dealer lots. In October, 42% of vehicles are projected to be sold within 10 days of their arrival at the dealership, which is down from the peak of 57% in March 2022. The average time that a new vehicle spends in the dealer’s possession before being sold is expected to be 30 days, up 11 days from a year ago, but still less than half the pre-pandemic average of 70 days.”
“Despite a slight increase in inventory levels compared with previous months, the industry is still facing a supply shortage. This is evident from consumer spending and inventory turnover rates in October, which highlight robust demand and ongoing supply challenges. This situation further strengthens the foundation for sustained strong new-vehicle pricing and overall profitability.”
Transaction Prices
Mr. King also had this to say about the average transaction price in September:
“As inventory and sales volumes improve, the average new-vehicle retail transaction price is declining modestly, trending down $451—or 1%—from October 2022, to $45,651. However, even with the decline in average transaction prices, consumers are on track to spend nearly $43.7 billion on new vehicles this month—the highest on record for the month of October and 0.8% higher than October 2022.”
Increased supply across all models and a shifting vehicle mix are modestly dragging down the average transaction price. Persistent economy-wide inflation and the ongoing UAW strike are factors that could turn pricing momentum in the other direction. See the chart below for context around the monthly average transaction price from March 2019 to September 2023.
![]()
Incentive Spending
According to J.D. Power, average incentive spending per unit in October is expected to reach $1,774, up from $851 a year ago. Incentive spending as a percentage of the average MSRP is expected to increase to 3.7%, up 1.7 percentage points from October 2022. Average incentive spending per unit on trucks/SUVs in September is expected to be $1,881, up from $935 a year ago, while the average spending on cars is expected to be $1,373, up from $835 a year ago. After years where many vehicles were purchased at or above MSRP, that trend appears to be reversing as retailers revert to discounts. However, it is important to note that these are average figures, and depending on the market and, perhaps more importantly, the vehicle make/model, transactions are still occurring closer to MSRP.
November 2023 Outlook
Mercer Capital’s outlook for the November 2023 SAAR continues to be in the 15-16 million range. Industry supply chain conditions have improved but face new challenges like strikes and input pricing inflation. Sales volumes have remained above the past couple of years as dealers are seeing better inventory availability. Still, it is notable that the past three months have been closer to 15.5 million than the recent peak of 16.1 million in June. Consumer activity may be indicating that affordability is becoming an issue, as evidenced by falling transaction prices and rising incentives. Still, we believe the need to replace the aging car parc will support sales levels.
Mercer Capital provides business valuation and financial advisory services, and our auto team helps dealers, their partners, and family members understand the value of their business. Contact a member of the Mercer Capital auto dealer team today to learn more about the value of your dealership.