Where Is the Auto Dealer Industry in the Cycle?
After a few strong years, automotive retail continues to return toward more “normal” levels. Since the onset of the pandemic, annual light vehicle volumes (reported monthly and known in the industry as “SAAR”) in the U.S. have barely crested the 17 million figure that prevailed consistently throughout 2015-2019. Alongside reduced sales volumes, the pandemic and ensuing chip shortage significantly reduced key expenses (headcount, advertising, and interest expense) while significantly raising margins on the vehicles that dealers were able to acquire and sell.
For years, it’s been a question of when, not if, things would normalize. The more difficult follow-up question has been, “Where will earnings and margins normalize?” Here are a few key items we’ll consider in terms of returning to normal:
- Volumes (SAAR)
- Days’ supply
- Dealership profitability (Gross profit per unit pre-tax earnings margins)
SAAR
As noted above, over 17 million vehicles were sold in the U.S. five years before the pandemic. In April 2020, we launched this blog, coinciding with a SAAR below 8.5 million, down 50%. At that time, we analyzed how long it might take to return to normal, considering a 2015 academic paper that estimated 15.6 million as a steady state figure. After the three previous economic shocks noted in that blog (e.g., the debt crisis in 2008), it took 3-7 years to rebound.
Almost four and a half years later, we have yet to return to a SAAR of 17 million, except for March–May 2021, which coincided precisely between the COVID bounce back and the onset of the chip shortage. We also note that annualized figures are tricky, and we suspect the materially impaired results of March and April 2020 may have skewed the annualization of 2021’s results.
The question remains: must we return to 17 million to be “back to normal”?
The question remains: must we return to 17 million to be “back to normal”? When industry participants in mid-2022 wondered how long it would take to return to “normal,” many referenced the 17 million threshold. As we’ve written, we are skeptical this number should be the real bogey as the industry consistently performed above levels previously seen when it was reporting at and above 17 million units. Adding a simple “line of best fit” to the SAAR dating back to 1976 implies 16.5 million, which the industry is closer to reaching than 17 million.
Have volumes normalized?
Our judgment is that despite not yet reaching 17 million, volumes have sufficiently normalized. Now, the composition of those volumes is worth considering.
Days’ Supply
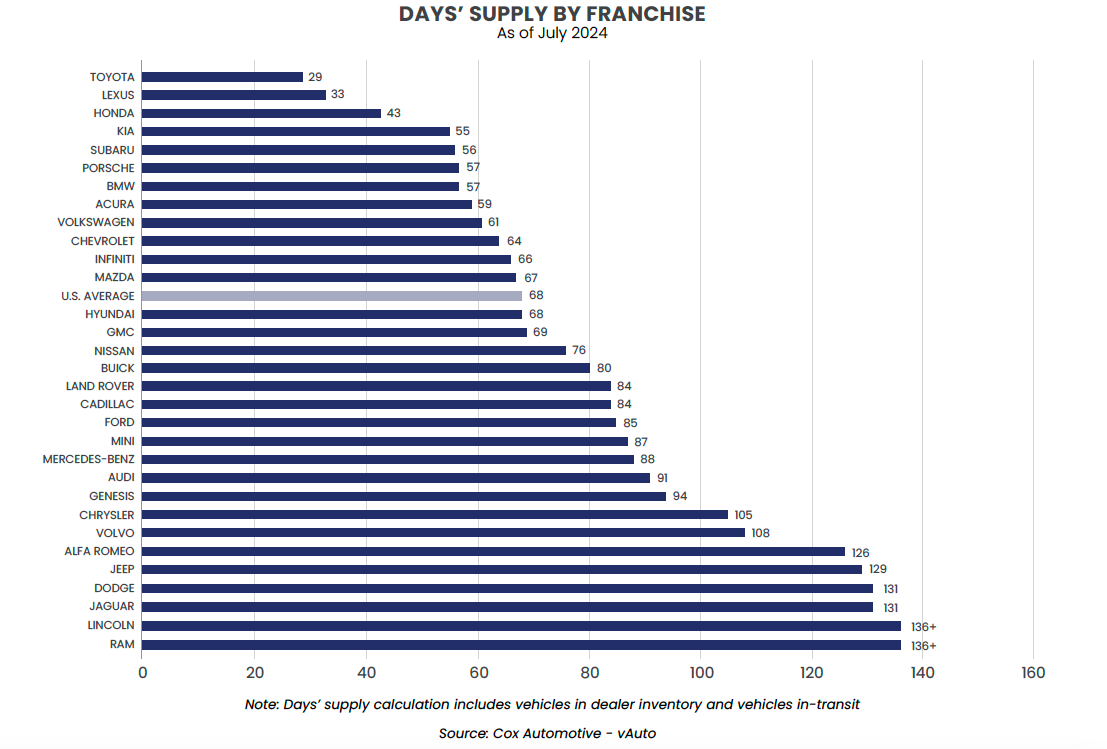
Averages can be a dangerous thing. The average of 1 and 5 is 3. But averages and medians are measures of central tendency that are supposed to tell you something about the group. If you look up a restaurant on Yelp and it has only two ratings, no reviews, and one rating is five stars and the other is one star, does the average of 3 really tell you anything? Look at the graph below from our friends at Haig Partners.

Click here to expand the image above
Average days’ supply as of July 2024 was about 68 days, or a little over two months, which is back to pre-COVID levels. But if you talk to a Toyota dealer and a CDJR dealer, you’ll question whether they are even operating in the same industry with the difference in the tenor of the conversation. Toyota appears to have gotten its EV/hybrid strategy “right” by not forcing loss-producing EVs before the market was ready to accept them. CDJR is suffering from a different problem; they’ve overproduced, and their vehicles saw much greater increases in price than their peers. The net result is that consumers vote with their wallets and buy other vehicles.
Eighteen months ago, most executives acknowledged peak profitability would decline
Eighteen months ago, most executives acknowledged peak profitability would decline (as discussed in the next section of this blog). But one quote that looks interesting in hindsight was from Sonic Automotive, who said:
“We’re working with our manufacturer partners to make sure they understand keeping, that they supply at a reasonable level, call that 25 to 35 days instead of pre-pandemic 60 to 80 days is the right way to run this business. And I think they all agree with that.”
As it turns out, not all OEMs agreed. CDJR has over 100 days’ supply, which has ripple effects on dealers who directly compete with their models. All consumers like to feel they got a deal, and with CDJR needing incentives to normalize their lots, their GPUs are significantly below the composite figure below.
Has days’ supply normalized?
We believe supply has normalized in the aggregate, but the industry’s cyclicality is evident, and there are clear winners and losers, at least for now.
Dealership Profitability
The second half of the 2010s was strong and stable for OEMs and dealers alike. The average dealership had approximately $1.4 million in pre-tax earnings on about $60 million in revenue or 2.4% pre-tax margins. This was remarkably consistent, with about 75 new and 60 used units retailed each month, generating gross profits of about $2,000 and $2,400 per unit, respectively. Fixed operations contributed just under half of gross profit in these years and covered over 55% of fixed expenses (all figures per the NADA).
Over the past few years, fixed operations have contributed considerably less as a percentage of gross profit when compared to historical levels, but it’s not because of declines in the performance of the profit center. Fixed ops were lower in 2020 due to a lack of mileage put on vehicles with people working from home, and some technician shortages affected fixed ops. However, the greater contribution from variable operations, despite lower volumes, over the past few years made the largest difference in the composition of gross profit. Variable ops took off due to the explosion in gross profit per unit, as demonstrated in the following graph from Haig Partners. Fixed operations didn’t slow down; the variable side grew.

Click here to expand the image above
Since the pandemic, auto dealer executives have acknowledged the outperformance of variable operations but have estimated a “new normal” to varying degrees. The expectation has been that normalization would come in below peak levels but above pre-COVID levels, which has borne out thus far. We believe dealership profitability still has some room to decline as fixed expenses are likely only going upward, interest rates and inventory availability are significantly pressuring holding costs, and discounting becomes more prevalent as OEMs try to capture market share. There will always be an inherent push-pull between the OEM-dealer, as in all franchisor-franchisee relationships. But it is more pronounced in the auto industry as the brands not only set branding strategy and (to a lesser extent) price but also set volumes, which may not always be in the best interest of their ever-consolidating confederacies of sales arms (dealers).
Have auto dealers’ earnings fully normalized?
We don’t think so. There is room to decline, but we agree that most dealers will land above pre-COVID levels due to improved operations and inflation. Ultimately, variable sales are about a spread between invoice and sticker, and it is unreasonable to expect sustained pricing power above MSRP in a franchisor-franchisee relationship.
Impact of Cyclicality from a Valuation Standpoint
Auto retailing is one of the most cyclical industries. Aswath Damodaran of NYU’s Stern School of Business updates betas by sector annually, and Auto & Truck ranks 5th out of 96 industries with a beta of 1.52. Beta is a key input that valuation practitioners like us consider when determining the cost of capital for equity investors. A high beta illustrates the volatility in the industry, which one might think wouldn’t be so volatile given the long shelf-life of vehicles and the relative predictability of fixed operations.
Auto retailing is one of the most cyclical industries
From a valuation perspective, there are numerous ways to consider volatility. One way would be to use a higher required rate of return, which would represent an increased risk of future cash flows. However, the cost of capital is inextricably linked to the cash flows to which they are applied. If you provided me with lofty future projections saying the dealership is about to meaningfully improve its performance, all else equal, I would probably assess those projected cash flows as requiring a higher discount rate. This is why valuation practitioners in the auto industry rarely use the discounted future cash flows method, instead taking a multi-year average of recent historical earnings.
Before the pandemic, our friends at Haig and Kerrigan assessed Blue Sky multiples which could be applied to the trailing twelve months of earnings. With COVID and the chip shortage came significantly improved earnings and diverging opinions about the future path of those earnings, causing the investment bankers to employ a multi-period average considering both pre- and post-COVID results. Given the relative tranquility pre-COVID, we recognize a 5-year average from 2015-2019 may not have been materially different than the most recent period. Now, performance is so disparate across brands and markets that prescribing a one-size-fits-all approach for determining ongoing earnings is a fool’s errand.
Conclusion
As outlined above, various industry metrics are almost at pre-COVID levels, but how they impact your dealership heavily depends on your brand and market. It’s all well and good if average industry-wide performance for auto dealers remains above historical norms, but it’s all the better if your dealership is one of those that is actually enjoying the benefits of enhanced performance.
At Mercer Capital, we perform valuations of auto dealerships for owners and advisors all around the country for a variety of purposes. Additionally, we follow the auto industry closely to stay current with market trends in dynamic times such as these. Contact one of our professionals today to discuss how these trends may be affecting the market for your dealership.
 Auto Dealer Valuation Insights


