October was another sour month for bank investors. The KBW Nasdaq Regional Bank Index declined 6.5% through October 27 and is down 27.9% year-to-date. While the failure of SVB and Signature Bank in March caused bank stocks to nosedive into the end of the first quarter, the ~100bps lift in the yield in the 10-year UST note produced a similar result during September and October.
Not surprisingly, bank M&A activity remains muted, punctuated by an occasional transaction of note such as Evansville-based Old National Bancorp (NYSE: ONB) and Nashville-based CapStar Financial Holdings, Inc. (NASDAQ: CSTR) agreeing to merge in a stock-swap that valued CapStar at $346 million.
Acquirers’ shares trade at low multiples, and fair value marks of low-rate, fixed-rate assets are draconian. Plus, there is the capital “question” given an extended benign credit cycle and the gap between regulatory capital and core equity capital that is marked for unrealized bond losses. Nonetheless, the best deals (and loans) often are made during challenging times.
Like conventional bank deals, transaction volume for specialty finance companies is modest compared to recent years. More so than in recent years, activity can be described as tuck-in deals to introduce or augment a product offering, or opportunistic for distressed sales. Generally, bank acquirers have favored commercial finance over consumer finance lenders given challenging consumer compliance associated with auto finance and highly cyclical nature of mortgage banking.
As shown in the table below, there have been only five specialty finance deals involving a bank buyer announced since the beginning of the year compared to 13 in 2022 when rising rates sidetracked deal activity during the second half of the year. Prior to 2022 excluding 2020, a typical year would entail banks acquiring 20+ specialty finance companies per year according to S&P Global Market Intelligence.
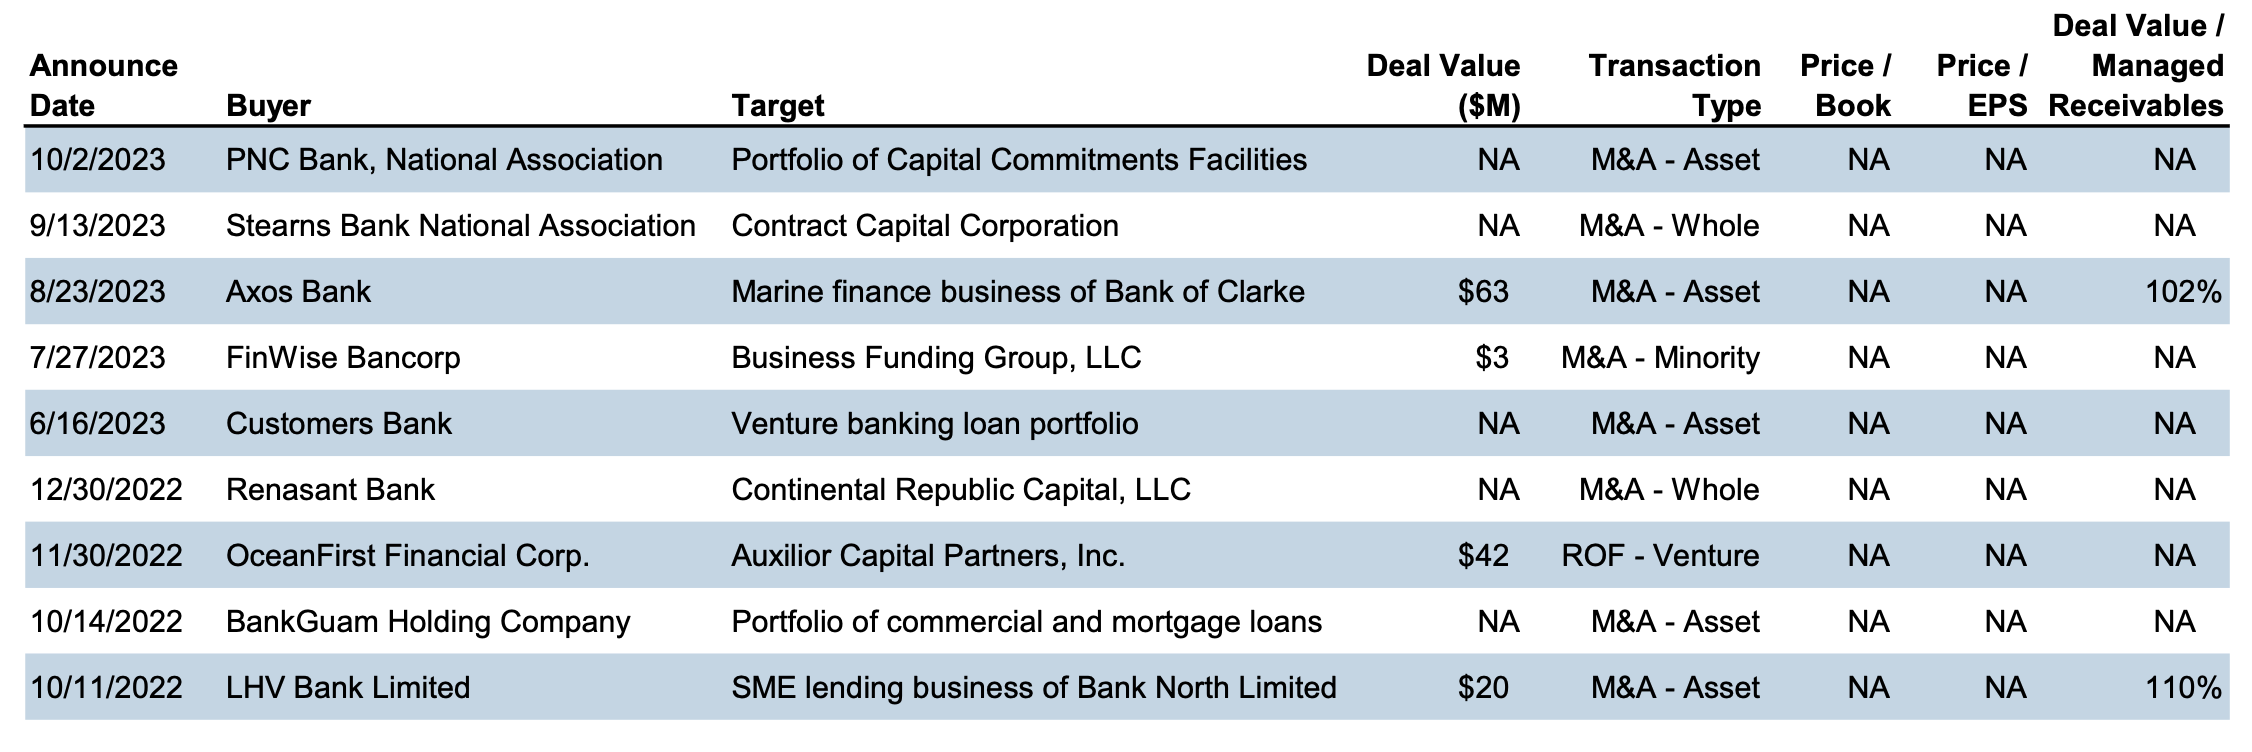
Click here to enlarge the table above
One of the more innovative transactions was a white label deal Synovus struck with Cincinnati-based Verdant Commercial Capital in July 2022 whereby Verdant will serve as the white label originator of equipment leases for Synovus Equipment Leasing. Synovus now offers equipment leasing of $25 thousand to $50 million to its clients through Verdant, which has expertise and execution capabilities that Synovus does not have. Synovus also provides lender finance to Verdant via a credit facility.
While the deal making environment is challenging, specialty finance acquisitions can be accretive to shareholders if structured and priced properly. Generally, the benefits we see are:
No acquisition comes without a unique set of risks. The following are some of the cons to a specialty finance acquisition:
Acquiring a specialty finance company comes with a unique set of hurdles, different than acquiring a bank. Cost synergies other than cost of funds usually are inconsequential. Buyers need to be aware of the target’s ownership structure and ensure that remaining managers (or key employees) upon close of the transaction are financially aligned with the bank’s goals.
While bank buyers should focus on the impact to capital, dilution to tangible BVPS and how quickly the dilution is recovered via EPS accretion, heavy consideration should be placed on the return on invested capital.
While the Street likes to focus on internal rate of return calculations in which much of the IRR is predicated upon a terminal value derived from a multiple of earnings, we think a simpler approach is how much money can the unit make compared to the capital outlay that encompasses all deal costs. If the return is sufficiently high, other metrics should be okay.
As for structuring a transaction, cash vs stock and how much consideration should be reserved for an earn-out are standard questions. The higher rate environment today makes each financing option more expensive in the form of shares that might be issued trade at modest multiples, while the cost of debt and opportunity cost of excess liquidity are high compared to several years ago.
Nonetheless, the more challenging operating environment for banks and non-bank lenders may lead to more attractive acquisition opportunities for banks with the capacity to engage in a transaction.
The last 6 to 18 months have been wrought with challenging economic and industry conditions. For many U.S. wholesalers (particularly ABI houses), a regression to lower pre-COVID sales volumes coupled with unprecedented brand disruption have contributed to a softening of sales and profitability. The narrative appears to vary more by brewery affiliation and territory than ever before.
According to the Brewers Association, U.S. beer sales volume continues its downward path with a decline of 3.1% in 2022. In 2022, the standard drink was more likely delivered in a cocktail glass rather than a beer mug – a consumer first, even if only slightly so. And an imported Mexican lager (Constellation’s Modelo Especial) now sits on the top shelf of U.S. beer sales replacing AB InBev’s Bud Light. Softening the decline from recent years’ performance has been consumers’ willingness to spend on premium labels and growing NA and RTD category products as well as higher pricing. But will a potential impending economic downcycle reverse some of this premiumization and put a stall on recent pricing patterns?
Wholesalers seeking a strategic exit may be facing tighter market valuations. But the downside in previously robust transaction trends may represent a silver lining for wholesalers needing to achieve overdue ownership succession and favorable estate planning objectives.
Mercer Capital’s experience in the industry prompts us to alert our clients and friends in the beer distribution space to several marketplace realities that are currently exerting downward pressure on the fair market value of many distributorships.
Our message to readers – take advantage of current market conditions to enhance the outcome of your ownership succession and estate planning strategies.
We discuss several considerations and developments that are currently influencing valuations in the industry. Note that only an experienced valuation practitioner in the space understands how these trends and expectations are properly quantified in a valuation.
Some of us are happy to see the yield on certain of our investment holdings improve in this environment of elevated interest rates. But, if you are paying these rates on your past capital expenditures and acquisitions, the current rates are painful.
Higher interest rates increase the cost of capital used in business valuations. The higher the cost of capital, the lower the value of the business.
Other things held constant in the business valuation equation, the increase in interest rates beginning in early 2022 suppressed equity valuations by 20%-30% in many industries and the effects continue to burden valuations in 2023.
Of course, there are exceptions, particularly for certain wholesalers who have benefited from the current market share upheaval and higher product pricing. Fair market value and strategic value remain potentially quite different for many wholesalers. Regardless, no one is immune to the value suppressing force of higher interest rates.
As suppliers adjust their prices, wholesalers reprice to the retail tier. The dynamics for many in recent years resulted in higher pricing growth than volume growth. For many wholesalers, catch-up pricing in 2022 offset volume declines, which has netted to relatively modest growth in overall sales in the recent period.
Price-motivated growth eventually succumbs to the laws of gravity. Beer and other consumer discretionary products are competing against higher prices for consumer essentials (housing, food, and fuel) potentially leaving less purchasing power for product premiumization and leisure consumption in general.
Apparently, “joe six-pack” became “johnny cocktail” in 2022. Twenty years ago, preference for beer among alcohol drinkers was almost twice what it is now. Spirit-based RTDs aren’t helping matters as consumer choice expands and competing suppliers leverage their brands to siphon off tradition beer drinkers.
Beer wholesalers are expected to continue augmenting their portfolios with various non-alcoholic products. Margins for these products typically fall short of the beer portfolio. Additionally, these suppliers are not subject to the same regulatory oversight as alcoholic beverage suppliers, making such volumes risker to the wholesaler and less valuable in the marketplace.
We have seen many wholesalers invest heavily to grow a product and then suffer the loss of a supplier due to upstream consolidation or realignment.
If 10%-30% of your volume is worth half as many turns of gross as your legacy beer portfolio, that can have a material effect on your whole-house valuation. These dynamics fall on top of the increased warehouse shelf and isle space called for in an ever-increasing world of SKUs.
The benefits of high density in population and account proximity are reduced when drinkers spread throughout or exit your territory and volumes are delivered at the fringe of your territory versus the geographic core of your market.
The distance each CE moves to find its retail home has a bearing on your two most labor-intensive activities (selling and delivery).
A 1% change in the margin structure of your business can easily represent 10%-15% of your total business value.
The alcoholic beverage distribution industry has many specific concerns. But the pains of the industry are compounded by the same fears and challenges facing all business owners.
Operating costs for labor, roughly 50% of total operating expenses in the middle tier, haven risen dramatically in recent years. Finding qualified staff remains a challenge amidst strong labor markets and low unemployment.
Macroeconomic fears of an impending downturn in the economy in 2024 remain as weak housing markets and inverted yield curves are generally leading indicators of recession. These industry and macroeconomic factors may be further complicated by realities on the ground in your territory.
We all know of the prevalence of rules of thumb based on supplier gross profit. Confusion reigns as it always has regarding the translation of supplier multiples based on brand growth, territory population, and logistical efficiency.
Rules of thumb are dangerous and typically do not apply across the differing scenarios under which a valuation may be developed. A standalone going concern premise under fair market value can be quite different than a valuation resulting from an actual business combination where territories are combined, and overhead expenses are rationalized.
Having qualified the issues with rules of thumb – what influence do high interest rates currently have on gross profit multiples?
Taking into consideration the complications of inflation and interest rates, portfolio valuations are potentially down 15%-20%, and potentially down further for market share losers suffering from the current AB InBev calamity and flat to modestly down for houses that gained share from ABI. Actual M&A results can vary based on the unique motivations of specific buyers and sellers. What deals do happen in the currently weakened borrowing environment are likely the result of special circumstances and unique motivations.
For those wholesalers contemplating succession, now is the time to act.
Under current conditions, wholesalers with depressed market share and/or increasingly diverse NA portfolios could see a material reduction in their valuations. In addition, wholesalers who have persevered through recent years to emerge stronger are still subject to the realities of high interest rates so it’s wise not to delay.
And for those distributors who might see value increases, higher interest rates and the eventual new norms of post-pandemic market patterns are still likely to influence your valuation.
Regardless of your succession strategy, a common requirement in the succession process is obtaining a business valuation. Many business appraisers can lay claim to having valued a beer distributorship at one time or another. But few have performed scores (I’m losing count at 30 years of advisory practice) of valuations for scores of alcoholic beverage distributors in over 20 states.
If you are interested in understanding how Mercer Capital’s beverage industry expertise can help you achieve a viable plan of succession, please call or email to discuss your situation.
This is the second of a two-part series where we focus on navigating business valuation complexities in litigation. Part 1 discussed strategies for multi-entity and multi-location businesses and can be found here.
In litigation, it is not uncommon for multiple valuation dates to be involved due to various events that cause the need for valuations. These different valuation dates present unique considerations. The need for multiple valuation dates can be triggered by a number of different reasons. Some states require date of valuation at separation or filing, while others require a current valuation as close to trial as possible. Multiple valuation dates may also be necessary in matters where the business began prior to marriage to assist in pre-marital or separate divisible value, as well as appreciation in value of the business during the course of the marriage and/or after separation through the current date. Some strategies when dealing with multiple valuation dates include:
When faced with an opposing expert report, it is necessary to assess the methodology, assumptions, and conclusions presented.
Navigating business valuation complexities in litigation involving multiple valuation dates and opposing expert reports can be challenging. However, these challenges can be overcome through the strategies presented above. The ability to adeptly address complexities within multiple valuation dates and opposing expert reports are essential in the resolution of complex business disputes.
Additional resources to help you navigate through additional business valuation complexities in litigation are listed below.
This short presentation is intended to discuss the concept of corporate solvency, solvency opinions and provide perspective on what issues a solvency opinion might address regarding the October 27, 2022, acquisition of Twitter, Inc. (“Twitter”) by Elon Musk’s X Holding I, Inc. (“XHI”). Since then, the entities have been renamed X Holdings Corp., which in turn wholly owns X Corp. that operates “X” previously known as Twitter.
In addition, the presentation makes observations about the financial performance of Twitter and the financing structure employed by XHI.
One of BankWatch’s favorite blues artists is Junior Kimbrough. In “Done Got Old,” Junior sings:
Well, I done got old
Well, I done got old
I cain’t do the thangs I used to do1
You could say the same about this interest rate environment. Earlier in 2023, markets were expecting Fed rate cuts by late 2023; alas, this expectation missed the mark. Now though, as a higher-for-longer rate environment descends on the industry, perhaps banks cain’t do the thangs they used to do in a lower rate environment.
We had the good fortune to speak at Bank Director’s Bank Board Training Forum in Nashville earlier in September. Our presentation, Valuation Issues Post-SVB, focused on issues emerging from a higher-for-longer environment. Right on cue, the Wall Street Journal published an article entitled, “Higher Interest Rates Not Just for Longer, but Maybe Forever” arguing that the “neutral” interest rate that balances inflation and unemployment has risen.2
This article covers some implications of a higher-for-longer rate environment included in our conference presentation:
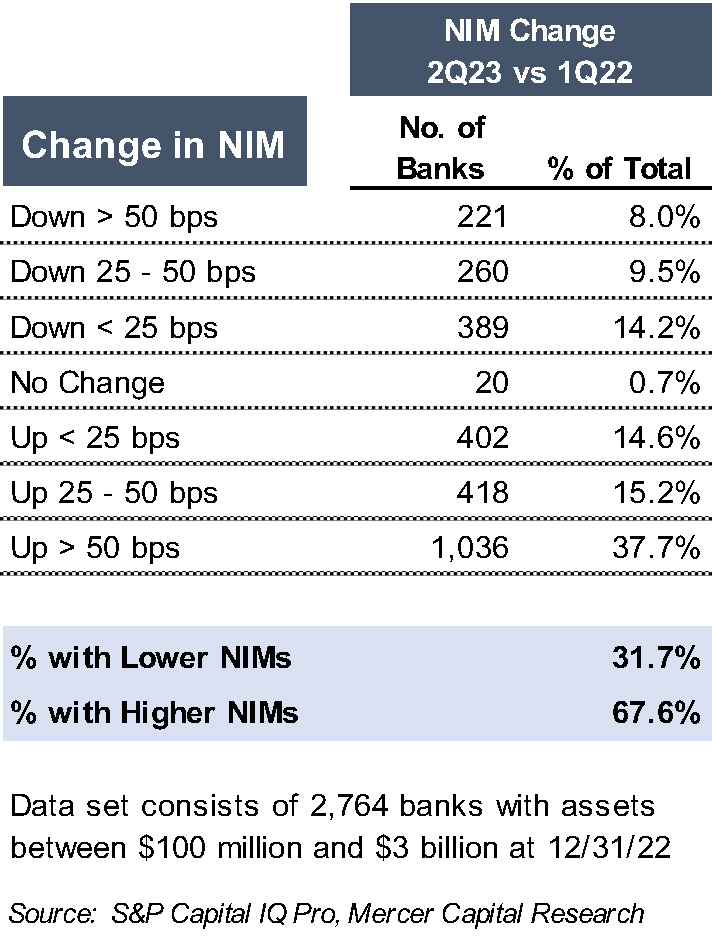
For many banks, a higher-for-longer rate environment is quite favorable, though sometimes media reports dwell on banks squeezed by rising rates. Figure 1 compares net interest margins between the first quarter of 2022 and the second quarter of 2023. We included the first quarter of 2022 as the impact of rising rates was minimal, PPP fee income had largely been recognized in prior quarters, and balance sheet composition reflected the changes that occurred during the pandemic. Our research indicates that 68% of the 2,764 banks included in the analysis reported a wider net interest margin in the second quarter of 2023. Many banks, in fact, face greater exposure to a long-term low rate environment than the current rate environment.
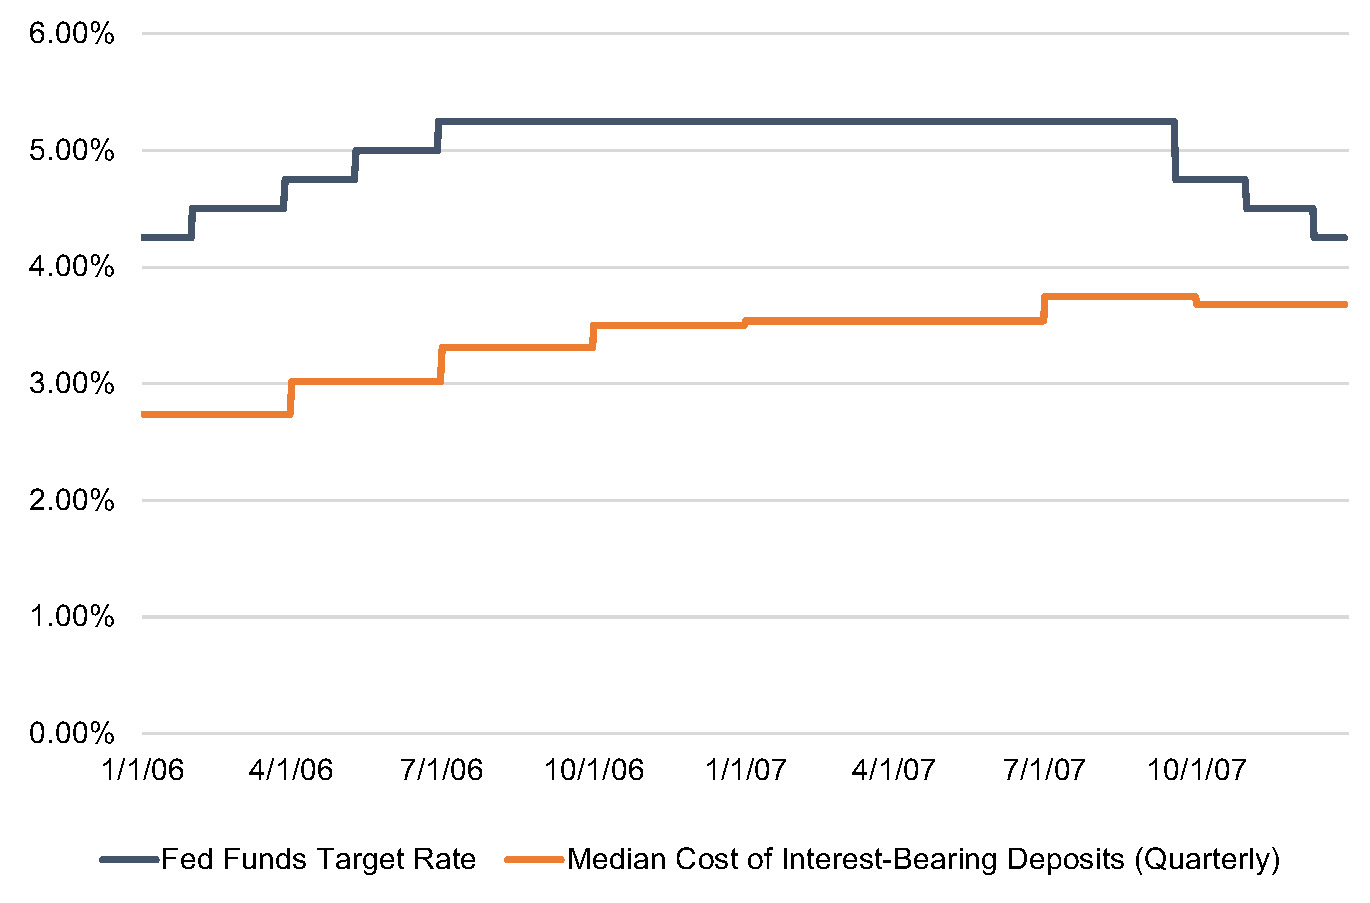
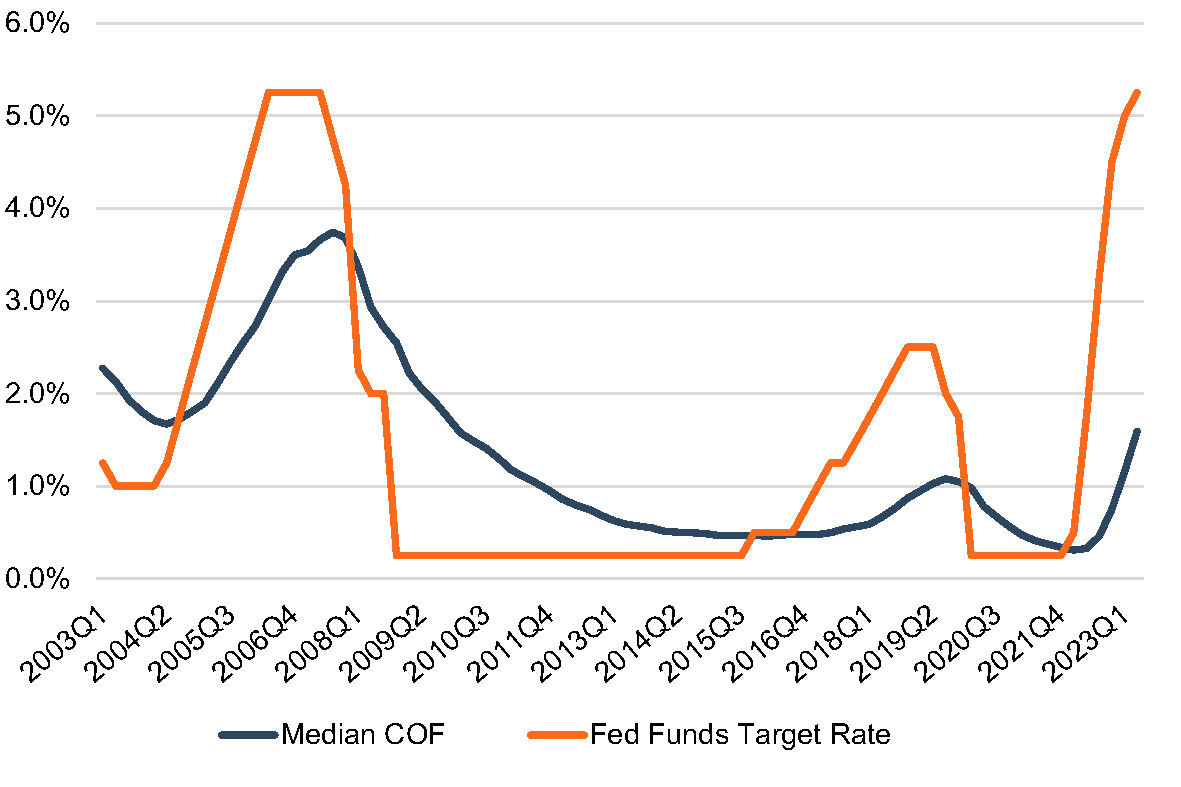
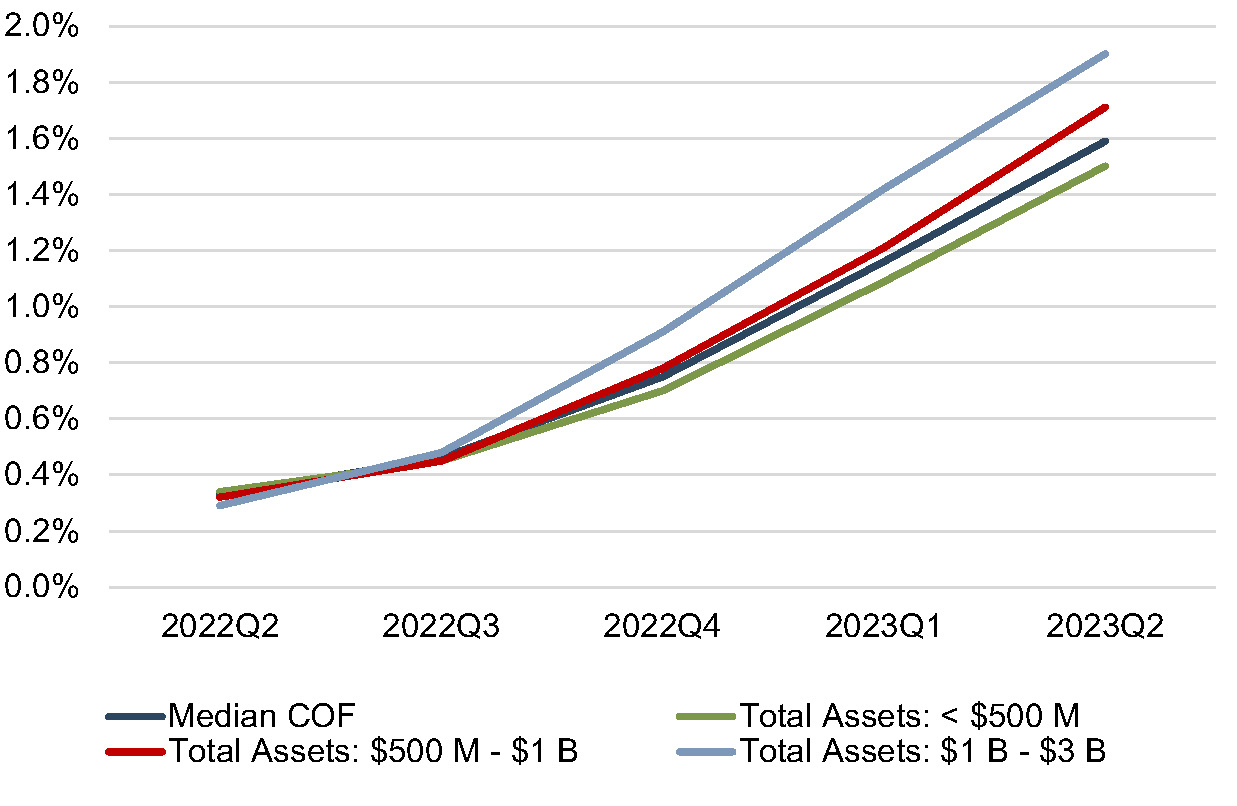
The most recent period in which the Fed Funds target rate exceeded 5% occurred from 2006 to 2007. As shown in Figure 2, the median cost of interest-bearing deposits for the same group of banks included in Figure 1 reached 3.75% in the third quarter of 2007. For the second quarter of 2023, however, this group’s cost of interest-bearing deposits was only 1.59% (see Figure 3).
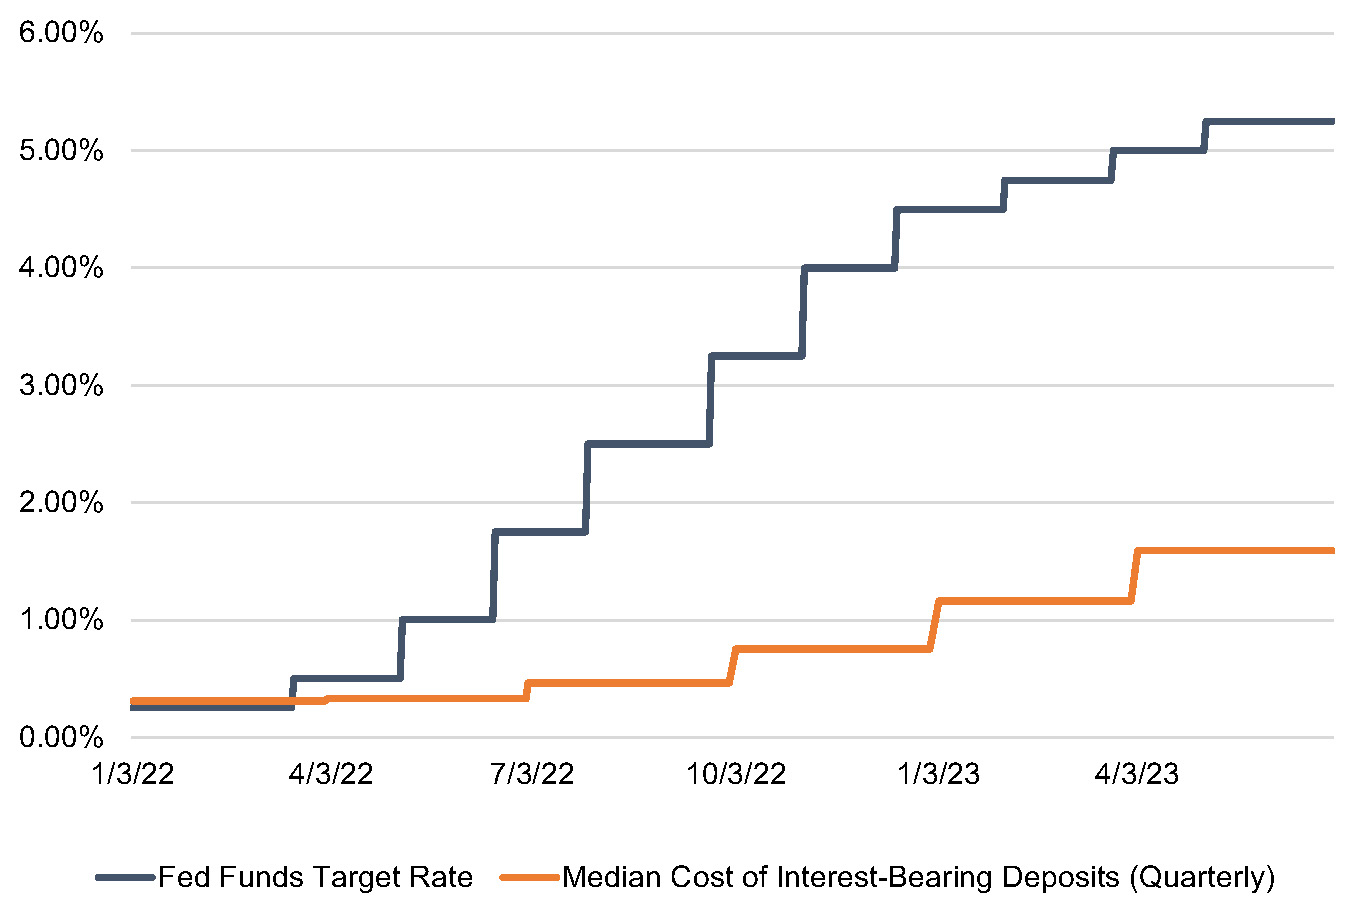
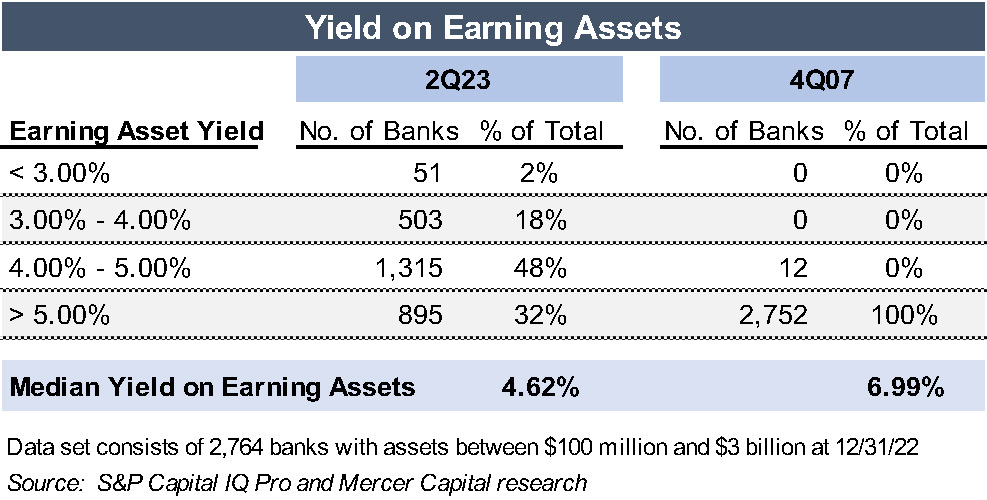
Deposit rates presumably will grind higher, and an extrapolation of recent deposit cost changes suggests that the median cost of interest-bearing deposits will reach 2.00% to 2.50% from 1.59% in the second quarter of 2023. Nevertheless, deposits cost for most banks likely will remain well below the level reported in 2006 and 2007. This is desirable for several reasons, but most importantly because earning asset yields are well below the level reported in 2006 and 2007. In the fourth quarter of 2007, the median yield on earning assets was 6.99%, which is 237 basis points higher than in the second quarter of 2023 (per Figure 4).
From an investment standpoint, current conditions somewhat mirror the late 1970s when most thrifts and some banks were caught with long(er) duration assets as funding costs rose. We believe the “asset duration issue” has weighed on bank stocks this year though institutional investors’ focus may now be shifting to credit risks.
During periods marked by low rates, banks’ strategic plans often were oriented around loan growth, especially during the pandemic when banks were flush with deposits. This strategic direction, in turn, often was implemented by hiring loan officers or entering new markets. In a higher-for-longer rate environment, do these strategies remain appropriate?
A loan-oriented growth strategy certainly remains defensible for those banks that still hold substantial liquidity at the Federal Reserve. For other banks, though, the question becomes more complex. To measure the profitability of loan growth, banks should use their marginal cost of funds, not their current average cost of funds. Hiring an investor commercial real estate lender may be difficult to justify when the marginal cost of funding is 5%, as every loan originated by the new lender may compress the net interest margin. Other financial or strategic motivations could support such loan growth strategies—like obtaining long-term customer relationships or locking in an attractive loan yield supported by prepayment penalties–but bank directors should be aware of the return on capital implications of more aggressive loan growth.
During a higher-for-longer rate environment, balance sheet growth will be governed mostly by a bank’s ability to obtain funding at a reasonable cost. And we know that building core deposits takes time. Given these constraints, bank directors should temper their expectations regarding balance sheet growth. Individuals possessing strong deposit customer relationships or access to specific deposit niches will become more valuable traits in new hires (or more subject to poaching by other banks).
If the return on capital from more aggressive loan growth strategies is diminished in a higher-for-longer rate environment, what should banks do with internally-generated capital?
If the bank’s stock is trading at 8x to 10x earnings, share repurchases seem attractive (subject to one’s outlook regarding the probability of credit deterioration).
A more controversial strategy would entail using some excess capital to effectuate a partial restructuring of the bond portfolio. Rather than tying up capital with loans earning a relatively low spread over marginal funding costs, a bank could exit some low yielding investments at a loss that could be replaced with investments at current market rates (or used to pay down costly borrowings).
Banks could analyze which strategy produces a better return on capital. We will explore this issue in a future article, but suffice to say as the spread over marginal funding costs for new loans declines, enhancing earnings by “investing” some capital in a bond portfolio restructuring looks financially more appealing.
Issuers of subordinated debt may wish to accumulate funds to repay these instruments when the current rate resets after five years, rather than face an interest rate hundreds of basis points higher than the current fixed rate.
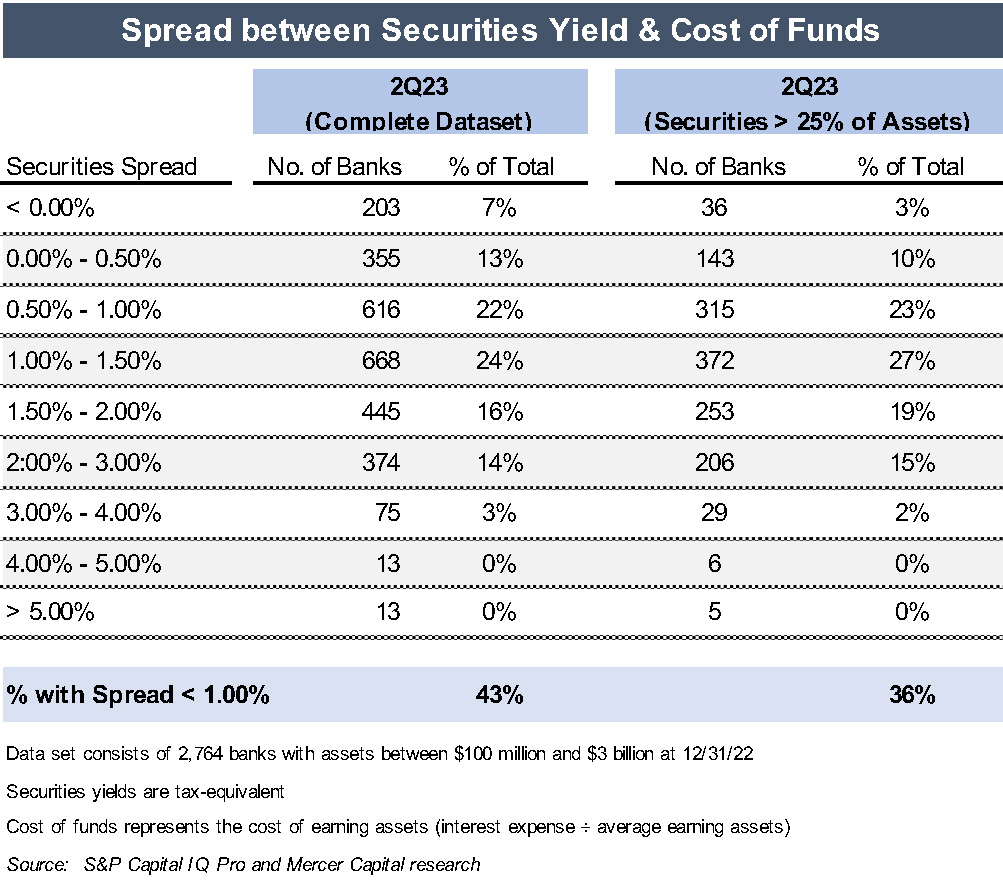
As rates linger at a higher level, more banks will experience a low or negative spread on their securities portfolios, which we measure as (a) the yield on securities minus (b) the cost of earning assets (interest expense divided by average earning assets). Figure 5 presents a stratification of banks’ securities spreads based on data for 2,764 banks with assets between $100 million and $3 billion.
The number of banks with low or negative securities portfolio spreads has steadily increased. The proportion of banks with spreads of less than 1% increased from 8% in the fourth quarter of 2019 to 36% in the fourth quarter of 2022 to 43% in the second quarter of 2023. Similarly, banks with negative spreads increased from 2% in the fourth quarter of 2019 to 3% in the fourth quarter of 2022 to 7% in the second quarter of 2023.
As hope diminishes that the unrealized securities losses will quickly reverse and the earnings drag from securities with low (or negative) spreads continues unabated, banks will face a reckoning. The currently unrealized losses will be recognized in one of two ways: immediately through sale of securities or over time through lower earnings. Choosing between those two options, whether consciously or not, becomes unavoidable in a higher-for-longer rate environment.
Credit quality has remained remarkedly strong, except for some sectors for which most community banks have limited exposure like lower credit score consumer lending and central business district office properties. Our research found that 61% of publicly traded banks with assets between $1 and $10 billion reported lower criticized loans (i.e., loans rated special mention or worse) at June 30, 2023 than at year-end 2022. Nevertheless, some issues may arise in a prolonged environment of higher rates:
Bank M&A activity improved in August 2023, although from a low base in prior months. Several factors likely prompted this, including more visibility into the extent of deposit attrition and the trend in deposit interest rates. Additionally, the balance sheet marks that are necessary to complete a transaction are becoming more accepted by both buyers and sellers.
Beyond credit, several other considerations exist for M&A transactions in a higher-for-longer rate environment:
A merger and the related conversion process often trigger customers to reassess long-term relationships. A buyer should assess the sensitivity of the deal valuation to deposit attrition that differs from the target’s historical norm. In low rate environments, an unexpected loss of deposits usually could be replaced by wholesale borrowings without materially affecting anticipated earnings. In a higher rate environment, though, this cushion does not exist. The unexpected attrition of low cost deposits could materially erode the target’s expected earnings contribution, given the current variance between core deposit and wholesale funding costs.
As indicated in Figure 1 at the beginning of this article, many banks continue to perform quite well in this rate environment despite occasional expressions of doom in some media reports. Hopefully, not too many banks will be singing the blues like Junior Kimbrough as this high rate environment persists.
Since Mercer Capital’s most recently published article on core deposit trends in September 2022, the banking industry has faced abysmal deal activity. The scarcity of transactions can largely be blamed on unfavorable deal math due to required balance sheet marks on underwater securities and loan portfolios. Compressed P/E ratios, credit quality concerns (especially for commercial real estate portfolios), regulatory headwinds, pressures on profitability, and uncertainty in the wake of several bank failures earlier in 2023, have also contributed to a quiet year from an M&A perspective. Although deal activity has been slow, we have seen an obvious uptick in core deposit intangible values relative to this time last year.
On July 26, 2023, the Federal Reserve increased the target federal funds rate by 25 basis points, capping off a collective increase of 100 basis points year-to-date and 525 basis points since March 2022. While many factors are pertinent to analyzing a deposit base, a significant driver of value is market interest rates.
Using data compiled by S&P Capital IQ Pro, we analyzed trends in core deposit intangible (CDI) assets recorded in whole bank acquisitions completed from 2000 through mid-August 2023. CDI values represent the value of the depository customer relationships obtained in a bank acquisition. CDI values are driven by many factors, including the “stickiness” of a customer base, the types of deposit accounts assumed, the level of noninterest income generated, and the cost of the acquired deposit base compared to alternative sources of funding. For our analysis of industry trends in CDI values, we relied on S&P Capital IQ Pro’s definition of core deposits.1
In analyzing core deposit intangible assets for individual acquisitions, however, a more detailed analysis of the deposit base would consider the relative stability of various account types. In general, CDI assets derive most of their value from lower-cost demand deposit accounts, while often significantly less (if not zero) value is ascribed to more rate-sensitive time deposits and public funds. Non-retail funding sources such as listing service or brokered deposits are excluded from core deposits when determining the value of a CDI.
Figure 2, summarizes the trend in CDI values since the start of the 2008 recession, compared with rates on 5-year FHLB advances. Over the post-recession period, CDI values have largely followed the general trend in interest rates—as alternative funding became more costly in 2017 and 2018, CDI values generally ticked up as well, relative to post-recession average levels. Throughout 2019, CDI values exhibited a declining trend in light of yield curve inversion and Fed cuts to the target federal funds rate during the back half of 2019. This trend accelerated in March 2020 when rates were effectively cut to zero.
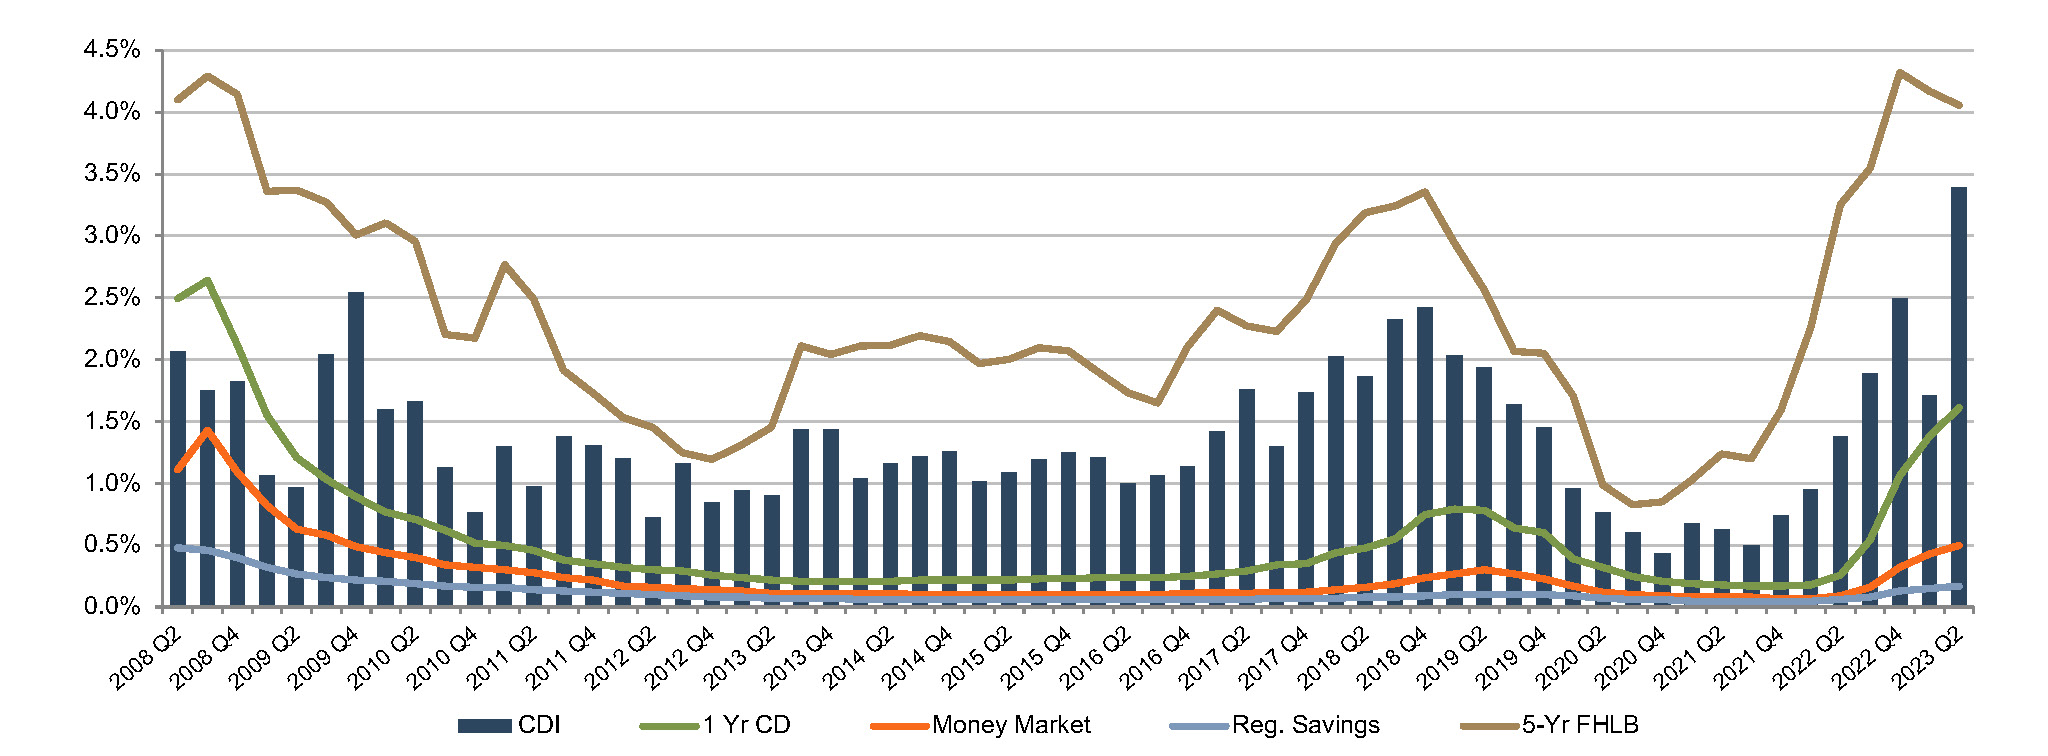
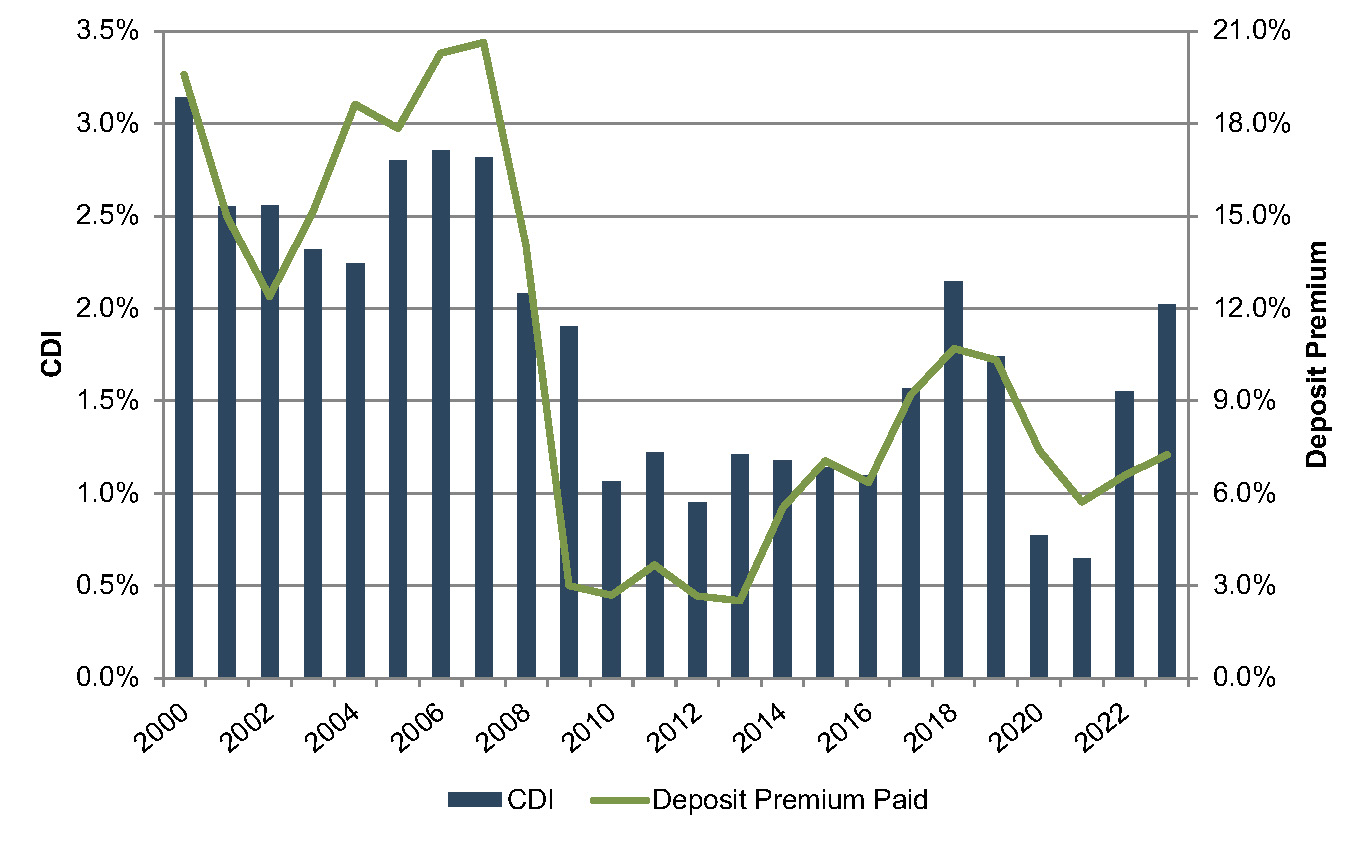
CDI values have increased meaningfully in the past few quarters (with an average CDI value of 171 and 339 basis points for the first and second quarters of 2023, respectively). This compares to 155 basis points for all of 2022 and 64 basis points for all of 2021. Recent values are above the post-recession average of 1.39%, and on par with longer-term historical levels which averaged closer to 2.5% to 3.0% in the early 2000’s.
As shown in Figure 2, reported CDI values have followed the general trend of the increase in FHLB rates. However, the averages from 2023 should be taken with a grain of salt. The chart is provided to illustrate the general directional trend in value as opposed to being predictive of specific indications of CDI value due to the following reasons:
Eleven deals were announced in July and the first half of August, and three of those deals provided either investor presentations or earnings calls containing CDI estimates. These CDI estimates ranged from 3.6% to 4.0%, which is in line with the numbers we have observed in our valuation analyses. We expect CDI values to continue rising in concert with market interest rates. However, market interest rates are not the only driver of CDI value, and there are some potentially mitigating factors to CDI values in the near term.
Core deposit intangible assets are related to, but not identical to, deposit premiums paid in acquisitions. While CDI assets are an intangible asset recorded in acquisitions to capture the value of the customer relationships the deposits represent, deposit premiums paid are a function of the purchase price of an acquisition. Deposit premiums in whole bank acquisitions are computed based on the excess of the purchase price over the target’s tangible book value, as a percentage of the core deposit base. While deposit premiums often capture the value to the acquirer of assuming the established funding source of the core deposit base (that is, the value of the deposit franchise), the purchase price also reflects factors unrelated to the deposit base, such as the quality of the acquired loan portfolio, unique synergy opportunities anticipated by the acquirer, etc. As shown in Figure 7, deposit premiums paid in whole bank acquisitions have shown more volatility than CDI values. Deposit premiums in the range of 6% to 10% remain well below the pre-Great Recession levels when premiums for whole bank acquisitions averaged closer to 20%.
Additional factors may influence the purchase price to an extent that the calculated deposit premium doesn’t necessarily bear a strong relationship to the value of the core deposit base to the acquirer. This influence is often less relevant in branch transactions where the deposit base is the primary driver of the transaction and the relationship between the purchase price and the deposit base is more direct. Figure 8 presents deposit premiums paid in whole bank acquisitions as compared to premiums paid in branch transactions.
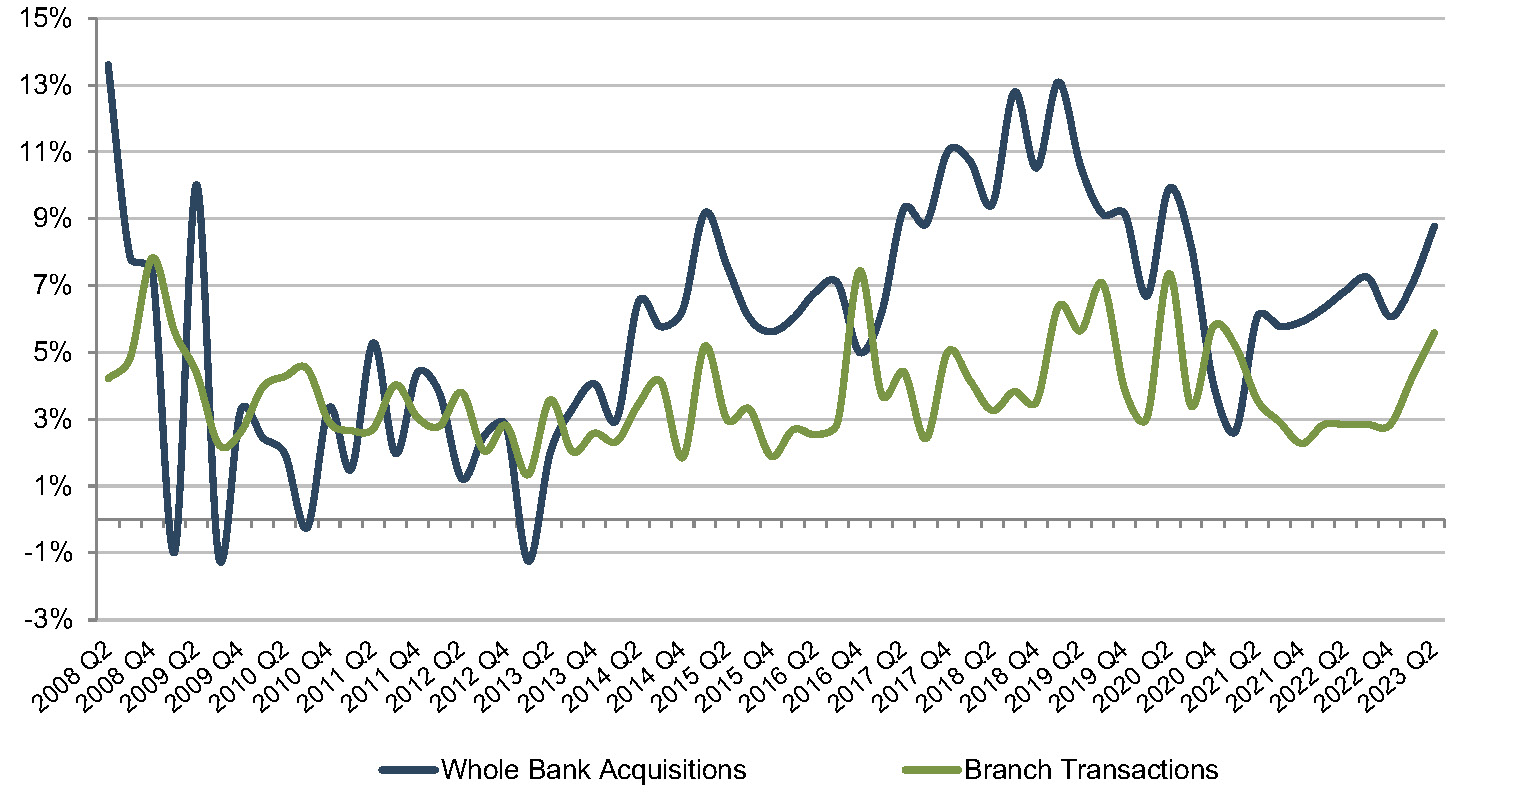
Deposit premiums paid in branch transactions have generally been less volatile than tangible book value premiums paid in whole bank acquisitions. Only four branch transactions with reported premium data have occurred year-to-date in 2023. For those transactions, the deposit premiums ranged from 2.0% to 6.0%. The lack of branch transactions, though, is indicative of their value. With high short-term funding costs and tight liquidity, few banks are willing to part with stable, low cost core deposits.
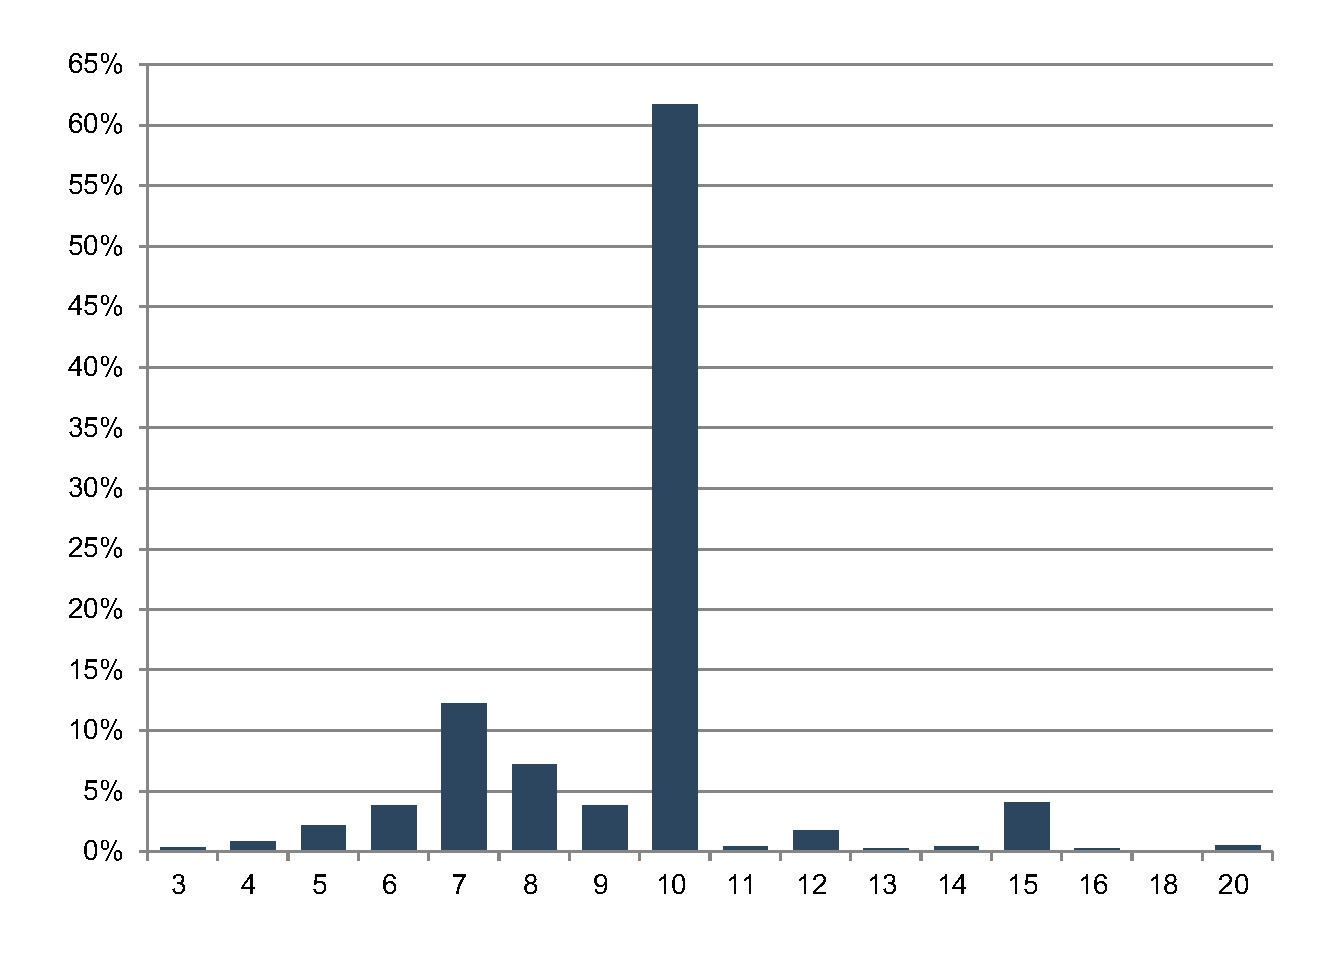
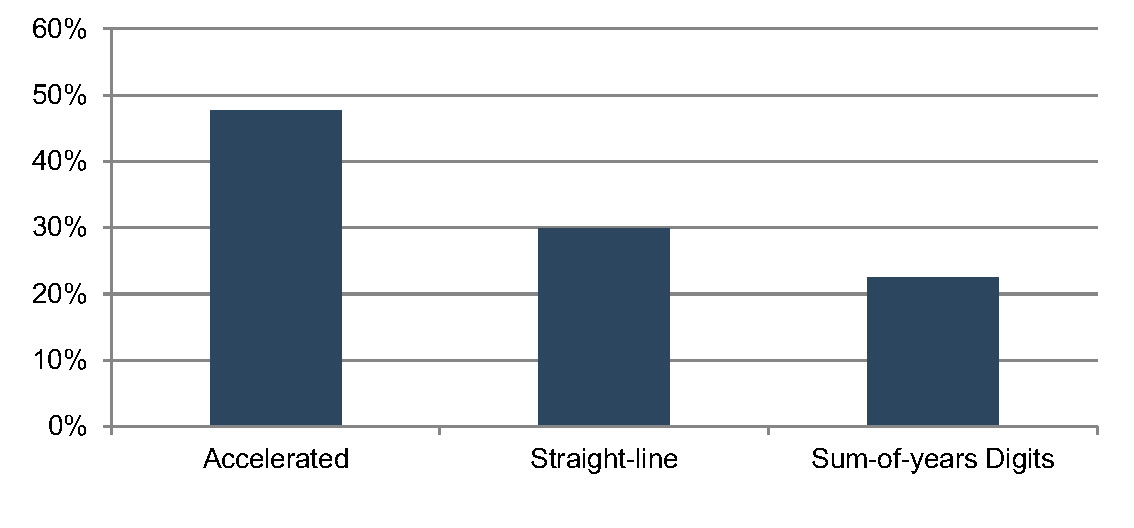
Based on the data for acquisitions for which core deposit intangible detail was reported, a majority of banks selected a ten-year amortization term for the CDI values booked. Less than 10% of transactions for which data was available selected amortization terms longer than ten years. Amortization methods were somewhat more varied, but an accelerated amortization method was selected in approximately half of these transactions.
For more information about Mercer Capital’s core deposit valuation services, please contact us.
In the sometimes contentious realm of divorce proceedings, the role of forensic services becomes increasingly vital. Last month’s article, “Valuation of a Business for Divorce: Overview of Valuation Approaches and Normalizing Adjustments,” shed light on the complexities of valuing a business, describing the three approaches: the asset-based approach, the income approach, and the market approach. The article also emphasized the importance of “normalizing adjustments” which act as a corrective lens, adjusting the income statement to portray the financial results from the ordinary operations of a business, as well as ongoing earnings capacity of the business.
Valuations of a closely held business in the context of a contentious divorce can be especially multifaceted and may require additional forensic investigative scrutiny for any irregularities in the financials in anticipation of the divorce and valuation. In valuations for divorce, certain adjustments may impact and/or require further forensic services such as income determination, tracing services, lifestyle analyses, marital vs. separate analyses, and more.
Examples of such adjustments may include, but are not limited to:
It is important to consider these types of situations if only one spouse is involved with the operations and management of the company, otherwise referred to as the “in-spouse.” That spouse may, or may not, have been altering the financial position of the business in anticipation of divorce and a potential independent business valuation. The services of a financial expert can be vital to you and your client in such matters, as the accuracy of the valuation may impact the equitable distribution of the marital assets.
Check out these additional resources:
Determining the value of financial assets in a divorce case can often be the most complicated aspect of the case.
The value of certain assets, such as a retirement account or a bank account, can be determined by a brokerage or bank statement/balance as close to the date of trial or settlement as possible.
An asset such as a closely held business may be the most valuable asset in the marital estate and can require a business appraiser to determine its fair market value since no market indication of value is generally available (unlike a publicly traded company).
The valuation date is also important. In addition to the value of the business or business interest (%) at the current date, other indications of value, such as the value at the date of marriage, may also be required. This varies depending on the facts and circumstances of ownership as well as state statutes.
Net asset division in divorce proceedings are further complicated because they are governed by laws that differ by state. The majority of states are referred to as Equitable Division (“ED”) states as opposed to Community Property states. In ED states, courts determine the equitable or fair distribution of the marital assets based on the characteristics of each case. Further, a majority of ED states are referred to as Dual Property ED states, meaning that assets are categorized as either marital or separate.
While definitions vary by state, some states define marital assets as those acquired or earned during the marriage. Those states then define separate assets as those consisting of property owned by a spouse prior to marriage or property received by gift or inheritance that has not been commingled or transmuted during the marriage. Generally, marital assets are subject to division in a divorce proceeding whereas separate assets, as the name implies, are held separately and not factored into the equitable division of marital assets.
Can a separate asset ever become a marital asset? Yes. In many states, the increase in value of a separate asset during the course of the marriage can potentially be considered a marital asset. Using the example of a closely held business, the increase in value, or appreciation, is often measured by the fair market value of that asset at the date of marriage and some other date as defined by the individual state law or statutes. Other measurement dates are the date of trial, date of separation, or date of filing, among others. In an article published in Family Lawyer magazine, we discussed the importance of the valuation date and its impact on the value of a closely held business.
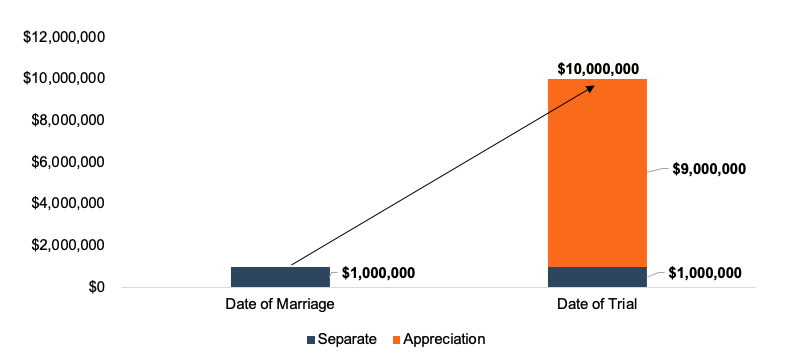
Consider a simple example of a closely held business that one spouse owned at the time of marriage. Let’s assume that the fair market value of the business at the date of marriage is $1 million and the fair market value of the business at the date of trial is $10 million. The simple calculation of the appreciation, or increase in value, is $9 million. Is the entire difference of $9 million considered marital property in this example? The answer may be “it depends,” because it may not be that simple depending on the state or jurisdiction of the case.
In many states, the entire portion of appreciation is not treated as marital property, though, valuation experts must confirm state statute and precedent with the attorneys.
Many states make the distinction between “active” and “passive” appreciation. Active appreciation refers to the increase in value, due to the active, direct and indirect, efforts of one or both spouses. Passive appreciation refers to the increase in value, due to external factors such as market forces, or efforts of other individuals other than the spouses in the divorce.
Depending on the state, courts may then classify active appreciation as marital property, while passive appreciation generally remains separate property.
Active and passive appreciation can also be illustrated by looking at certain assets, such as retirement accounts or real estate. Assuming no contributions during the marriage, the growth in value of a retirement account as a result of the increase in the market values of the underlying investments since the date of marriage would be an example of passive appreciation. The rise in value of a piece of real estate or property due to general market conditions and absent any additional investment, improvement, or management of that real estate during the marriage would also constitute passive appreciation.
Appreciation in retirement accounts and real estate can be simply illustrated and defined through reasonable methodologies. Determining active and passive appreciation in the value of a closely held business can be much more complex. The assumptions used in the overall valuation of the business requires the business appraiser to use qualitative and quantitative analyses. Active appreciation can be supported through direct efforts of one or both spouses such as financial investment in the business, ownership and labor hours contributed to the business, management, marketing strategy, etc. Passive appreciation can consist of economic or market conditions and/or the efforts of non-divorcing individuals.
Market forces refer to the economic or market conditions that affect the price, demand, or value of an asset. Market forces happen naturally and are outside of the control or direct efforts of the owners of the company or spouses involved in a divorce. For a closely held business, market forces that can affect value include changes in interest rates, discount/capitalization rates, tax rates, pricing of products or billing rates, legislation that causes an increase in demand for a company’s products or services, etc. Value appreciation attributable to market forces would generally be classified as passive appreciation and as a result, would not be included in the marital estate in those states that recognize active/passive appreciation as marital/separate.
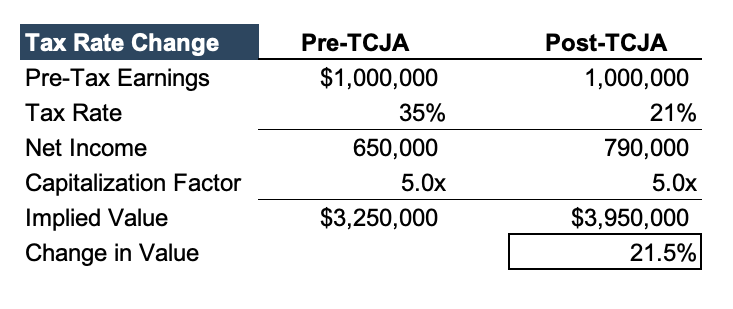
Consider a simple example of a company before and after the tax rate changes brought on by the 2017 Tax Cuts and Jobs Act (“TCJA”). Let’s assume the Company has $1 million in earnings, and the capitalization factor to determine value is 5x. Let’s also assume the tax rate changed from 35% to 21% after TCJA with no state income tax. In this example, all else being equal and not changed, the change in tax rate caused a 21.5% increase in value of the company.
Efforts from individuals other than the spouses could be another area where passive appreciation is present. Business appraisers can perform analyses of these third-party efforts through several techniques. When considering ownership, the following questions are addressed. What is the overall ownership of the company? Is the divorcing spouse the only owner or is he/she one of several owners? The presence of other owners could indicate efforts of other individuals. Management of the Company is also a consideration. Who are the key members of management and how are decisions made? Is the company controlled by a board of directors, and if so, how many individuals serve on the board? In terms of the the role of the spouse, appraisers can analyze these roles and the roles of other key individuals and determine what impact those duties have on the company’s strategy and performance overall. Finally, business appraisers can perform an analysis of the revenue contribution of each owner or key member of management to the overall revenue of the company. Does the company have multiple locations? If so, is the divorcing spouse active and participating at all locations?
Balance sheet factors can also impact the overall value of a company. The presence of excess cash or non-operating assets can add to the value determined under an income or capitalization method (used in the tax rate example above). The Company may have experienced an increase in these items from the date of marriage to the current date of measurement. From our experience, it is not uncommon to see companies in certain industries with more cash on the balance sheet in the last two years as a result of remaining funds obtained from PPP loans or elevated profits. Non-operating assets can consist of real estate not used in the core operations of the business or an investment account. We discussed both of these assets earlier and illustrated how their values can increase due to passive appreciation factors.
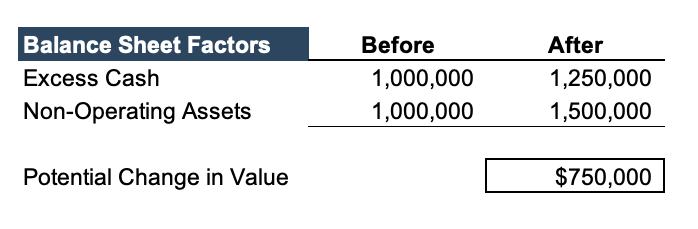
Consider a company with the following changes to its balance sheet: excess cash increased by $250,000 and non-operating assets increased by $500,000. In this example, the change in potential value to the company could be $750,000 and may be characterized as passive appreciation depending on the specific factors. While these are assets and liabilities of the business, they may be categorized as “non-core” assets that have different considerations for separate or marital appreciation from those of the core business operations.
Once the appraiser identifies and quantifies the areas of passive appreciation, the remaining appreciation, or increase in value, is concluded to be active appreciation. The conclusion of passive appreciation could be in dollars of value or percentage of overall value.
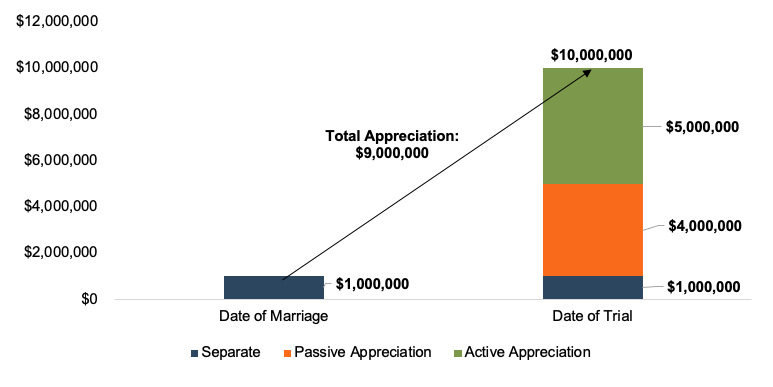
Let’s revisit our original example involving a company worth $1 million at date of marriage and $10 million at the date of trial. If the appraiser had determined passive appreciation to be $4 million, then the resulting active appreciation would be $5 million as seen below:
Determining the value and classification of financial assets can be challenging during a divorce proceeding. As we have discussed, the classification of an asset can also change from the date of marriage to the current date of measurement (trial, separation, filing, etc.) and depending on state statute and precedent. Many states make the distinction between active and passive appreciation, only considering the active appreciation to be a marital asset.
The value of a couple’s closely held business could be the most valuable asset in the marital estate. If the business was owned prior to marriage, the identification and quantification of any appreciation as active or passive could be critical to the overall marital value placed on that asset.
A detailed valuation analysis of the appreciation will be needed in addition to the valuation of the business at each measurement date. A qualified business appraiser can perform both tasks, including examining the specific factors that contribute to the overall value of the business. It’s important for the appraiser to understand the applicable state laws of the jurisdiction in question and to discuss those with the attorney.
Bank stocks have underperformed in the broad market since the beginning of the year and many currently trade below book value, which begs the question, is goodwill impaired? We discussed this topic most recently in June 2020 as banking stocks (along with the broad market) were pressured in 1Q20 based on fears from the COVID-19 pandemic. However, the market recovered quickly in 2H20 and set new highs in 2021 as interest rates were at historical lows, many banks benefitted from PPP and mortgage banking income, and immense liquidity flooded into the economy via government stimulus.
What once was the solution for the economy in 2020 now is a contributor to headaches for bankers in 2023. A combination of the influx in liquidity to the economy (and banking system) via government stimulus, supply disruptions from COVID and geopolitical events, and pent-up demand from reopenings led to higher inflation in 2021 and 1H22. The Federal Reserve attempted to cool inflation with an increase in short-term policy rates, from a range of 0.00-0.25% in March 2020 to 5.25-5.50% as of July 2023. However, the rise in interest rates led to unrealized losses on bond portfolios and pressure on deposit retention and funding costs.
Public bank stocks performed well when compared to the broader markets in 2022. The median stock price change of the 343 banks and thrifts traded on the NYSE and NASDAQ, was negative 9% in 2022, compared to negative 19% for the S&P 500 and negative 33% for the NASDAQ. However, banking stocks diverged from the broad market in 2023 with declines during the Spring of 2023 (March and April) as concerns about higher cost of funds, unrealized bond losses, and the collapse of three high profile banks (SVB, FRC, and SBNY) arose. Banking stocks generally bottomed during early to mid-May before recovering a portion of the decline more recently.
However, of the nearly 300 banking stocks we analyzed that trade on the NYSE and NASDAQ, approximately half continue to trade below book value as of July 25, 2023. Deal activity also slowed in 2H22 and year-to-date 2023 due to a combination of factors including fair value marks on bonds and loans, widening buyer and seller expectations, and pressures on profitability and public bank stocks. For perspective, there have been 43 whole bank acquisitions announced in the year-to-date period ended July 26, 2023. This compared to 86 deals in the same period in 2022 and 103 transactions in 2021.
Against this backdrop, the remainder of this article will discuss two common questions that arise for companies considering an impairment test.1
Goodwill impairment testing is typically performed annually, usually near the end of a Company’s fiscal year. In fact, many companies may have completed an impairment test as of year-end 2022. However, the factors noted above may raise questions about whether an interim goodwill impairment test is warranted for many banks.
The accounting guidance in ASC 350 prescribes that interim goodwill impairment tests may be necessary in the case of certain “triggering” events. For public companies, perhaps the most easily observable triggering event is a decline in stock price, but other factors may constitute a triggering event. Further, these factors apply to both public and private companies, even those private companies that have previously elected to amortize goodwill under ASU 2017-04.
For interim goodwill impairment tests, ASC 350 notes that entities should assess relevant events and circumstances that might make it more likely than not that an impairment condition exists. The guidance provides several examples, several of which are relevant for the bank industry including the following:
The guidance notes that an entity should also consider positive and mitigating events and circumstances that may affect its conclusion. If a recent impairment test has been performed, the headroom between the recent fair value measurement and carrying amount could also be a factor to consider.
Once an entity determines that an interim impairment test is appropriate, a quantitative “Step 1” impairment test is required. Under Step 1, the entity must measure the fair value of the relevant reporting units (or the entire company if the business is defined as a single reporting unit). The fair value of a reporting unit refers to “the price that would be received to sell the unit as a whole in an orderly transaction between market participants at the measurement date.”
For companies that have already adopted ASU 2017-04, the legacy “Step 2” analysis has been eliminated, and the impairment charge is calculated as simply the difference between fair value and carrying amount.
ASC 820 provides a framework for measuring fair value which recognizes the three traditional valuation approaches: the income approach, the market approach, and the cost approach. As with most valuation assignments, judgment is required to determine which approach or approaches are most appropriate given the facts and circumstances. In our experience, the income and market approaches are most commonly used in goodwill impairment testing. However, the market approach may be limited in the current environment given the lower amount of transaction activity in 2023. In the current environment, we offer the following thoughts on some areas that are likely to draw additional scrutiny from auditors and regulators.
Are the financial projections used in a discounted cash flow analysis reflective of recent market conditions? What are the model’s sensitivities to changes in key inputs
At Mercer Capital, we have experience in implementing both the qualitative and quantitative aspects of interim goodwill impairment testing. To discuss the implications and timing of triggering events, please contact a professional in Mercer Capital’s Financial Institutions Group.
1A portion of the following text was excerpted from an article from my colleague Lucas Parris entitled “Goodwill Impairment Testing in Uncertain Times” https://mercercapital.com/article/goodwill-impairment-testing-in-uncertain-times/
Valuation of a business can be a complex process requiring accredited business valuation professionals. Valuations of a closely held business in the context of a divorce are typically multifaceted. Business valuations are a vital element of the marital dissolution process as the value of a business, or interests in a business, impact the marital balance sheet and the subsequent allocation/distribution of marital assets. In this article, we introduce the three valuation approaches and discuss the importance of normalizing adjustments to the subject company’s income statement.
At the beginning of any valuation, the financial expert will request certain information and interview management of the Company. Information requested typically includes:
The financial expert must assess the reliability of the documentation and decide if the documents appear thorough and accurate to ultimately rely on them for his/her analysis. The three approaches to value a business are the Asset-Based Approach, the Income Approach, and the Market Approach.
The asset-based approach is a general way of determining a value indication of a business, business ownership interest, or security using one or more methods based on the value of the assets net of liabilities. Asset-based valuation methods include those methods that seek to write up (or down) or otherwise adjust the various tangible and intangible assets of an enterprise.
For more on the asset-based approach, click here.
The income approach is a general way of determining a value indication of a business, business ownership interest, security or intangible asset using one or more methods that convert anticipated economic benefits into a present single amount.
The income approach can be applied in several different ways. Valuation methods under the income approach include those methods that provide for the direct capitalization of earnings estimates, as well as valuation methods calling for the forecasting of future benefits (earnings or cash flows) and then discounting those benefits to the present at an appropriate discount rate. The income approach allows for the consideration of characteristics specific to the subject business, such as its level of risk and its growth prospects relative to the market.
For more on the income approach, click here.
The market approach is a general way of determining a value indication of a business, business ownership interest, security or intangible asset by using one or more methods that compare the subject to similar businesses, business ownership interests, securities or intangible assets that have been sold.
Market methods include a variety of methods that compare the subject with transactions involving similar investments, including publicly traded guideline companies and sales involving controlling interests in public or private guideline companies. Consideration of prior transactions in interests of a valuation subject is also a method under the market approach.
For more on the market approach, click here.
A proper valuation will factor, to varying degrees, the indications of value developed utilizing the three approaches outlined. A valuation, however, is much more than the calculations that result in the final answer. It is the underlying analysis of a business and its unique characteristics that provide relevance and credibility to these calculations.
Normalizing adjustments adjust the income statement of a private company to show the financial results from normal operations of the business and reveal a “public equivalent” income stream. In creating a public equivalent for a private company, the marketable minority level of value (sometimes referred to as the “as if freely traded,” level of value) emphasizes that earnings are being normalized to where they would be as if the company were public, hence supporting the need to carefully consider and apply, when necessary, normalizing adjustments. (For further information on the Levels of Value, see “What is a ‘Level’ of Value, and Why Does It Matter?”).
There are two categories of adjustments.
These adjustments eliminate one-time gains or losses, unusual items, non-recurring business elements, expenses of non-operating assets, and the like. Examples include, but are not limited to:
These adjustments relate to discretionary expenses paid to or on behalf of owners of private businesses. Examples include the normalization of owner/officer compensation to comparable market rates, as well as elimination of certain discretionary expenses, such as expenses for non-business purpose items (lavish automobiles, boats, planes, etc.) that would not exist in a publicly traded company.
For more, refer to our article “The Importance of Normalizing Financial Statements for a Business Valuation.”
If the business or an interest was recently bought or sold, if it was recently appraised, or if its value is in a financial statement or a loan application, that information may go a long way in establishing the value of the business (if both parties feel that this value is a fair representation). However, since a business valuation report and expert witness are admissible in court as evidence and since the value of a business or interest impacts the marital balance sheet and the subsequent asset distribution, it may be exceedingly beneficial to hire a professional for evidentiary support.
The late Richard Russell, editor of Dow Theory Letters for 57 years, famously remarked that “markets make opinions.” One does not have to know much about markets to acknowledge that there is much truth in that statement. Trends tend to be extrapolated.
Taken at face value, investors should be biased and bullish today. The S&P 500, as of June 23, 2023, has risen 13% year-to-date after declining 19% in 2022. The NASDAQ is up 29% after falling 33% in 2022. However, ten or so mega-cap companies have driven the turnaround in these two market-cap-weighted indices. Shares of Nvidia, Alphabet and Tesla have more than doubled, while a 44% increase in Apple’s shares has pushed its market cap to $2.9 trillion.
On the other hand, the equal weighted S&P 500 (RSP), S&P 400 Mid Cap and Russell 2000 indices have each risen less than 5% after declining 15% to 20% in 2022. Most stocks are well below the highs that were posted in 2021.
Given the depressed market for many and sharply higher borrowing costs, it is not surprising that M&A activity has been subdued since the third quarter of 2022. Markets and M&A activity may not turnaround later this year, but some level of M&A activity will continue.
The role of the financial advisor becomes tougher when markets are depressed. Questions of value and fair dealing may be subjected to more scrutiny. Declining or depressed markets in the context of negotiating and opining on a transaction will raise the reasonable question: How do current market conditions impact fairness?
There is no short answer; however, the advisor’s role of reviewing the process, valuation, facts, and circumstances of the transaction in a declining or depressed market should provide the board with confidence about its decision and the merits of the opinion.
Some of the issues that may weigh on the decision process and the rendering of a fairness opinion in a depressed market include the following:
Process vs. Timing. Process can be a tricky consideration in any transaction (see our review of the Tesla-Solar City shareholder litigation here). A review of fair dealing procedures, when markets have fallen sharply, will raise additional process and valuation considerations. The analysis should be sensitive to actions that may favor one party and disadvantages shareholders (e.g., a buyback of a significant shareholder’s interest when prices were higher). Even an auction of a company may be subject to second guessing if the auction occurred in a weak environment.
Corporate Forecasts. A management forecast covering three-to-five years is a staple of any valuation analysis and board deliberations regarding a significant corporate transaction. Consideration should be given to the context of when the forecast was prepared and how different economic environments affect the subject company. A reasonable question to consider is whether depressed equity markets and widening high-yield spreads merit a below trend baseline forecast or vice versa. There is no correct answer, only perspective and alternatives to the baseline forecast to consider.
Valuation. Valuation should be viewed through multiple lenses, including absolute, relative to comps, and relative to the subject’s historical and prospective performance. Depressed markets add further nuance. Are markets temporarily depressed or resetting to a new normal that will require valuations to reset to a lower level? Does consideration consist of a fixed amount of cash, or does it entail the issuance of a fixed number of buyer shares that may (or may not) be temporarily depressed?
Exchange Ratios. Since the GFC, most acquisitions structured as stock swaps entail a fixed exchange ratio because buyers need certainty about the number of shares issued. Theoretically, declining markets do not change the calculus for buyers and sellers subject to a fixed exchange ratio to the extent the buyer’s shares have declined in line with the market; however, declining markets cause sellers to focus more intently on “price” rather than pro rata ownership and pro forma financial metrics. The more challenging analysis is when the buyer’s shares have materially underperformed a declining industry index that is not remedied through a provision in the merger agreement that provides for an upward adjustment to the exchange ratio.
Buyer’s Shares. Regardless of market conditions, fairness analyses should consider the investment attributes and merits of the buyer’s shares based on financial performance, share performance, and valuation relative to peers. Declining or depressed markets make this calculus harder, especially when the buyer’s shares have underperformed peers and/or are materially valued above peers because the shares have not fallen as much. If so, the outcome raises the issue of more downside potential even though fairness opinions and supporting analyses do not forecast future share performance.
Financing. If the consummation of a transaction depends upon the buyer raising cash via selling shares or issuing debt, a sharp drop in the market may limit financing availability. If so, the board and the financial advisor will want to ensure the buyer has backup financing from a bank. No matter how remote, the absence of backstop funding is an out-of-no-where potential that a board and an advisor should consider. Down markets make the highly unlikely possible if capital market conditions deteriorate unabated. While markets periodically become unhinged, a board entering into an agreement without a backstop plan may open itself to ill-informed deal-making if events go awry.
Summing it Up. Tomorrow is always uncertain. Fairness opinions do not offer opinions about where a security will trade in the future. Instead the opinion addresses fairness from a financial point of view to all or a subset of shareholders as of a specific date. The evaluation process is trickier when markets fall sharply, but it is not unmanageable. We at Mercer Capital have extensive experience valuing and evaluating the shares (and debt) of companies engaged in transactions during bull, bear, and sideways markets garnered from over three decades of business.
Business owners and their professional advisors are occasionally perplexed by the fact that their shares can have more than one value. This multiplicity of values is not a conjuring trick on the part of business valuation experts, but simply reflects the economic fact that different markets, different investors, and different expectations necessarily lead to different values.
Business valuation experts use the term “level of value” to refer to these differing perspectives. As shown in Exhibit 1, there are three basic “levels” of value for a business.
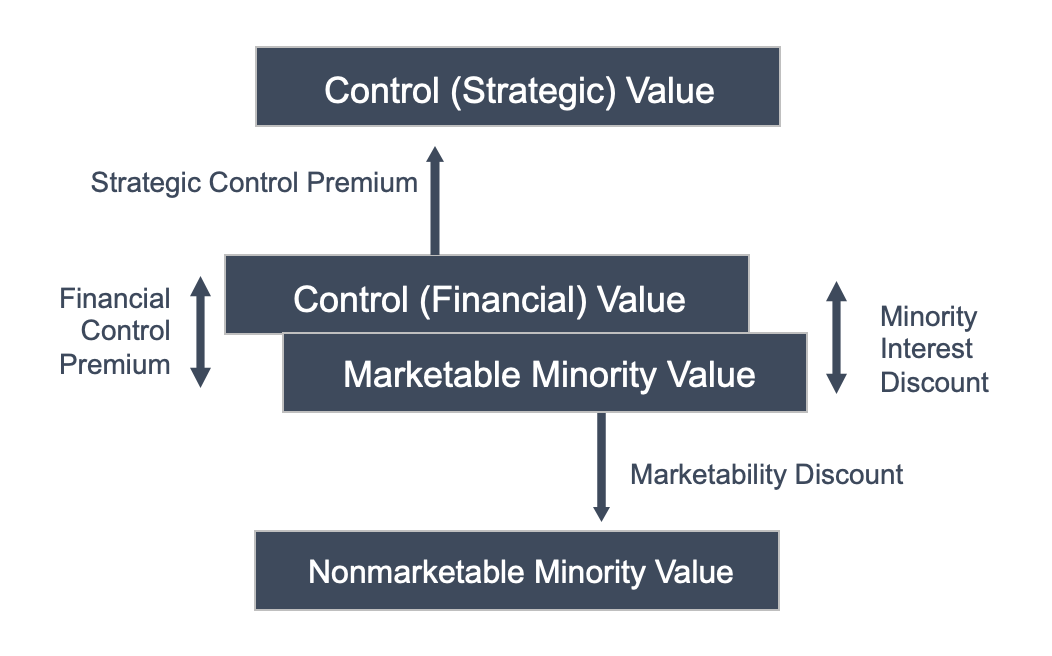
Each of the basic levels of value corresponds to different perspectives on the value of the business. In this article, we explore the relevant characteristics of each level.
The marketable minority value is a proxy for the value of a business if its shares were it publicly traded. In other words, if your business had a stock ticker, what price would the shares trade at? To answer this question, we need to think about expectations for future cash flows and risk.
So, when a business appraiser estimates the value of a business at the marketable minority level of value, they are focused on expected future cash flows and risk. They will estimate this value in two different ways.
While these are two distinct approaches, at the heart of each is an emphasis of the cash flow-generating ability and risk of the business.
We started with the marketable minority level of value because it is the traditional starting point for analyzing the other levels of value.
In contrast to public investors who buy small minority interests in companies, acquirers buy entire companies (or at least a large enough stake to exert control). Acquirers are often classified as either financial or strategic.
The ability to reap cost savings or achieve revenue synergies by combining your family business with their existing operations means that strategic acquirers may be willing to pay a premium to the marketable minority value. Of course, selling the business to a strategic acquirer means that the business effectively ceases to exist. The name and branding may change, employees may be downsized, and production facilities may be closed.
While strategic acquirers may be willing to pay a premium, the buyer of a minority interest in a business that is not publicly traded will generally demand a discount to the marketable minority value. All else equal, investors prefer to have liquidity; when there is no ready market for an asset, the value is lower than it would be if an active market existed.
What factors are investors at the nonmarketable minority level of value most interested in? First, they care about the same factors as marketable minority investors: the cash-flow generating ability and risk profile of the business. But nonmarketable investors have an additional set of concerns that influence the size of the discount from the marketable minority value.
The so-called “levels” of value reflect the real-world concerns of different investors in different circumstances. It is important for family law attorneys and their clients to understand the levels of value. When business appraisers are called upon to value a business in a divorce engagement, they will reference the levels of value. The more family law attorneys understand basic valuation concepts, the better guidance you can provide to your clients.
The valuation of portfolio companies usually is a straight forward process; however, it is more challenging in the current bear market following a period of wide-open monetary spigots that drove rich valuations for venture-backed firms. Capital raises were outwardly easy to complete as were richly valued exits via an IPO or M&A. For traditional PE-backed companies, low-cost debt financing was readily available, too, which often supported an extra turn or two of EBITDA for acquisitions and sometimes dividend recaps.
Now the hangover is in full swing.
The valuation process is intended to determine the fair value of an asset as of the valuation date. Stated differently, it is the market clearing price, not a price target based upon an investment thesis. The accounting profession provides more formality via ASC 820 as “the price that would be received to sell an asset or paid to transfer a liability in an orderly transaction between market participants at the measurement date.”
Current depressed market conditions make it difficult to utilize the recent bull market capital raise data without a fundamental adjustment for market conditions as well as differences between the subject and the comp data. The same applies to M&A and IPO pricing, too. What was is no more.
Depending upon the subject company, the Guideline Public Market Company Method (i.e., public comps) may be a suitable method to develop an indication of value, though often venture-backed companies may be too early in their life cycle to compare to public comps. But virtually all valuations will consider the Discounted Cash Flow Method (“DCF”).
The DCF Method has three primary components: a) projected unlevered free cash flows that accrue to capital providers, b) a terminal value and c) weighted average cost of capital (“WACC”) to discount the cash flows and terminal value to present values, the sum of which represents the enterprise value of the firm.
Most venture-backed firms and sometimes PE-owned companies can be described as long duration equities in which the value of the firm is in the out years rather than near-term cash flows as is the case for mature businesses with high profit margins. Like any model, terminal values have their sensitivities including and especially growth.
The terminal value represents the present value of all cash flows as of the end of the discrete forecast period. In our experience, the courts—especially in Delaware—and private equity analysts tend to favor an income approach to deriving a terminal value rather than a market approach based upon public company comps and/or M&A comps. An income approach to deriving the terminal value will rely upon the capitalization of earnings or free cash flow in which the multiple reflects a “build-up” of the components of capital costs less a long-term growth rate. Such an approach to deriving the terminal value excludes market data other than some of the capital cost components. Viewed from this perspective, the DCF method is a “pure” income approach to valuation as is the single-period (earnings or cash flow) capitalization method.
On the other hand, market participants tend to favor market multiples applied to one or more of the projected performance measures at the end of the forecast period to derive the terminal value. The courts may not favor this approach as a mixing of income- and market-based approaches, but viewing exit multiples in the context of market observations is not illogical.
It is important to note that a market-derived multiple used to determine a terminal value has an implicit growth expectation. All else equal, the higher the market multiple the higher the growth rate expectation. Stated differently, one should be judicious in selecting a market-based terminal value multiple. High growth rates tend to normalize in time with once high multiples compressing toward industry averages. Market multiples observed over the past several years may overstate future growth just as today’s “low” multiples could understate future growth.
Figure 1 compares a market-based approach to determining a terminal value with a build-up approach. The illustration is intended to emphasize the delta that may exist presently between a market-based approach and a build-up. Firms that are projected to be marginally cash flow positive by the terminal year, all else equal, likely will not produce a substantial DCF value unless elevated market multiples are used to derive the terminal value. With the passing of the ultra-easy money era, that probably does not make sense unless the market observations were derived since interest rates returned to a “normal” level by late 2022.
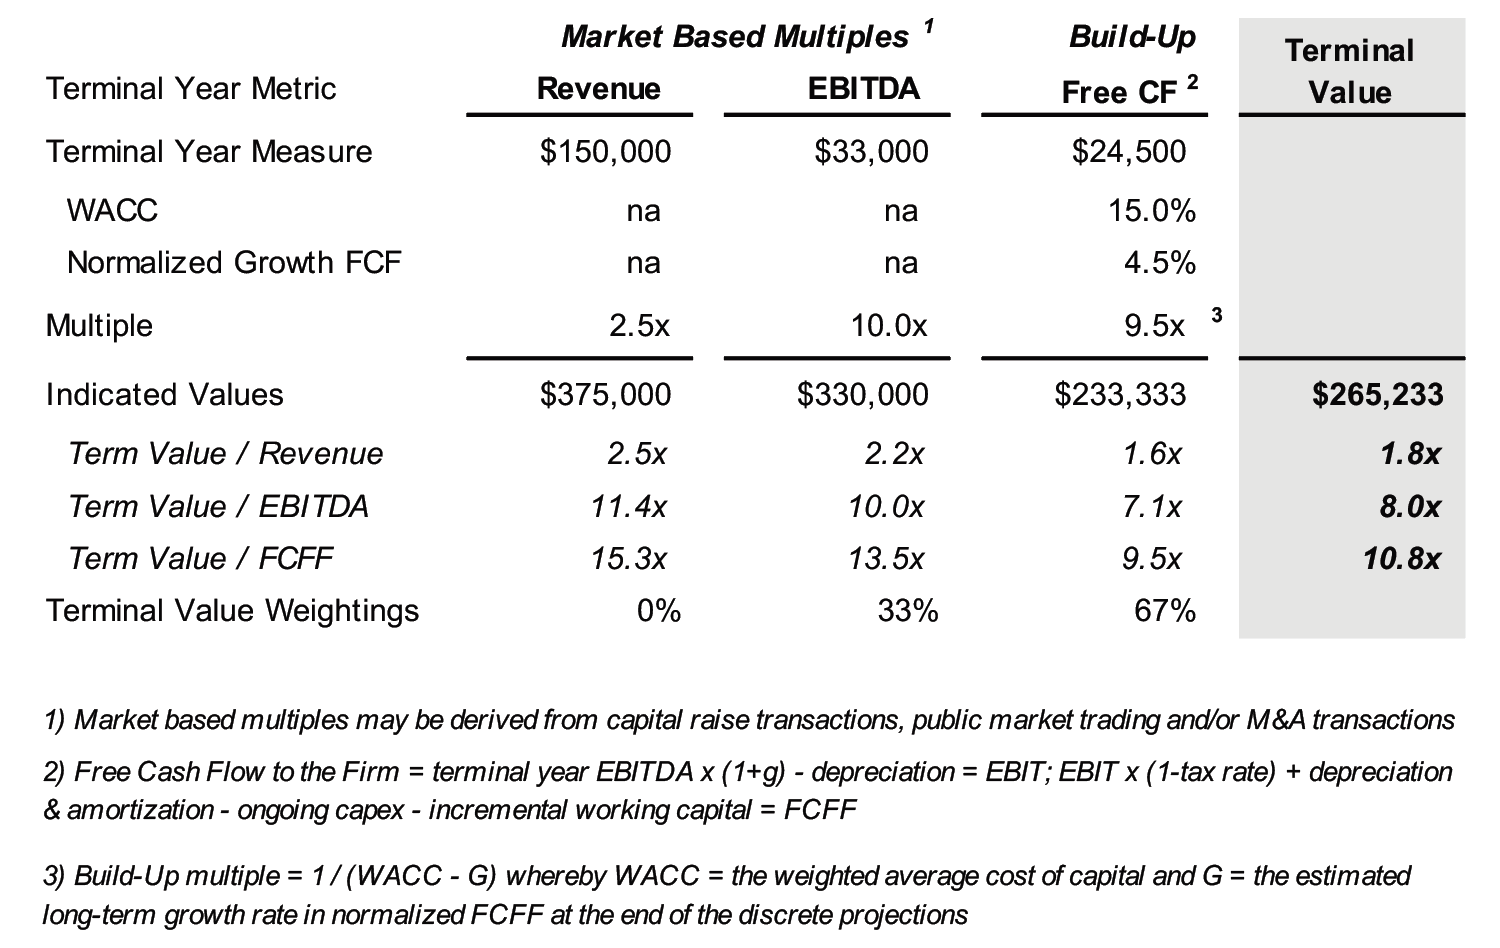
An alternative to solely weighting the build-up multiple would be to weight both market-based and build-up multiples. That may make sense to bridge an evolving market, though if a court were to review the analysis it likely would solely weight the build-up multiple consistent with Delaware case law.
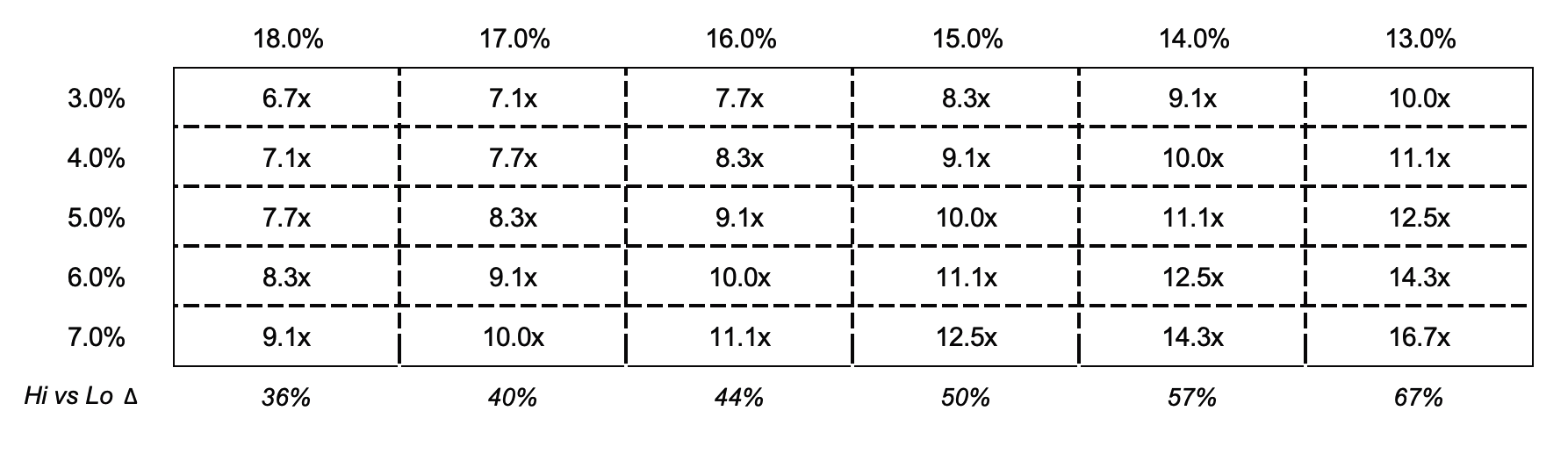
Another point to consider in calculating terminal values is relative valuation – does the terminal value as a multiple of earnings, revenues and whatever other metrics are relevant to the subject company’s industry make sense? The resulting multiple may make sense, but one also has to question the terminal year earnings measure. If management projections reflect a “to the moon” trajectory, then the WACC probably should too.
Terminal values are sensitive to the assumptions, especially the growth rate of the terminal year earnings measure that is capitalized as shown in Figure 2 as it relates to a build-up method used in the single period capitalization method. The current outlook for lower economic growth and higher rates/cost of capital implies DCF values all else equal have (or will) decline.
Mercer Capital is an independent valuation and transaction advisory firm that was founded in 1982. We provide valuation, fairness and solvency opinions for a broad range of clients, including private equity and private credit funds. Please call if we can assist in establishing the fair value of your private equity and credit investments, or alternatively provide assurance opinions.
We are sometimes asked to value common equity securities where the target (usually our client) has agreed to be acquired but the transaction has not yet closed. The valuation could be required for a number of reasons: annual year-end ESOP/KSOP valuation, tax compliance matters, and litigation.
The valuation of such shares falls into the genre of “merger arbitrage” which on Wall Street is an “event-driven” asset strategy. Merger arbitrage strategies seek to capture a risk-adjusted return for the risk assumed that the transaction will not close. As time passes, discounts tend to narrow as the closing date approaches absent detrimental developments.
The S&P Merger Arbitrage Index produced total returns on an unlevered basis between 2018 and 2022 that ranged between 6.1% in 2021 and -4.2% in 2022. The five-year compound annual return was 3.2% or 1.9% over the average 90-day T-bill yield.
Given the uncertainty that an announced transaction will close for a variety of reasons (e.g., regulatory, shareholder actions, financing, etc.), acquisition targets that are publicly traded will usually trade at a discount to the acquisition price. In instances when a competing offer is expected, the target’s shares may trade at a premium, though this is unusual given the vetting process most boards undertake.
The valuation of privately held shares in a merger arb situation can be reduced to a binomial outcome: the deal closes, or it does not. The two outcomes may be close in value or they may be far apart, especially if minority and illiquidity discounts are to be considered in the no-deal scenario. Factors that may impact the discount between the target’s market price and the deal price include:
Our observation of bank stocks over several decades leads us to the conclusion that bank merger arbitrage discounts are modest in the order of high single digits to 10% or so on an annualized basis. However, it is important to note that fact patterns for individual transactions can cause discounts to be wider. Stated more succinctly: most announced bank deals close.
The ability to close is a key consideration for any board entertaining an acquisition or merger proposal. In our February edition of Transaction News Update, we opined that Spirit Airlines Inc. (NYSE: SAVE) may not have sufficiently considered whether JetBlue Airways Corp. (NYSE: JBLU) could obtain regulatory approval to acquire Spirit when it agreed to the JetBlue offer over a deal with Frontier Group Holdings, Inc.
While small bank deals almost always close, large deals take longer and are subject to more scrutiny since the Biden Administration took office in early 2021. Among three large deals that were announced in 2021 and early 2022, only two of the three closed: $125 billion asset MUFG Union Bank by U.S. Bancorp (NYSE: USB) on December 1, 2022, and $92 billion asset Bank of the West by Bank of Montreal (TSE/NYSE: BMO) on January 17, 2023.
On May 4, 2023, The Toronto-Dominion Bank (TSE/NYSE: TD) and First Horizon Corporation (NYSE: FHN) announced the termination of a definitive agreement that was signed on February 28, 2022 after TD could not provide assurance to FHN when or even if it could obtain regulatory approval to acquire. Subsequent press reports indicated that TD had compliance issues related to anti-money laundering reporting that precluded regulatory approval.
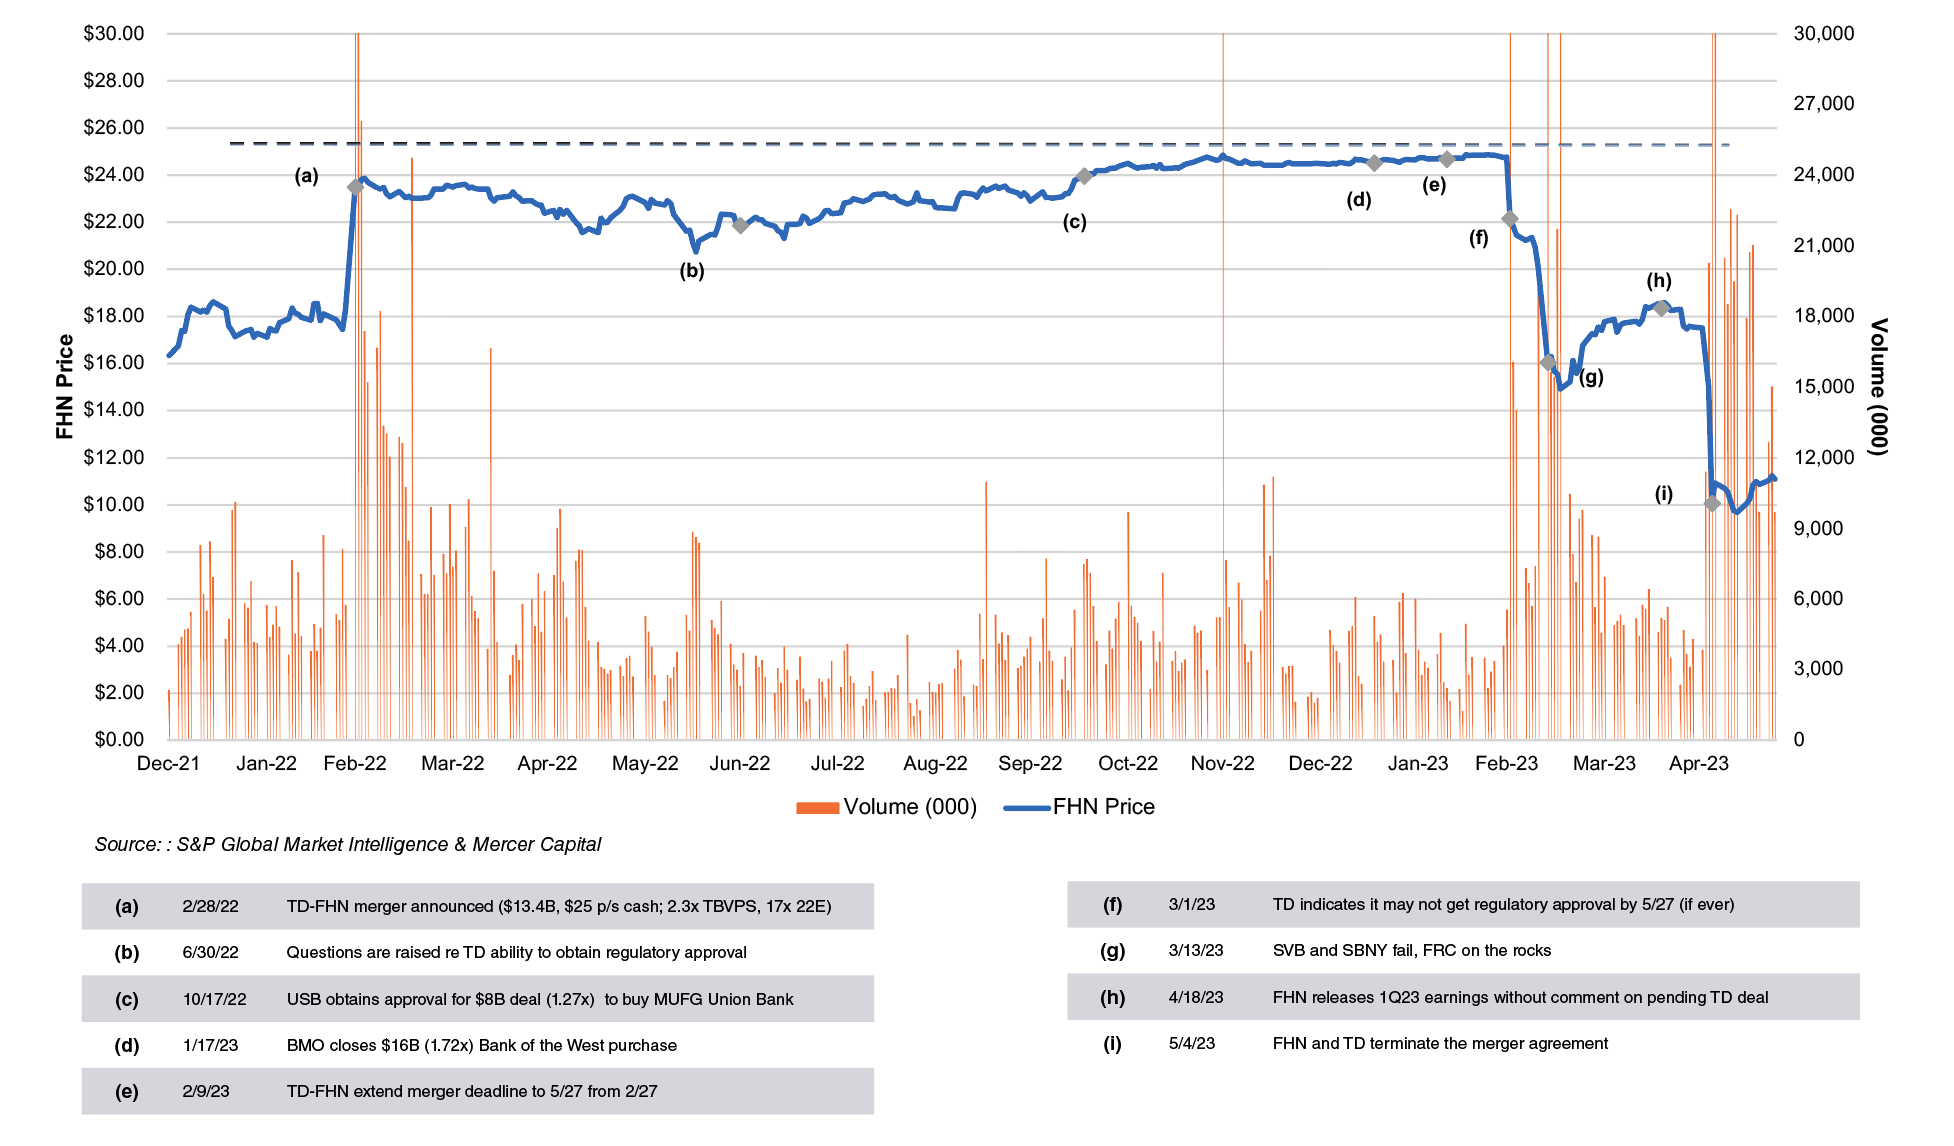
Figures 1, 2 and 3 provide perspectives on merger arb discounts and how discounts can change as facts, circumstances and market conditions change based upon the TD-FHN deal.
Click here to expand the image above
The merger agreement signed on February 28, 2022 provided for TD to acquire all of FHN’s common shares for $13.4 billion of cash, or $25.00 per share. Pricing at announcement equated to 2.27x year-end 2021 tangible BVPS and 16.6x the 2022 consensus EPS estimate.
If there was any concern about TD’s ability to get regulatory approval, market participants did not express it because FHN’s shares rose 29% on February 28, 2022, to $23.48 per share from $18.25 per share the day before as shown in Figure 1 (on page 4). The discount to the cash (out) price by the close on the 28th was 6.5%, a level that is consistent with the modest discount we have observed for most bank deals over the years.
Then a series of events would cause the discount to widen, narrow, then blow-out before the termination was announced.
During the summer of 2022, the discount widened as more voices began to question the ability of TD to obtain regulatory approval against the backdrop of USB and BMO facing uncertain approval for their large bank deals, too. However, FHN’s shares trended at the nearly $25 per share cash-out price by November as USB and BMO obtained regulatory approval to close.
On February 9, 2023 the parties extended the termination date to May 27, 2023, from February 28 when it was clear that regulatory approval would not be forthcoming by the one-year anniversary. As shown in Figure 1, FHN’s price dropped 11% on March 1 when it disclosed in its 10-K that TD did not know when it would obtain regulatory approval. The shares then dropped about 20% on March 13 as investors digested the implications of the failures of Silicon Valley Bank (SVB) and Signature Bank New York (SBNY).
When FHN released 1Q23 earnings on April 19 without any updated written commentary about the then pending TD deal (FHN discontinued quarterly conference calls once the deal was announced), the shares did not move much given the then 26% discount to the $25 per share cash price. However, the shares fell to about $10 per share with the announcement that the parties terminated the deal on May 4.
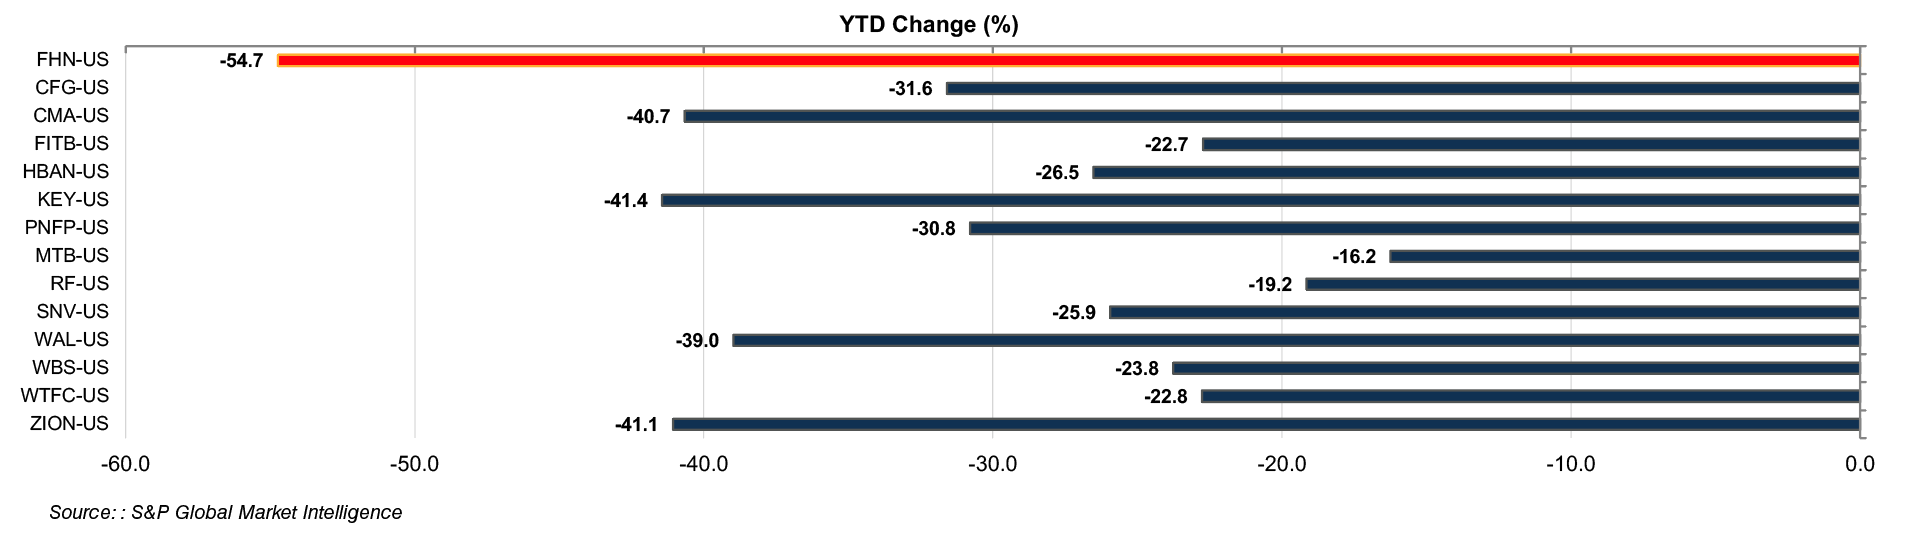
As shown in Figure 2, the year-to-date drop for FHN’s shares through May 24 was 55%, an amount that exceeded the 25-40% drop peers experienced.
Click here to expand the image above
Click here to expand the image above
Facts and circumstances can change merger arb discounts.
The impact of bank failures on investor psychology and possibly industry fundamentals was one factor. Another is a deteriorating earnings outlook as Fed rate hikes and sharply higher funding costs will cause 2022 margin expansion to flip to 2023 margin contraction. Also, Fed tightening has produced steep inversion of the yield curve, and inverted yield curves usually precede recessions by upwards of a year.
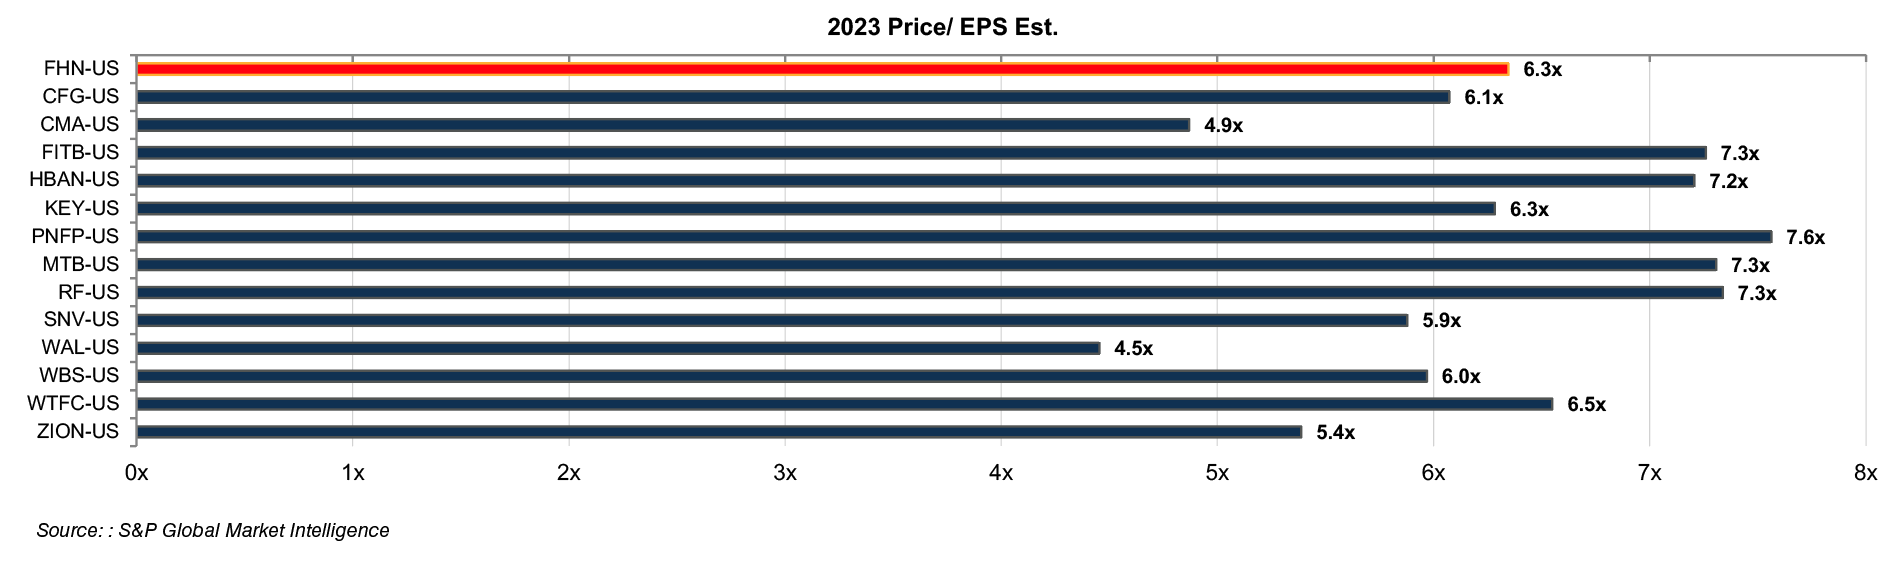
As a result, bank stocks have been revalued from low-to-mid teen P/E stocks when the TD-FHN deal was announced to single digit P/E stocks today even though analysts have been cutting estimates for nine months. The binominal outcomes for FHN and the merger arb community were wide: $25 if the deal closes or ~$10 per share if it does not close based upon 6-7x current year earnings.
Mercer Capital is a national valuation and transaction advisory firm with a focus on non-publicly traded equities and debt securities. We render valuation, fairness and solvency opinions and provide M&A and other transaction advisory services to depository and other financial services companies. Please call if we can be of assistance.
This article discusses the concept of fair market value and its various effects. First, we explain what fair market value means. Then, we explore the hypothetical negotiations between potential buyers and sellers when determining fair market value and the implications of these discussions.
Finally, we examine the impact on the so-called “marketability discount for controlling interests” by analyzing this “discount” from three perspectives: the meaning of fair market value, the integrated theory of business valuation, and the recurring and incorrect rationales for this discount.
Fair market value occurs at the intersection of hypothetical negotiations between hypothetical willing, knowledgeable, and able buyers and sellers. Therefore, in every fair market value determination prepared by business appraisers, it is critical that both buyers and sellers are present for the negotiation.
A fair market value appraisal should reflect considerations of both buyers and sellers and land at the intersection of their negotiations over the expected cash flows, growth, and risks associated with receiving those cash flows, whether for a business or an interest in one.
Every appraisal involves the specification of the relevant standard, or type of value. Fair market value is the most frequently used standard of value employed by business appraisers. Many times, appraisers cite a definition of fair market value and list the eight elements listed in Revenue Ruling 59-60 (“RR 59-60”) in their reports. The definition of fair market value found in RR 59-60 is:
2.2 Section 20.2031-1(b) of the Estate Tax Regulations (section 81.10 of the Estate Tax Regulations 105) and section 25.2512-1 of the Gift Tax Regulations (section 86.19 of Gift Tax Regulations 108) define fair market value, in effect, as the price at which the property would change hands between a willing buyer and a willing seller when the former is not under any compulsion to buy and the latter is not under any compulsion to sell, both parties having reasonable knowledge of the relevant facts. Court decisions frequently state in addition that the hypothetical buyer and seller are assumed to be able, as well as willing, to trade and to be well informed about the property and concerning the market for such property.
The eight elements listed in RR 59-60 are as follows.
(I call these the “Basic Eight Factors”)
Once the definition and eight factors have been listed, there is often little or no consideration of the implications of the definition in the remainder of many valuation reports, although lip service may be paid in report headers that appear to follow the outline of considerations. These are relevant factors for consideration, but RR 59-60 also states that the elements of common sense, informed judgment, and reasonableness must enter the process of weighing those facts and determining their aggregate significance.
The following figure provides a conceptual look at fair market value. The key elements from the definitions are highlighted around the figure. Hypothetical willing sellers have different interests than do hypothetical willing buyers.
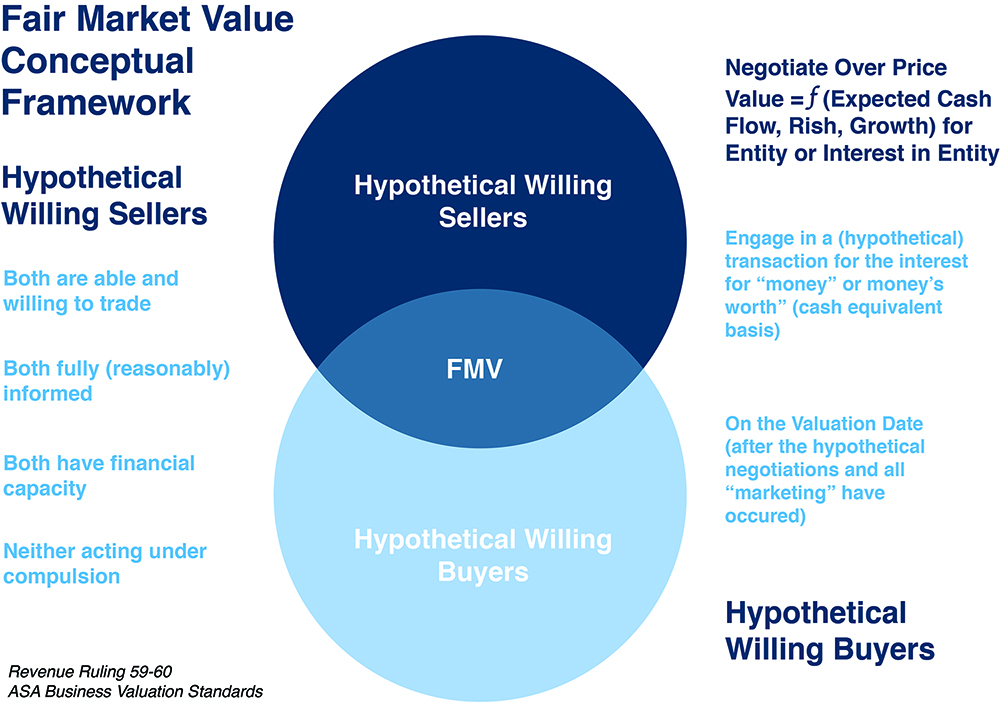
In the world of fair market value:
These elements above are important implications of the definitions of fair market value which are overlooked or misunderstood by some business appraisers, attorneys and judges. They are necessary, however, for the next element for consideration, the hypothetical transaction itself.
Fair market value assumes that both hypothetical buyers and hypothetical sellers are knowledgeable, willing, and able to transact, and that neither acts under any compulsion. The hypothetical parties negotiate at arm’s length and in their respective self-interests. And they engage in a hypothetical transaction with the following characteristics:
The hypothetical transactions of fair market value could not occur on the valuation date unless all hypothetical negotiations, including the marketing of the subject interest, had not been concluded on or before that date. Similarly, the hypothetical transactions could not be concluded unless all customary documentation of the transactions had been completed. We focus more on the resulting implications as we proceed.
The purpose of an appraisal is to simulate the hypothetical negotiations of hypothetical willing buyers and sellers and to determine, in the form of an opinion of fair market value, the intersection of their negotiations. In some appraisals, the hypothetical seller is not present and conclusions are too low to reflect fair market value. In other appraisals, the hypothetical buyer is not present and conclusions are too high to reflect fair market value.
What brings hypothetical willing buyers and sellers to the intersection point of fair market value? It is their respective assessments and negotiations regarding the expected cash flows, risks, and growth associated with the subject interest. Both the interests of buyers and sellers should be reflected in fair market value determinations.
The question of whether a marketability discount should be applicable to controlling interests of businesses has been around for a long time. I addressed the question in an article in the Business Valuation Review of the American Society of Appraisers in 1994. The answer to the questions was, and still is, no. I have addressed this issue in several books and numerous articles and blog posts since then.
Let’s first address the question based on the definition of fair market value, which represents a hypothetical transaction in a subject interest on the valuation date for cash or its equivalent. If there is a hypothetical transaction for a controlling interest in a company, say Acme Manufacturing, on the valuation date for cash at fair market value, what possible reason could there be for discounting that value for “lack of marketability?” It has just been marketed and the interest became fully liquid.
Next, let’s address the question of marketability discounts for controlling interests from the viewpoint of the integrated theory of business valuation.
Any valuation discount represents differences in expected cash flow, growth, and risk between one conceptual level of value and another. For example, the marketability discount, or discount for lack of marketability, represents differences in expected cash flow, growth, and risk between the marketable minority/financial control level of value (V = CFe / (Re – Ge)). CFe represents the normalized expected cash flow of an enterprise (business), Ge represents the expected growth of that cash flow, and Re represents the risks associated with the business and achieving the expected cash flows. The familiar Gordon Model represents the value of a business at the marketable minority/financial control level of value.
The nonmarketable minority level of value can be represented conceptually by the equation (Vsh = CFsh / (Rhp – Gv)). Vsh is the nonmarketable minority level of value. CFsh is the expected cash flow to the shareholder of a subject illiquid minority interest. CFsh is almost always less than CFe because of reinvestments into a business or agency costs imposed by controlling shareholders. Gv is the expected growth in value of the illiquid minority interest over the expected holding period of the investment (including liquidity assumed at the marketable minority/financial control level of value. Rhp represents the risks associated with achieving CFsh, including growth, over the expected holding period of the investment.
Why does a marketability discount (or DLOM) exist?
The lower cash flows of the illiquid interest and the greater risks create the wedge of lower value called the marketability discount.
Now, let’s try to conduct a similar analysis relative to a marketability discount for a controlling interest. First, we know that the marketable minority/financial control level of value is defined by the Gordon Model, or V = CFe / (Re – Ge). This is a summary statement of the discounted cash flow model in which normalized expected cash flows of the business are projected into the future for a finite period of time and then, a terminal value is calculated to represent the then value of all remaining cash flows beyond the finite forecast period.
Are the cash flows attributable to a controlling interest any different at the valuation date than those already projected in an appraisal? Of course not. It is the same business and the same interest. It is not possible to define lower cash flows attributable to the subject interest, or greater risks, or slower growth beyond the valuation date. After all, that is the date on which the assumed hypothetical transaction of fair market value occurs.
Let’s take the analysis a bit further. Assume we have valued 100% of the equity of Acme Manufacturing, a manufacturer of parts for the automotive industry. The initial financial control/marketable minority value is $30 million. You as the other appraiser, and I agree that this is a reasonable value. The question now is whether a marketability discount should be applied. In the following figure some of the typical arguments for such a discount are addressed and we find that they are not correct or reasonable.
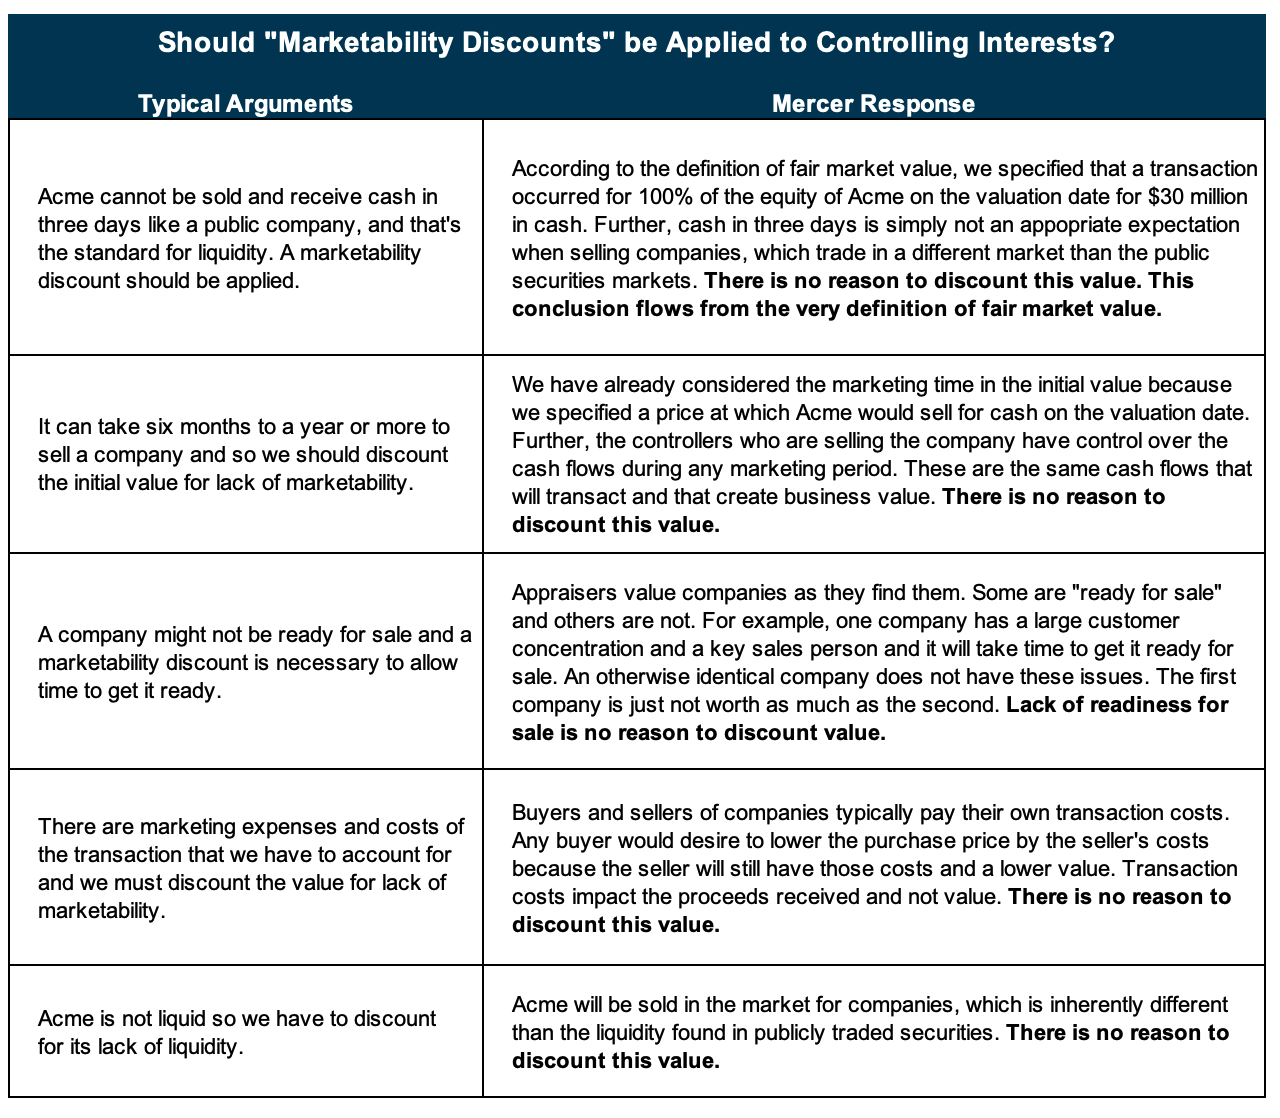
To those who would suggest that a controlling interest is “marketable and non-liquid” and therefore, a marketability discount for controlling interests should be applied, please articulate what that means in terms of expected cash flows, growth and the risks of achieving those cash flows. Differences in these factors are the only sources of valuation discounts (or premiums). It cannot be done, so those authors who try to create a fictional level of value are, in my opinion, simply wrong.
First Republic Bank’s first quarter 2023 earnings release said little, yet little needed to be said. The balance sheet “repositioning” induced by the deposit run is almost incomprehensible. Deposits at March 31, 2023, excluding the $30 billion placed by the biggest U.S. banks, fell to $74 billion, which is modestly below FRC’s year-end 2018 deposits. That is, four years of deposit growth was reversed in three weeks. Noninterest-bearing deposits dropped to $20 billion, thereby falling to a level last reported in 2016.
FRC illustrates the asymmetry of banking. Rising shareholder value results from the slow, grinding agglomeration of decisions made over years. The business model does not create overnight riches. However, that accumulation of value can unravel in an instant. The downside exposure results, in part, from the leverage inherent in banking’s business model. It is difficult to identify a more pure of this asymmetry between the gradual creation of value and its precipitous destruction than FRC.
FRC did not disclose its post-run cost of funds, nor has the rate paid on the $30 billion deposited by large banks been disclosed to our knowledge. Using FRC’s paltry disclosures and our best estimates, the table on the right provides a rough approximation of FRC’s current cost of funds. We caution that, among other uncertainties, further contraction of noninterest-bearing deposits would cause even more funding cost pressure.
FRC’s yield on earning assets expanded by 15 basis points to 3.66% in the first quarter of 2023, as a 20 basis point expansion in the yield on loans (to 3.73%) was offset, in part, by an unexplained 29 basis point decline in the securities
portfolio yield.
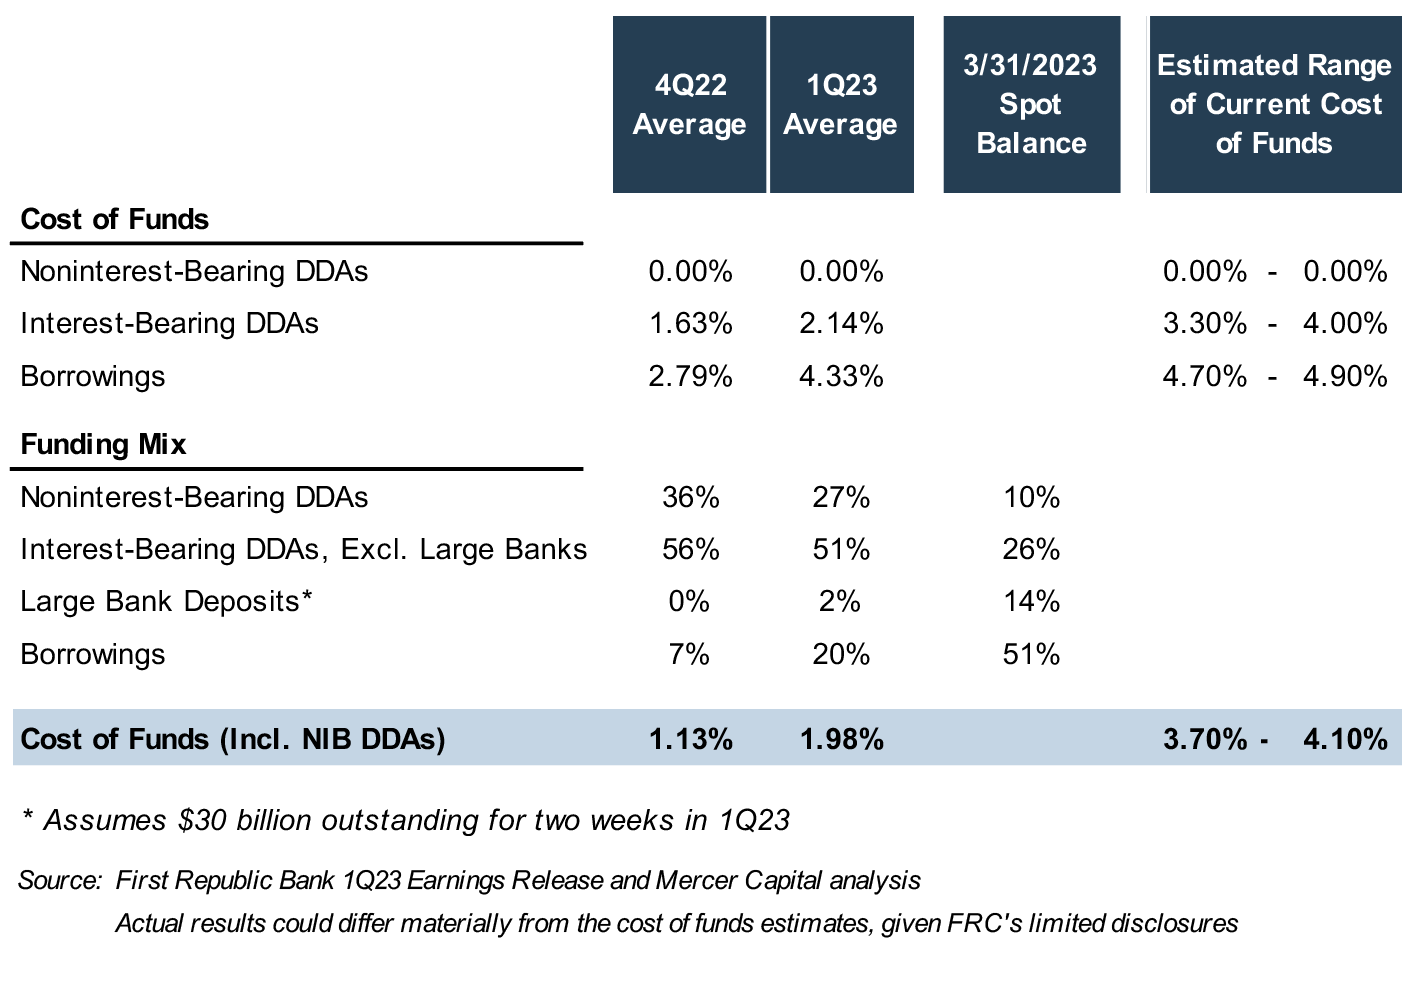
The current yield on earning assets presumably is higher than in the first quarter of 2023 due to the continued (slow) repricing of loans and higher balances held at the Federal Reserve, but any such yield expansion is likely inadequate to produce a current net interest margin significantly greater than zero.
Interestingly, FRC did not recognize a valuation allowance against its net deferred tax asset, implying that it continues to believe the tax assets will be recoverable. Also, it maintained the held-to-maturity classification of most securities, indicating that recent events have not affected its intent and ability to hold the investments to maturity.
At the larger banks that funded the $30 billion deposit, we imagine that corporate development staff have been furiously creating scenarios over the last few weeks to preserve as much value as possible at FRC. The circumstances surrounding FRC are a throwback to the S&L crisis in which abundant—and quite creative—financial engineering was deployed. Remember supervisory goodwill? We will see what’s pulled out of the toolbox this time, if it’s not emptied entirely, to develop a solution for FRC’s woes.
What was expected to be a prosaic first quarter was anything but that. It was punctuated by the failures of SVB Bank and Signature Bank, the wind down of Silvergate Bank and the near(ing) failure of First Republic Bank (NYSE: FRC). Ironically, failures that were precipitated by deposit runs were triggered by fears of unrealized losses in bond portfolios that occurred five months after Treasury yields peaked.
Year-to-date (through April 26) the Nasdaq Bank Index declined 28% compared to 13% for the S&P Bank Index as deposits flowed into the presumed safety of “too big to fail” institutions. JPMorgan Chase & Co. (NYSE: JPM) is an outlier among banks in that its shares are up slightly YTD. Also notable is the outperformance of Technology Select Sector (NYSE: XLK) this year in a reversal of 2022 when tech stocks underperformed in the market.
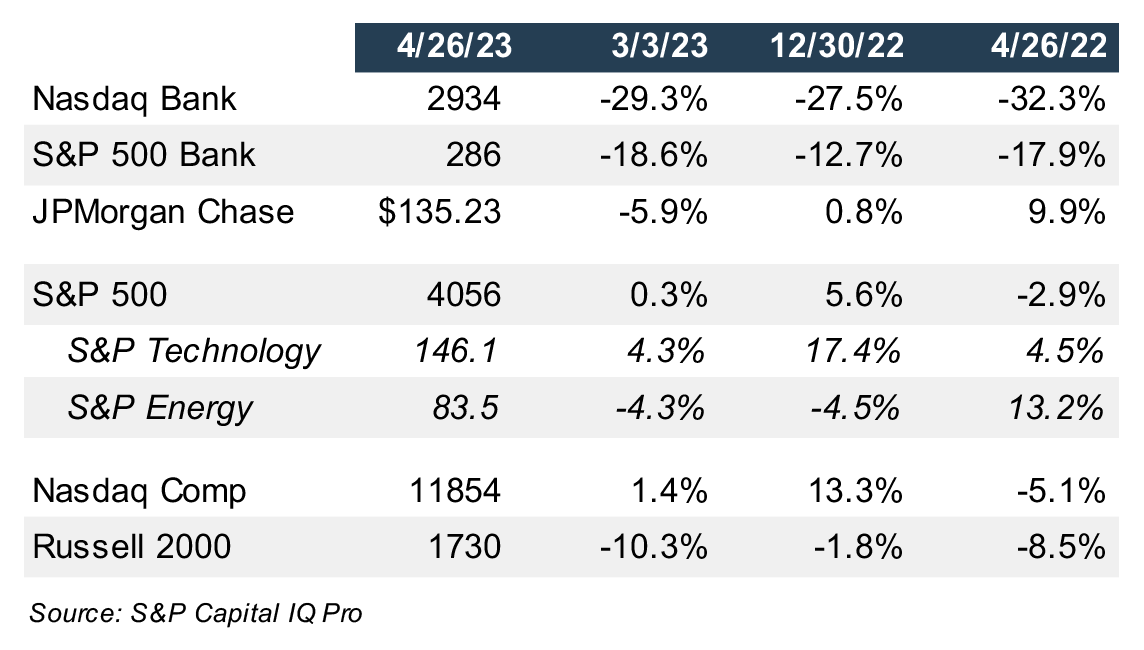
To the extent falling stocks are foreshadowing poor earnings or dilutive equity raises at low share prices, it was not evident in first quarter earnings among community banks ($1-$10 billion of assets) and regional banks ($10 billion to $50 billion of assets) reports as of April 25. Earnings were fine, albeit down from the fourth quarter as is often the case given the 90 days to accrue interest compared to 92 days in the fourth quarter.
The quarter was hardly a disaster, though the severe underperformance of bank stocks before SVB failed portends problems to come with likely some amount of overreaction by investors.
Ultimately, stocks follow earnings (or cash flow) over time, while valuations ebb and flow with changes in interest rates, an industry’s profit cycle, and expected earnings growth. Quarterly earnings do not matter much other than what the current quarter implies about earnings expectations over the coming year or two and how those updated expectations get expressed in sell-side analysts estimates.
As shown in Figure 2, Wall Street banks posted upside surprises as a group with JPMorgan producing blow out results as a result of deposit inflows and because trading was very strong as market volatility exploded. Otherwise, most banks missed what were already low expectations due to NIM pressure from rapidly rising cost of funds (“COF”).
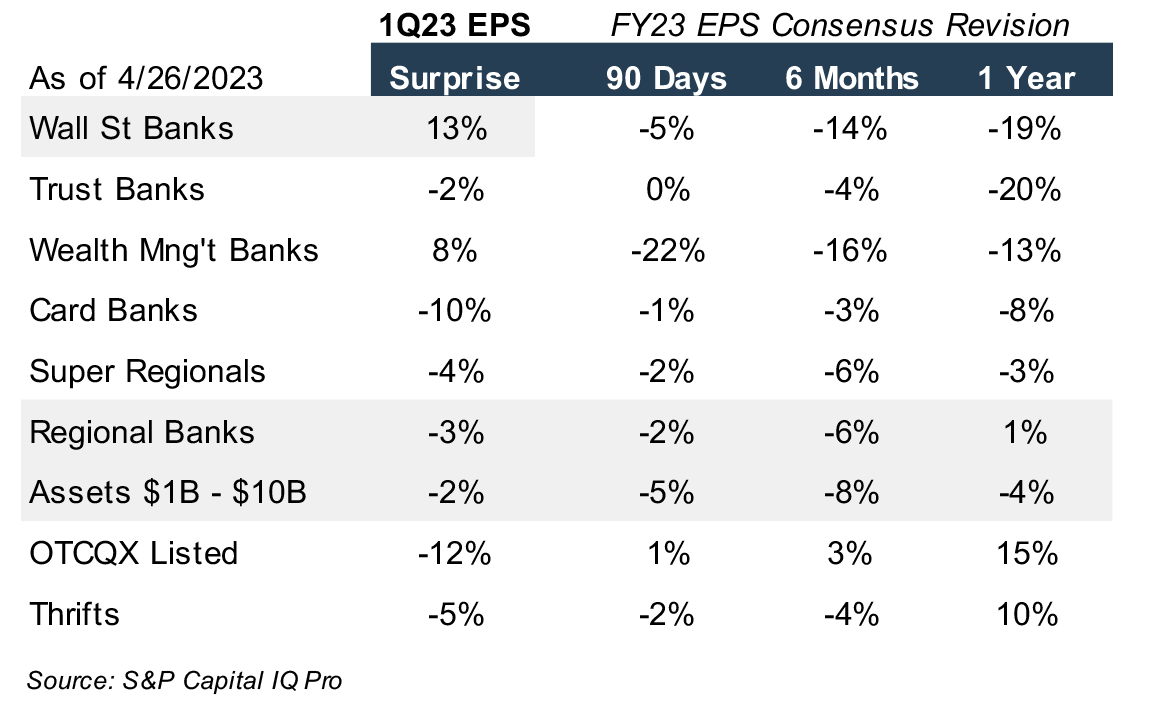
Figure 2 also partially explains why bank stock prices have fallen as consensus EPS expectations have declined over the past six months as a once benign rising rate environment has transitioned to a headwind. As shown in Figure 3 (on the next page) the gap between banks’ cost of funds and the quarterly average 3-month T-bill yield is unusually wide for a rising rate environment. The gap is now narrowing as banks have been forced to aggressively raise deposit rates and excess funds shift to interest bearing accounts.
Once analysts fully update estimates over the coming weeks, we suspect 2023 EPS estimates will show a much sharper reduction than what is reflected in Figure 2. However, the poor performance of bank stocks since the failure of SVB and SBNY implies investors have more worries than the COF/NIM dynamic on forward earnings.
To paraphrase the late Donald Rumsfeld, the known unknown is credit unless there is an unknown unknown that is troubling stocks. Inverted yield curves typically precede recessions by about 18 months compared to ten months of inversion so far in this cycle as measured by the 10/2 spread. Further, the failure of SVB/SBNY has tightened the availability of credit as banks seek to increase liquidity.
So far, leading credit indicators are mostly benign. Past dues and non-accrual loans within the banking system are low, and the option adjusted spread (“OAS”) on the BofA High Yield Index over U.S. Treasuries was 463bps compared to the 10-year average of 443bps. CMBS is showing some strain, however, with 5.6% of commercial mortgages remanded to special servicing though among subsectors retail remains very elevated, office is climbing and lodging has declined sharply over the past year.
Valuations are very low with community and regional banks trading for 8.1x and 8.7x consensus 2023 estimates and comparable multiples based upon flattish 2024 estimates. Super regionals trade for about 7x earnings. The long-term average based upon one-year forward earnings ranges from 12x for super regionals to 14x for community banks.
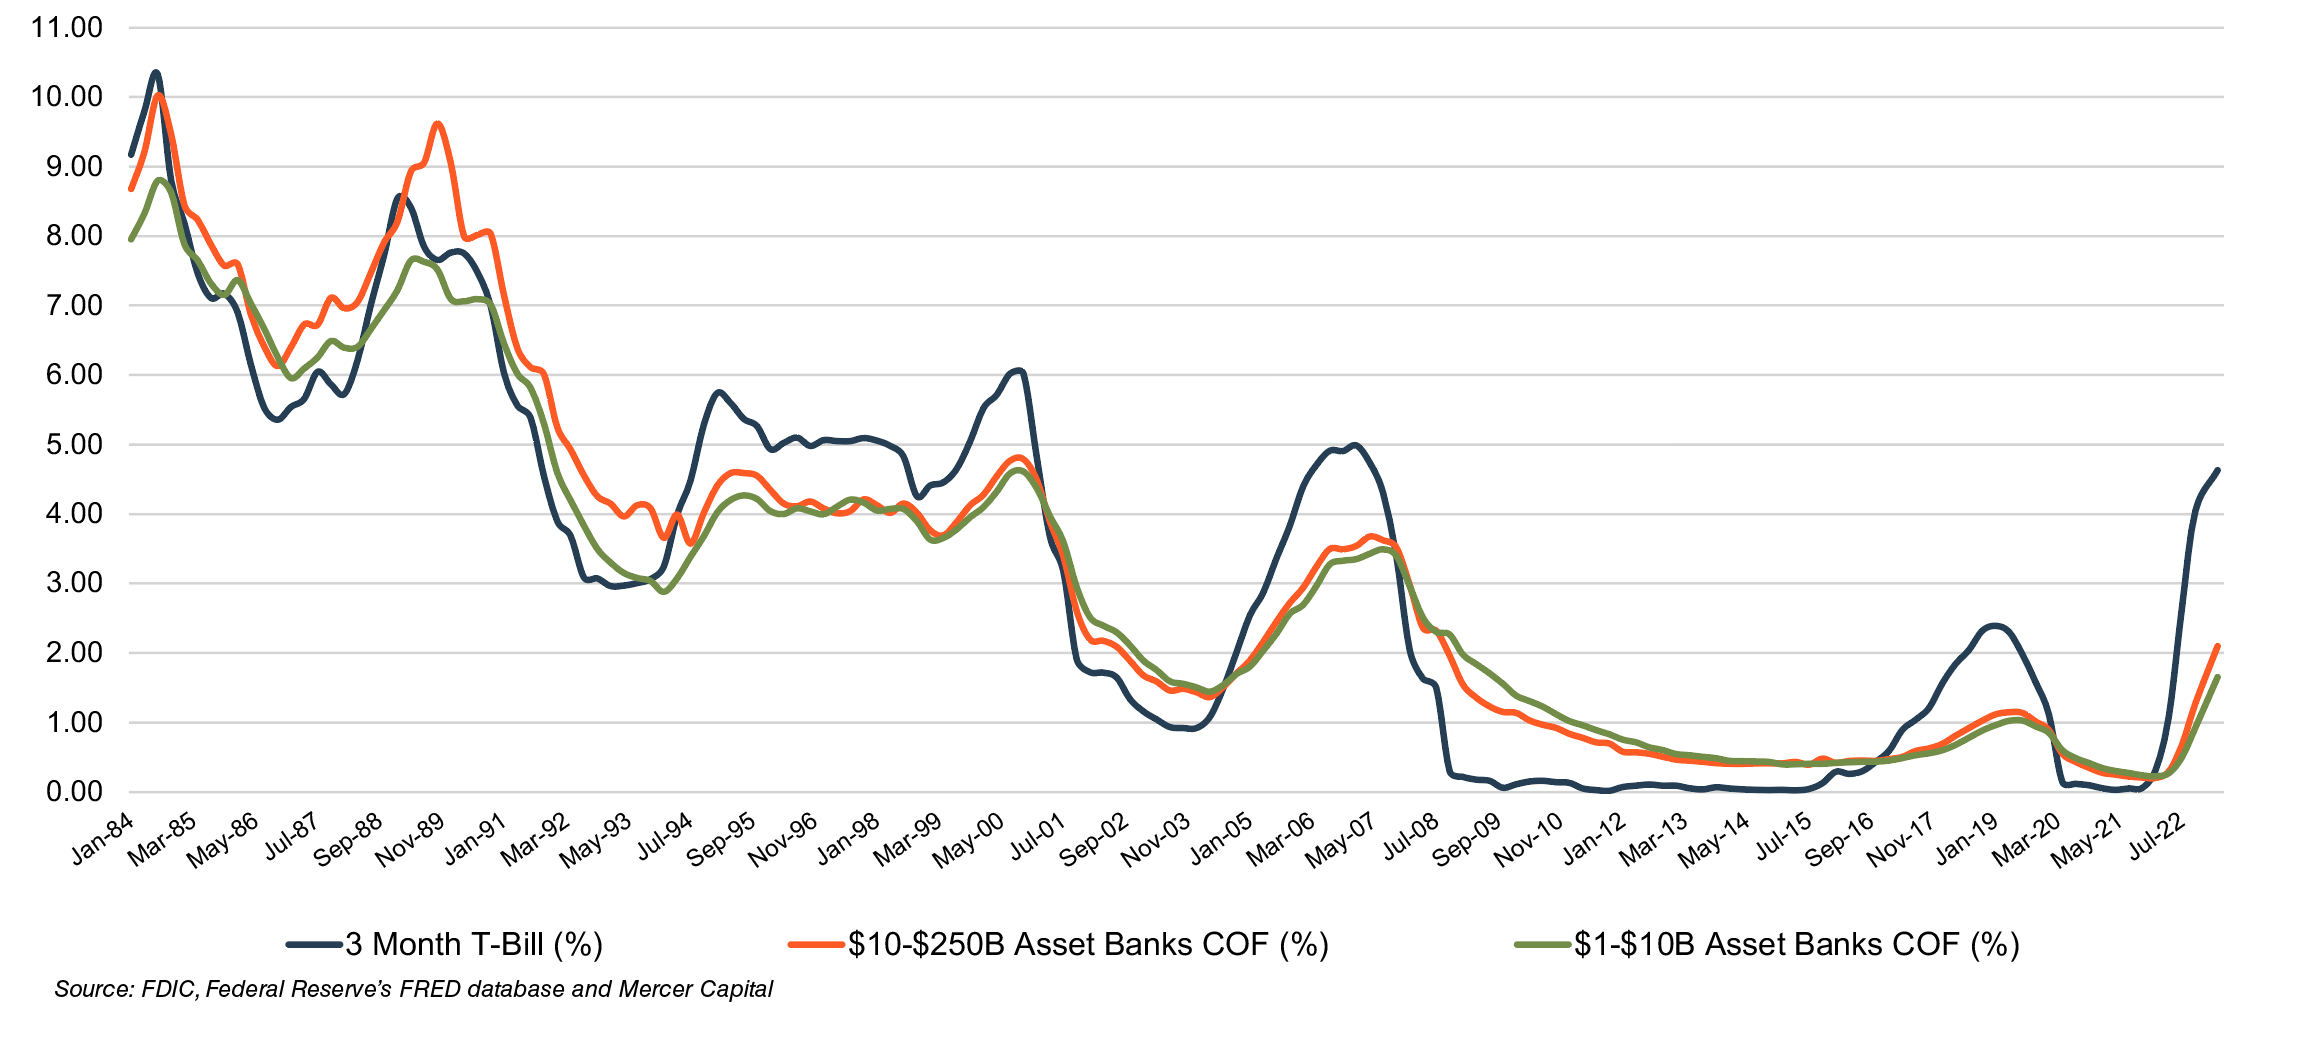
Click here to expand the image above
Whether the current environment proves to be a tremendous buying opportunity or a sell-off in anticipation of a sharp recession or prolonged period of stagflation is to be determined. Banks are characterized as “early cyclicals” on Wall Street — meaning they turn down well in advance of a recession and turn up when the recession is in full force. Nonetheless, we expect most community banks to perform well or well enough given low-cost deposit franchises — provided they have not over-invested in long-duration assets and/or operate with high-cost structures.
FHN is a tough call for the merger arbitrage community: $25 per share of cash if the current deal closes; regulators reject the deal, causing FHN’s shares to trade freely in a tough market for bank stocks; or the parties extend the merger agreement again, but does the price get renegotiated?
In the February edition of the Transaction News Update, we featured an article discussing how Spirit Airlines Inc. (NYSE: SAVE) may not have sufficiently considered whether JetBlue Airways Corp. (NYSE: JBLU) could obtain regulatory approval to acquire when it agreed to the JetBlue offer over a deal with Frontier Group Holdings, Inc. (NASDAQGS: ULCC) that was viewed as more obtainable from a regulatory perspective.
Ability to close is a key consideration for any board entertaining an acquisition or merger proposal. Memphis-based First Horizon National Corporation (NYSE: FHN) faces that question as it relates to its pending deal to be acquired by The Toronto-Dominion Bank (TSE/NYSE: TD) for $13.4 billion cash, or $25.00 per share, announced on February 28, 2022. Pricing at announcement equated to 2.27x year-end 2021 tangible BVPS and 16.6x the then consensus 2022 EPS estimate.
As shown below, the deal has been a tough one for the merger arbitrage community because the parties extended the termination date to May 27, 2023, from February 28 earlier this year when it was clear that regulatory approval would not be forthcoming by the one-year anniversary. On March 1, FHN disclosed in its 10-K that TD did not know when it would obtain regulatory approval. When FHN released 1Q23 earnings on April 19, management did not provide any updated commentary with the release (FHN discontinued quarterly conference calls once the deal was announced.)
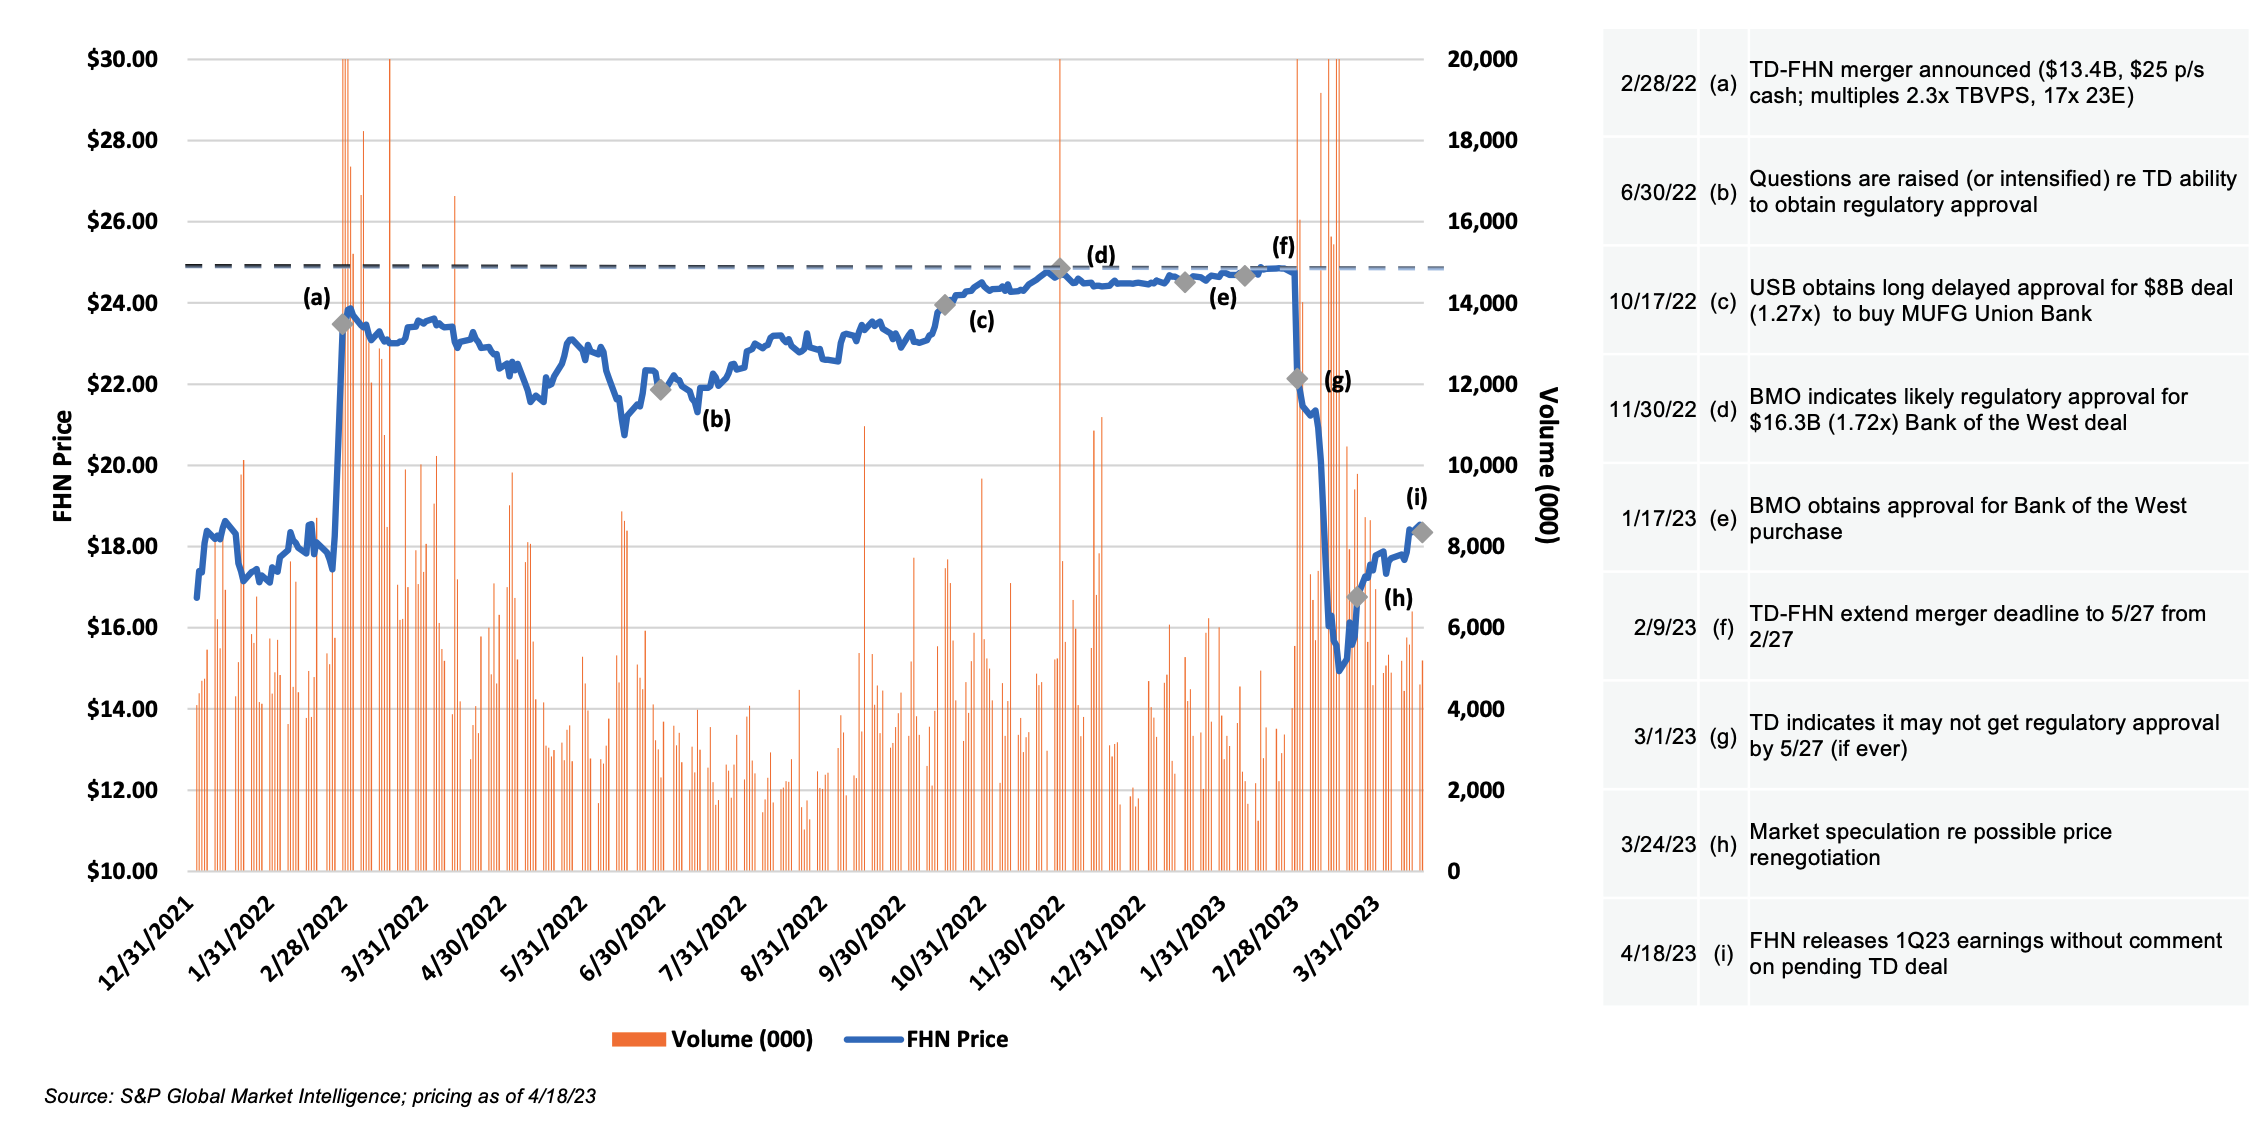
Click here to expand the image above
At the time of announcement, a few on Wall Street questioned whether TD could get regulatory approval given a tougher review process promulgated by the Biden Administration to approve deals among large banks (TD-FHN would be the third largest deal since the GFC). However, the concerns were not reflected in the market because FHN’s shares rose 29% on February 28, 2022, to $23.48 per share from $18.25 per share the day before as seen above. The discount to the cash (out) price by the close on 28th was 6.5%, a level that is consistent with Mercer Capital’s experience with merger arbitrage discounts when a transaction involves small regionals and publicly traded community banks. Historically, such discounts have been modest because regulators almost always approve such deals, and deal attorneys will offer some level of informal assurance regarding approval.
We do not have any unique insight into the pending TD-FHN deal, but the deal offers two distinct outcomes for FHN’s share price: regulators soon approve the deal, which would push FHN’s shares to near the $25 per share cash-out price; or regulators reject the deal or the parties terminate the deal given an inability to obtain approval and FHN’s shares trade as an independent company in a depressed market for bank stocks with presumably no immediate acquisition prospects. A third outcome involves a second extension of the merger agreement deadline while awaiting regulatory approval if it is perceived to be obtainable, though some TD shareholders are pushing for a lower price in an extension scenario.
When confronted about falling behind on child support payments and the pending foreclosure of his 109-room mansion, Evander Holyfield, a former world heavyweight boxing champion, explained that he faced a liquidity crisis, not an issue of solvency. It is an apt metaphor for the ructions that began on March 8, 2023 when Silvergate Bank announced its intent to return depositor funds and wind-down. The astonishing events of the last few weeks are illustrated by a few numbers:
A number of factors contributed to the recent bank failures, as well as the severe pressure on the stocks of certain banks that investors perceive as having similar issues. It’s a bit like a blues song where not one thing befalls the protagonist, but rather a cascading series of events leads to turmoil — like when the protagonist’s woman leaves him and also takes the dog. As Taj Mahal sings:
She caught the Katy
And left me a mule to ride…4
Figure 1 provides the market backdrop for March 2023, with various bank indices declining approximately 20% through March 24, 2023. We also include several banks in the market’s line of fire, including First Republic, PacWest, and Western Alliance.
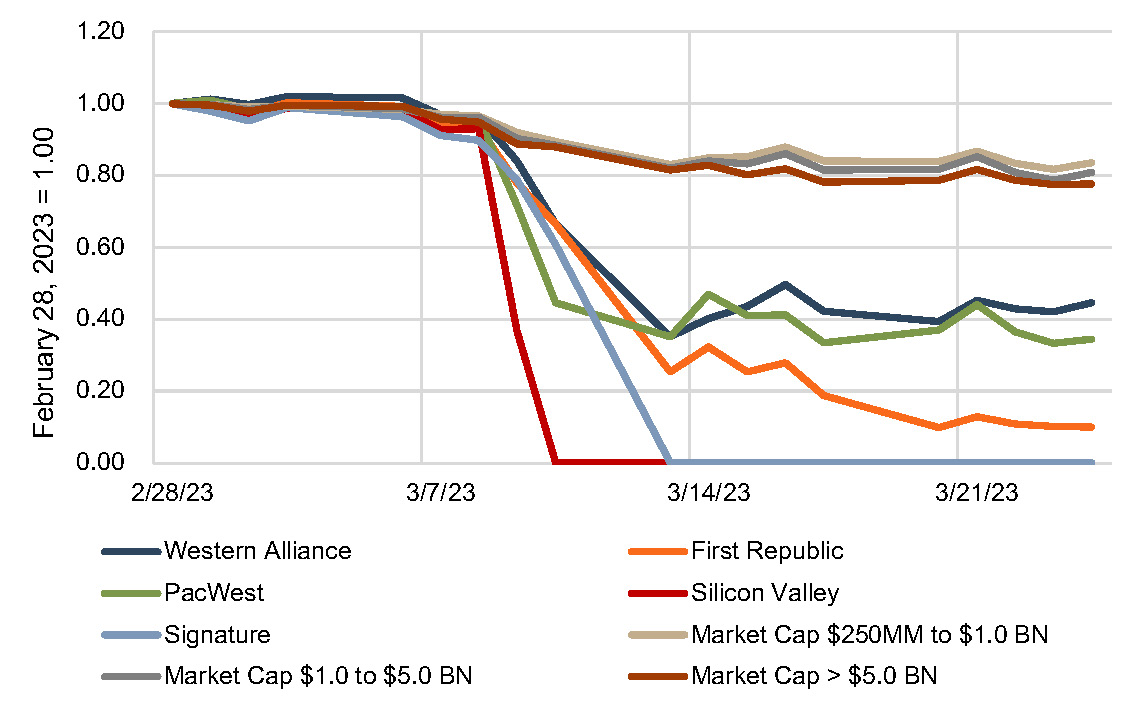
While Evander, on a self-reported basis, was solvent, the issue is complicated for the banking industry. We start by defining insolvency as a bank’s assets being worth less than its liabilities. Media reports fixate on unrealized securities losses, but from a valuation perspective, a bond maturing in ten years with a 3% rate is not much different than a loan with a similar structure (putting aside credit risk). However, this analysis overlooks an important asset that is not recognized on the balance sheet—the value of the bank’s deposit portfolio.
Figure 2 presents the tangible common equity/asset ratios for selected banks. While SVB’s bond portfolio duration and reliance on large dollar demand deposits no doubt were issues in its collapse, its balance sheet composition—with securities comprising 56% of total assets—contributed to the frenzy regarding SVB’s financial condition. If other banks had assets with observable prices equal to 56% of total assets, they might be in the same pickle. Note that SVB’s unrealized loss on securities (14.8%) is not the highest among these five banks.
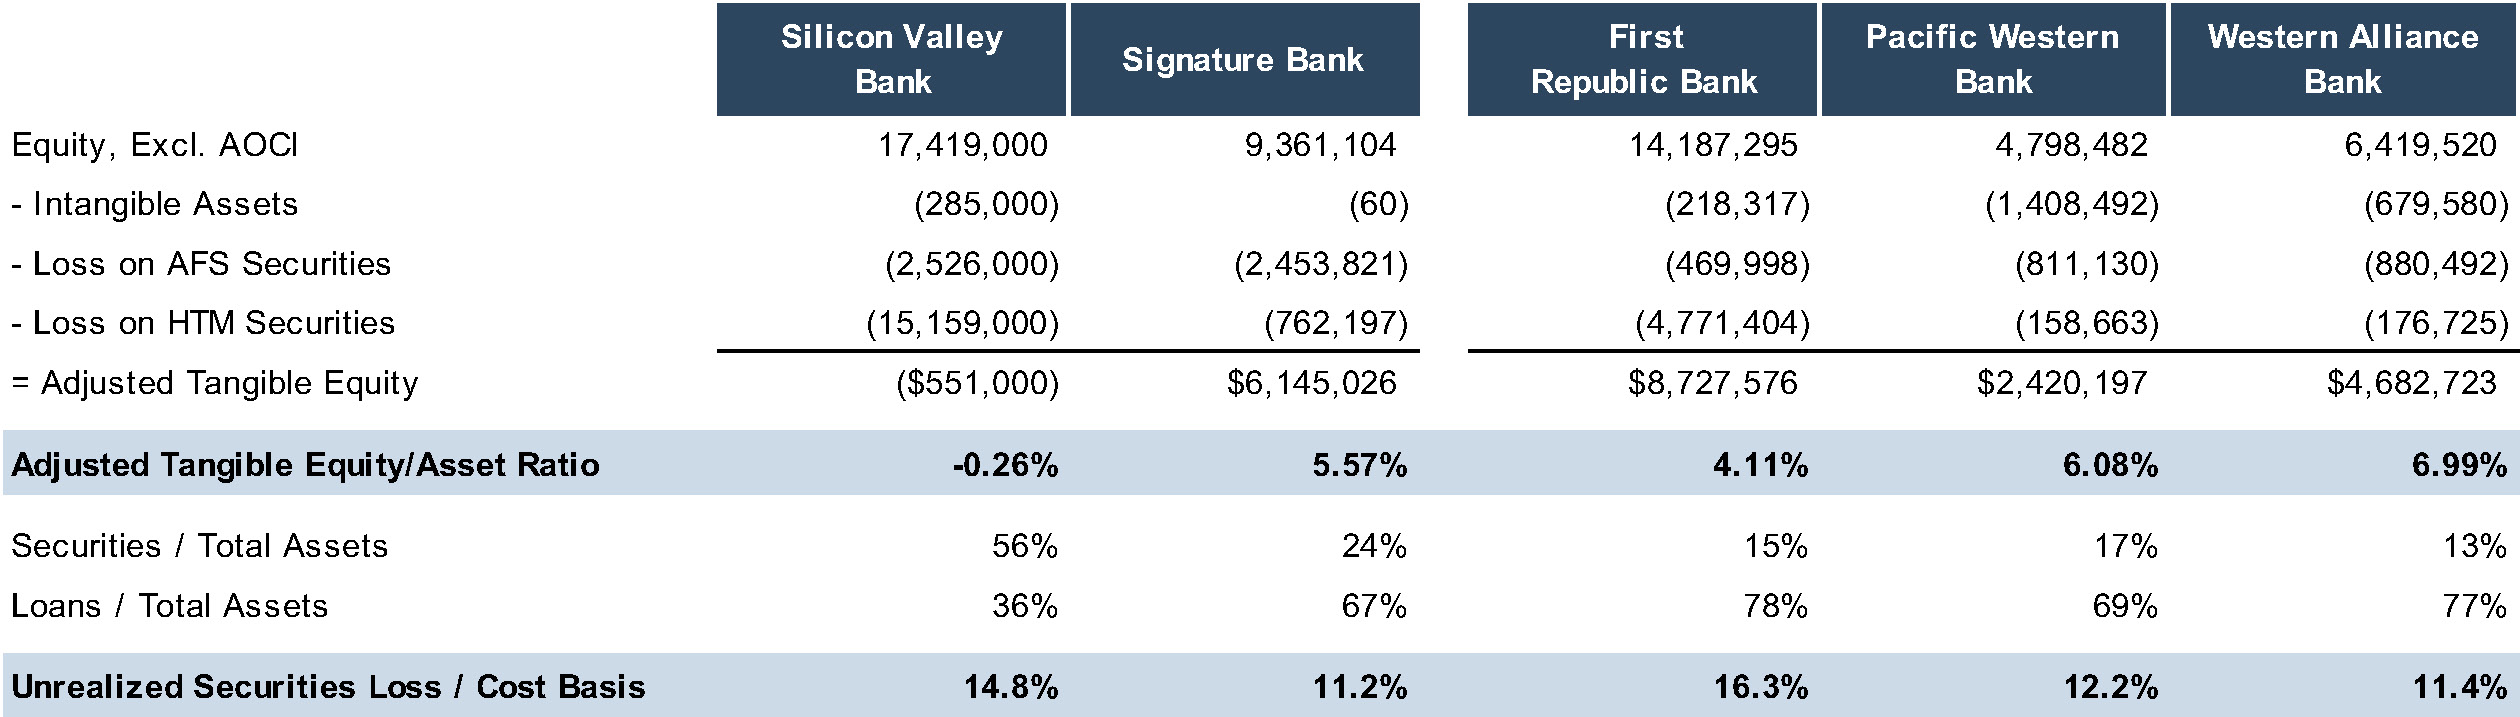
Click here to expand the image above
In our opinion, it is a sideshow to focus on only one component of the balance sheet — the securities portfolio—to determine solvency or skill at avoiding the effects of rising interest rates. From our client work, we suspect that unrealized “losses” on loans are lower than for securities (as a percentage of cost basis), due to a shorter duration. However, in dollar terms the unrealized losses likely are significant vis-à-vis equity. Sharply higher deposit portfolio values and strong capital positions, which offset the downward loan and securities adjustments, suggest that most banks are not insolvent. However, even if most banks are not insolvent, headwinds remain. The risk of a ruinous deposit run that crystallizes losses is now a risk the market must discount. Larger unrealized losses on assets imply longer asset durations, which place net interest margins at risk if depositors become more rate sensitive. Last, M&A remains difficult to accomplish, as mark-to-market accounting effectively realizes a target’s unrealized losses.
Into the febrile environment following Silvergate Bank’s announced wind-down, SVB launched a capital raise. While media reports indicate that a lead investor had been arranged and Goldman Sachs had soft orders for the remaining securities, the announcement of the offering—followed soon after by news of its difficulties—caused depositors to lose confidence in SVB’s financial strength and start the run on the bank. The failed offering raises several questions. First, was it a mistake to attempt the transaction in the immediate aftermath of Silvergate’s announced wind-down? Second, if SVB’s capital raise had closed before the bond portfolio restructuring was announced, would the deposit run even had occurred?
Across the Atlantic, Credit Suisse’s forced marriage to UBS led to the write-off of its contingent convertible (“CoCo”) bonds, with the CoCo holders faring worse than Credit Suisse’s shareholders. This inversion of the normal capital structure hierarchy, with shareholders faring better than some debtholders, caused yields to spike on CoCo bonds as the market repriced the risk of CoCo bonds. This raises a capital issue for some global banks. If stock prices are depressed and CoCo bonds are exorbitantly expensive to issue, then the only other capital raising alternative is to limit balance sheet growth with its attendant macroeconomic costs.
After SVB and Signature failed, First Citizens Bank purchased $72 billion of SVB loans at a $16.5 billion discount (23%) and Flagstar Bank purchased $12.9 billion of loans at a $2.7 billion discount (21%).5 While the nature of these loans was not disclosed, we assume that most of the discount was attributable to interest rate adjustments rather than credit exposure given the failed banks’ relatively low level of nonaccrual and delinquent loans at year-end 2022. Even if the FDIC was a distressed seller, the discounts indicate the potential capital hole that may exist in troubled banks as all the assets are marked to market.
These circumstances surrounding distressed banks point to difficulties in resolving interest rate induced solvency issues through additional capital. This differs from the Great Financial Crisis when the balance sheet problems could be isolated to, for example, land loans that represented 10% of total loans. In the current environment, “risk-free” assets like government bonds contribute significantly to solvency concerns; thus, a much larger proportion of a bank’s assets is underwater—though many of the assets are at no risk of credit loss.
Even if capital can be raised without triggering a deposit run, an offering that increases total equity by, say, 10% could be inadequate to resolve the market’s concern about capital and diminished earning power. The only remaining alternative for banks that become troubled is to backstop the banking system with liquidity in the hope that (a) banks have sufficient asset yields to cover higher funding costs, thus allowing them to gradually replace low yielding assets and/or (b) rates decrease.
Another perplexing thread in the story is the inability of SVB and Signature to access timely back-up sources of liquidity. As withdrawals accelerated in the afternoon of Thursday, March 9th, SVB sought funding from the FHLB and then the Fed. SVB missed an afternoon cutoff to process a large FHLB advance. Then, SVB attempted to transfer excess collateral from the FHLB to the Fed, but SVB’s transfer could not be processed before the Fed’s deadline. This left SVB with a negative cash balance of $1 billion on March 9th, leading to its closure the next day.6 Signature also faced issues borrowing from the FHLB as its deposit run intensified on March 10th. A request over the weekend to borrow $20 billion from the Fed was rejected, leading to Signature’s failure.7
An enduring question is whether these two failures had to happen, at least when they did. Not to diminish the financial issues involved, but depositors and the Fed/FHLB were moving at different speeds. It also is difficult to square Signature’s rejection by the Fed with First Republic obtaining, at one point, $109 billion from the Fed. This situation has some parallels to the Fed saving Bear Stearns but allowing Lehman Brothers to fail.
The Fed and FHLB have been essential in stabilizing the banking system, but the Fed’s reverse repo facility, used since 2013 to conduct monetary policy, also contributes to the volatility. Now, money market funds can park client funds at the Fed. Not only do these funds generate higher yields than most bank deposit accounts, but there is virtually no risk of the Fed collapsing. Therefore, uninsured depositors have the best of both worlds—higher yields than traditional deposit accounts and lower risk. Indeed, money market funds experienced inflows of $121 billion during the week that SVB failed.
Bill Dudley, a former president of the New York Fed, warned that allowing money market funds to access the Fed’s balance sheet could cause the “disintermediation of the financial system.” While depositors have not done this en masse, it suggests potential unintended consequences of current monetary policy.8
Even if SVB and Signature had been rescued, the rates on replacement funding for the deposit outflows likely would have exceeded their asset yields as may be the case with First Republic. As indicated in Table 2, the fourth quarter 2022 yield on earning assets was only 3.38% for SVB and 4.13% for Signature. Instead of an immediate failure, a low or negative NIM would have eroded capital. Did the banks have sufficient capital to absorb this gradual capital erosion while waiting for rates to decline? Given their asset durations, SVB’s and Signature’s failures may have been inevitable. PacWest and Western Alliance appear better positioned to handle the cost of replacing deposit outflows at market rates, while First Republic’s position is tenuous.
Both Silvergate and SVB cited NIM pressure, rather than deposit withdrawals, as the reason for liquidating securities. Silvergate’s CEO addressed an analyst question as follows:
Not knowing whether the deposit withdrawals were going to be temporary, we borrowed against our securities portfolio. That’s what it was there for. It was all pledgeable, high quality, and so we borrowed against it. But then to your point, when you’re borrowing, you’re borrowing at current rates, right? So if the securities portfolio was yielding a lower level at the end of the third quarter because it had been put in place and some of it was longer duration put in place in the past, then you could just connect the dots, right? We were borrowing at a higher level all in because the Fed had been raising rates so rapidly during 2022.
… How do we make sure we’re protecting the future capital? Well, it’s by selling the longest duration right now so that we can preserve the earnings power….9
SVB’s investor presentation regarding its capital raise described the transaction’s rationale as follows:
Today, we took strategic actions to strengthen our financial position–repositioning SVB’s balance sheet to increase asset sensitivity to take advantage of the potential for higher short-term rates, partially lock in funding costs, better protect net interest income (NII) and net interest margin (NIM), and enhance profitability. 10
The situation with NIMs for SVB, Signature, and First Republic is reminiscent of the S&L crisis. Fortunately, most banks have higher asset yields than this trio. This suggests several lessons. First, the gap between the rates on core deposits (1.58% for First Republic’s interest-bearing deposits, for example) and wholesale borrowings means that large core deposit losses can quickly devolve into severe NIM erosion, despite the most robust asset/liability modeling. Second, uncertainty will continue to cloud the outlook for banks with low yielding, long-term assets for which NIM preservation is reliant on depositors remaining insensitive to higher rates available elsewhere.
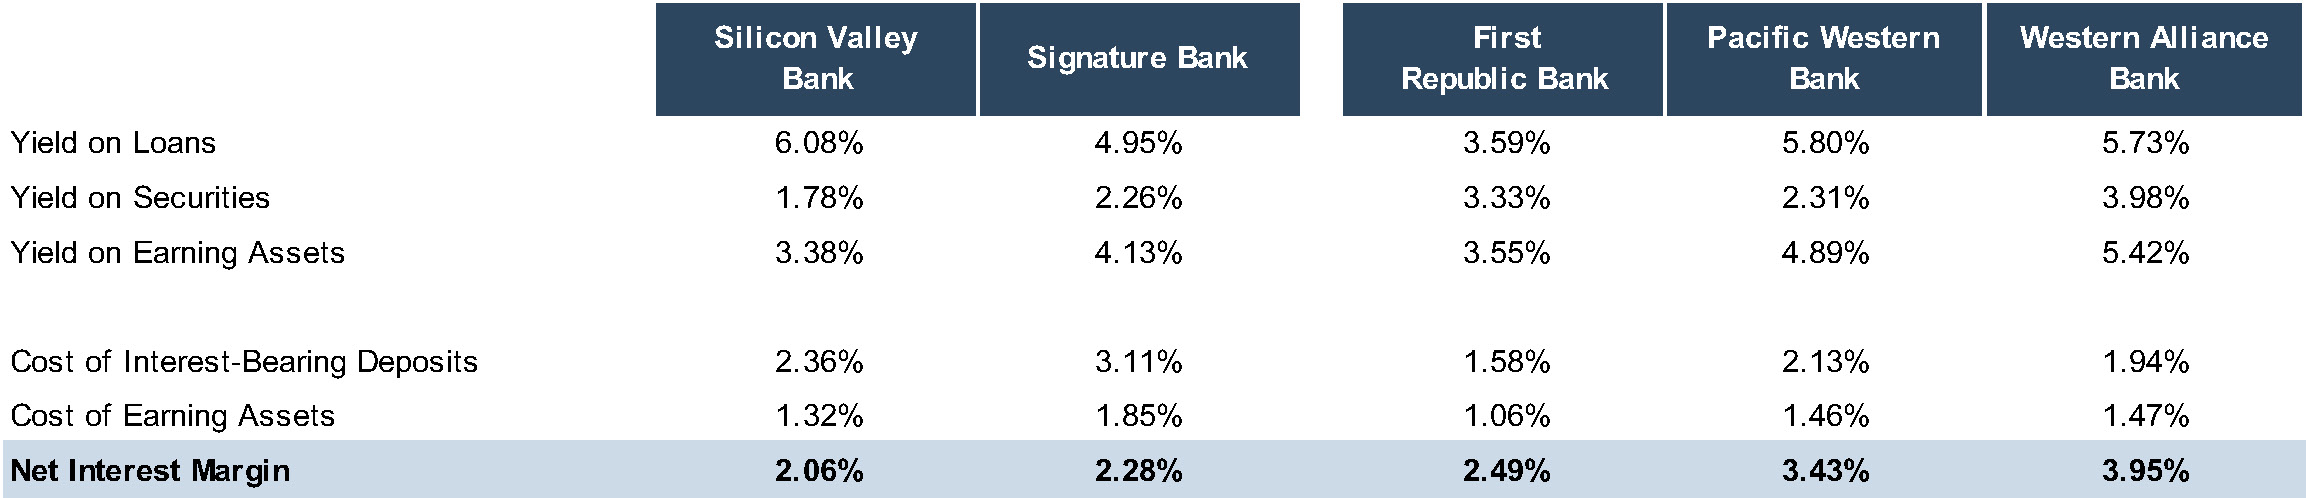
Click here to expand the image above
The current rate environment is not unprecedented, but memories have faded as the long bull market for bonds continued unimpeded. In 2006 and 2007, the Fed Funds target rate remained in the 5% range, similar to the current target rate. Mercer Capital obtained data for banks with year-end 2022 total assets between $100 million and $3 billion that reported historical financial data over the entire period from 2000 to 2022.
During the 2006 to 2007 period, this group of banks reported a median cost of interest-bearing deposits in the 3.50% range.
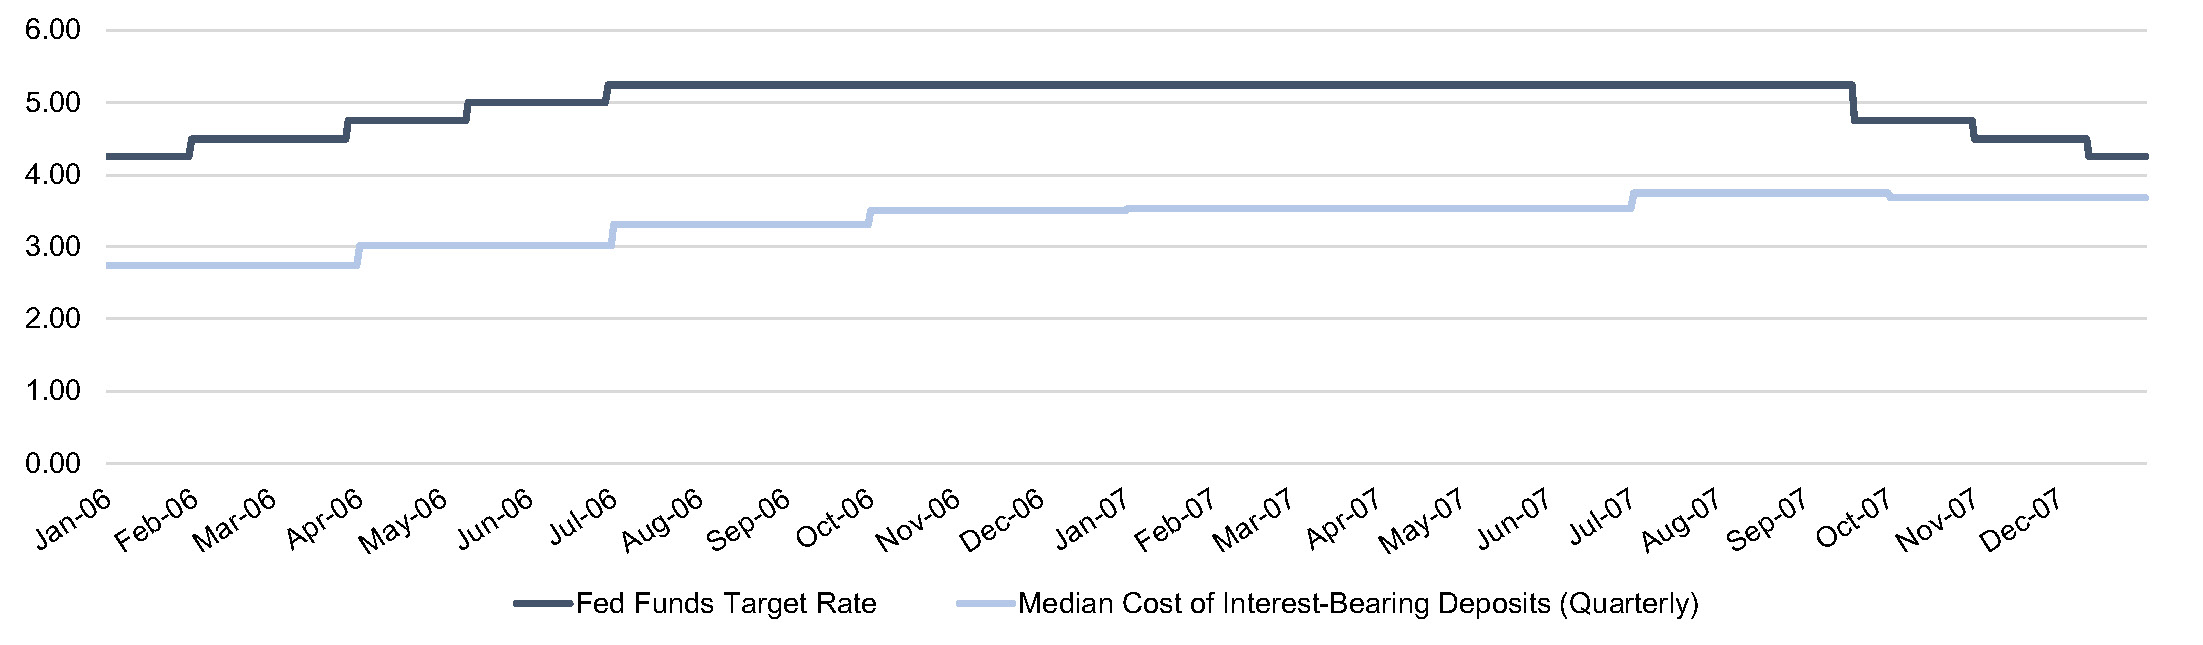
Click here to expand the image above
By contrast, Figure 5 shows the progression of the Fed Funds target rate and cost of interest-bearing deposits for the peer group in 2022. Though still rising, the cost of interest-bearing deposits was 0.75% in the fourth quarter of 2022. Deposit funding costs are almost exactly reversed from their level in late 2007. In the fourth quarter of 2007, 99% of banks had a cost of interest-bearing deposits over 2.00%, whereas 97% of banks had a cost of deposits under 2.00% in the fourth quarter of 2022.
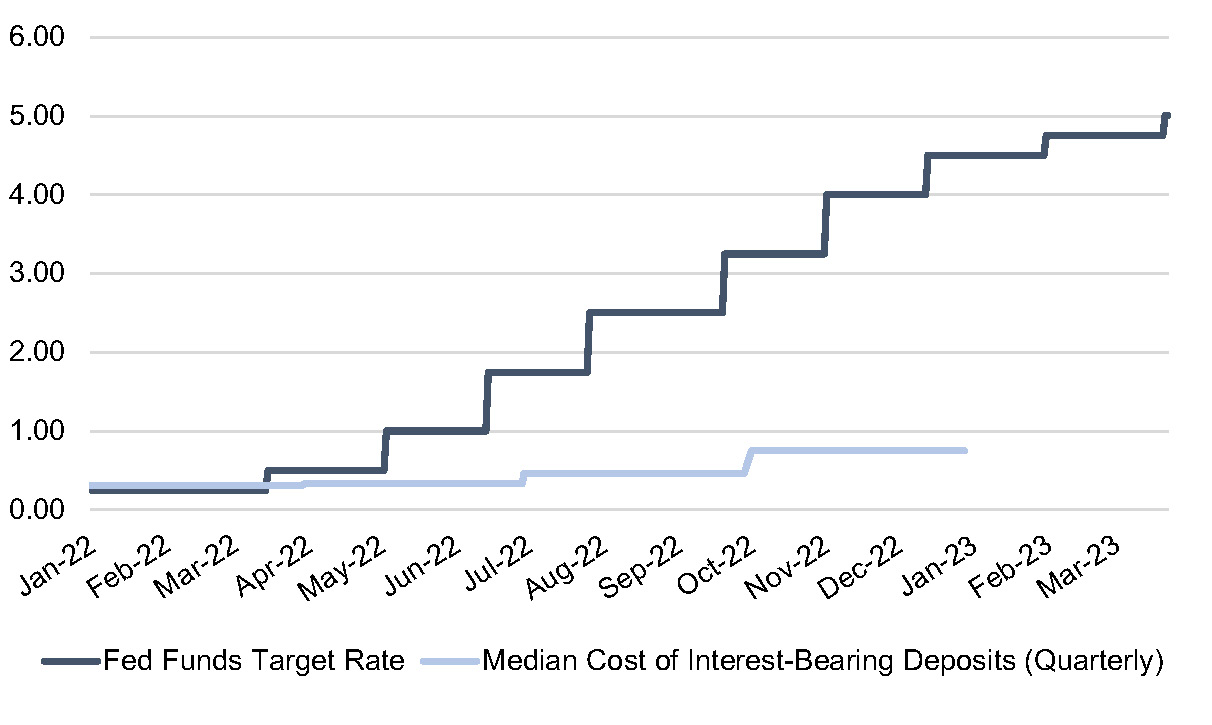
It is interesting to speculate on depositor behavior in the current interest rate environment. Perhaps depositors are desensitized to higher rates after the long zero rate environment, despite the ease with which funds can be transferred to other alternatives. There are many more investment alternatives now than in 2006 and 2007. Thus, rate sensitive funds may have already fled bank deposit accounts for higher yielding alternatives, leaving the remaining depositors stickier than in past higher rate environments. Customers could be more appreciative of the technology and services offered by banks than in the 2006 to 2007 period.
Like the Katy leaving the station, the banking industry is embarking into the unknown after the failures of SVB and Signature. Most banks will remain as sturdy as the mule left behind, though not without greater uncertainty until the gap narrows between the book value and fair value of bank assets and funding costs stabilize.
ASC 805 provides guidance on the accounting and reporting for business combinations. Generally, an acquirer, whether public or private, must allocate the consideration paid for the business across tangible and identifiable intangible assets, with any residual purchase price over the fair value of such assets attributed to goodwill. The Division of Corporation Finance (the “Division”) of the U.S. Securities and Exchange Commission (“SEC”) ensures that publicly-traded firms disclose material information, such as those relevant to certain business combinations, to investors through its review of certain public filings, including Form 10-K, Form 10-Q, proxy materials, and other filings.
Upon completion of its review of the aforementioned filings, the Division may issue “comment” letters to the public filers. Comment letters set forth staff positions and do not constitute an official expression of the SEC’s views. Comment letters may request that a company (i) provide additional supplemental information so the Division staff can better understand the company’s disclosure; (ii) revise disclosure in a document on file with the SEC; (iii) provide additional disclosure in a document on file with the SEC; or (iv) provide additional or different disclosure in a future filing with the SEC. Several rounds of comment letters and response letters between the Division and the filer or the filer’s legal counsel may occur until the issues are resolved.
Comment letters are frequently issued in relation to business combinations. Comment letters and response letters are public information and can provide unique insight into both qualitative and quantitative factors that should be considered in determining the fair value of intangible assets when performing a purchase price allocation. The following is a sample of specific issues the Division has commented upon in recent years concerning business combinations and individual intangible assets.
On September 1, 2021, TD SYNNEX Corporation (“TD SYNNEX”) purchased all of the outstanding shares of common stock of the parent entity of Tech Data Corporation (“Tech Data”) for approximately $7.2 billion. Identifiable intangible assets included customer relationships with an allocated fair value of $3.86 billion. The Division reviewed TD SYNNEX’s Form 10-K filed on January 28, 2022 for fiscal year 2021, noting the following about the Tech Data customer relationships: (Click here to see full comments and responses)
“We note you recorded $3.86 billion as the fair value of customer relationships with a weighted average useful life of 14 years. Please tell us how you evaluated the guidance in ASC 350-30-35-3 in determining the useful life, including explaining the characteristics of the customer list that support this assigned life, and all other pertinent factors considered in your analysis.”
TD SYNNEX responded as follows:
“The Company respectfully submits that in measuring the fair value of the customer relationships acquired as part of the acquisition of Tech Data, we engaged an independent internationally-recognized firm that valued the customer relationships using the multi-period excess earnings method, a variation of the income approach. Under the multi-period excess earnings method, the remaining useful life is an output rather than an input. Therefore, the Company considered guidance under ASC 350-30-35-3 which states that if an income approach is used to measure the fair value of an intangible asset, in determining the useful life of the intangible asset for amortization purposes, an entity shall consider the period of expected cash flows used to measure the fair value of the intangible asset adjusted as appropriate for the entity-specific factors in this paragraph.”
In most cases, customer relationships acquired in a business combination are valued using the multi-period excess earnings method, or MPEEM. The various assumptions and mechanics of the MPEEM are beyond the scope of this article. The lesson here, though, is that choosing the correct methodology for valuing an intangible asset is just the first step. The Company’s response continued:
“The Company advises the Staff that Tech Data as a global IT distributor, purchased and resold technology products to an active customer base of more than 100,000 resellers, system integrators, and retailers. Tech Data predominantly sold products to its customers on an individual purchase order and transactional basis, rather than pursuant to long-term contracts. Although long-term contracts are not in place, customer relationships are strong within the IT distribution industry with relatively low customer attrition rates. In measuring the fair value of customer relationships, the Company established that approximately 90% of the present value of expected cash flows used to measure the customer relationships intangible asset were generated over a period of 12 to 15 years. The period over which 90% of the present value of expected cash flows were generated varied slightly within this range between the three geographic regions in which Tech Data operated (Americas, Europe and Asia Pacific). The customer attrition rates applied in valuing the customer relationships were based on the historical experience of Tech Data and the expected attrition in the customer base within each of the geographic regions. Based on the foregoing factors, we believe a weighted average useful life of 14 years is appropriate.”
TD SYNNEX’s response emphasizes a quantitative approach as it relates to the characteristics of cash flows from customer relationships that support the 14-year weighted average useful life as requested by the Division.
On December 30, 2017, Live Ventures Incorporated (“Live Ventures”) acquired 100% of ApplianceSmart Inc. and ApplianceSmart Contracting, Inc. (“ApplianceSmart”) for $6.5 million. The intangible assets included a trade name, which was assigned a fair value of $2.0 million. The Division reviewed Live Ventures’ Form 10-K filed on December 27, 2018 for the fiscal year ended September 30, 2018, noting the following about the ApplianceSmart trade name: (Click here to see full comments and responses)
“Given the financial deterioration of ApplianceSmart prior to purchase, please tell us in more detail how you determined the trade names acquired were worth over $2 million.”
Companies that are contemplating an acquisition and preparing the related disclosures would do well to note the line of questioning from the Division in this example, particularly the emphasis on methodology.
Live Ventures responded as follows:
“…As part of determining the value of the assets acquired, ApplianceSmart engaged an outside company, Gordon Brothers, to fair value the acquired assets…In determining the fair value of the ApplianceSmart trade name, Gordon Brothers performed a quantitative valuation using the relief from royalty methodology of the income approach…This fair value measurement methodology is premised on the assumption that an owner/operator of a company would be compelled to pay the rightful owner of the intangible asset (such as a trade name) if the owner/operator did not have the legal right to utilize the subject intellectual property. Since ownership of a trade name relieves a company from making such payments, the financial performance of the firm is enhanced to the extent that these royalty payments are avoided.”
Gordon Brothers conducted the following analysis to estimate the fair royalty rate and the fair value of the ApplianceSmart trade name, which included:
In addition to the above quantitative calculation, Gordon Brothers gave qualitative consideration to the following:
Pretty thorough response, right? Not for the Division, which came back in another comment letter (more than one year later!) asking for more explanation from Live Ventures. Remember – the original question above asks for “more detail.”
“We note your response to comment 3. Please provide more detail regarding the royalty rate for the subject trade name and respective required rates of return used in the relief from royalty calculation. In addition to quantifying the inputs, please tell us how these inputs were determined, if a range of inputs were considered, and the magnitude of the impact on the trade name value if other inputs within the range, if any, had been used.”
Concerning the selection of the royalty rate used, the Company responded:
“In evaluating the ApplianceSmart trade name, third-party royalty rates are used as a guide to establish a range of possible value. Gordon Brothers utilized the ktMINE Database to research third-party royalty rates for similar trade names, namely, storefront brands, utilized within the industry for household appliance stores. Based on their research, five comparable licensing agreements for similar trade names were found that support royalty rates yielding a median range from a low of 0.35% to a high of 1.1%, with a median range around 0.7%…After consideration of the above qualitative factors and the market-derived royalty rates, Gordon Brothers determined a 0.5% royalty rate to be reasonable in the valuation of ApplianceSmart’s trade name.
The economic value of this trade name is expressed as the present value of the expected after-tax royalty savings. Accordingly, the royalty earnings can be calculated by applying the royalty rate to the estimated sales. The royalty savings were applied to the total sales as all sales are generated under the subject trade name.
The royalty savings were further adjusted for taxes and then discounted to present value using a discount rate that reflects the risks inherent in intangible assets such as the subject. This discount rate reflects the additional risk in an investment in intangible assets versus the business as a whole.
In addition, Gordon Brothers added an amount representing the net present value of the tax savings resulting from the amortization of the value of the trade name over a 15-year period to the net present value of the after-tax royalty savings to yield an indication of Fair Value for the trade name of $2.0M.
Gordon Brothers has estimated a 20-year remaining useful life for trade name based on the nature of the industry, the length of time that the Company has been in business, discussion with Management, and the relative strength of the trade name in the marketplace…”
Concerning the selection of the discount rate use, the Company responded:
“Gordon Brothers made a determination of required rates of return based on the following assessments and assumptions.
Assets within a business enterprise have different risk, liquidity, and return characteristics. The rate of return on any particular asset is typically commensurate with its risk, with the discount rate reflecting the risk associated with the income attributable to the asset…Intangible assets in any valuation depend on the facts and circumstances of each individual valuation. Returns on individual assets are selected based upon a number of factors, including the current costs of funds, the type of asset and its liquidity, whether the asset is likely to be accepted as collateral for debt-financing purposes, whether it is a special-purpose asset or has a broader use, and discussions with asset-based lenders on current trends. In general, higher liquidity of an asset leads to increased marketability and greater acceptance as collateral, and less equity is required to finance the asset. Therefore, a more highly liquid asset will have a lower required rate of return.”
Ultimately, Gordon Brothers selected a discount rate of 18.6% for use in the relief from royalty method. We are not aware of any further communication from the Division, so presumably the additional detailed response was sufficient.
On December 31, 2020, NeuroBo Pharmaceuticals (“NeuroBo”) acquired ANA Therapeutics, Inc. (“ANA”). The ultimate purchase consideration included contingent consideration related to the achievement of certain milestone events. The Division reviewed NeuroBo’s Amendment No. 1 to Preliminary Proxy Statement on Schedule 14A, filed March 2, 2021, stating: (Click here to see full comments and responses)
“We note your disclosure on page 6 that your preliminary estimate of the fair value of the contingent consideration was approximately $4.76 million. We also note from your response that you determined that the likelihood of payment of the contingent consideration was remote and that you have excluded the contingent consideration from total purchase consideration in your analysis. Please describe to us how the fair value was determined, including how the likelihood of payment factored into the determined fair value.”
NeuroBo’s legal counsel responded as follows:
“In response to the Staff’s comment, we note that the third-party valuation was subsequently revised on April 1, 2021. The original valuation, commissioned in order to satisfy Section 3.6 of the Merger Agreement for purposes of ensuring compliance with the requirements for the tax-free nature of the exchange, valued only the contingent consideration that could potentially be triggered by the Milestone Payments. The valuation was subsequently revised in part to fully include the potential royalty payments to the ANA Equityholders as well as potential royalty payments pursuant to the YourChoice Therapeutics, Inc. License Agreement that was assumed in connection with the ANA Acquisition, which, as disclosed in the Company’s Form 8-K/A filed with the Commission on March 1, 2021, includes certain potential single-digit royalty payments and milestone payments in the aggregate amount of $19.5 million. As a result, the final fair value of the contingent consideration was ultimately estimated at $18.3 million. We have revised page 10 of Amendment No. 2 accordingly.
…The fair value of the contingent consideration in the third-party valuation was arrived at as follows:
This methodology resulted in a single-step contingent consideration value of $5.07 million, with a mean sensitivity analysis value of $18.3 million.”
Contingent consideration, also referred to as an earnout, is often valued using Monte Carlo Simulation as referred to in the response. Although other methods are acceptable, Monte Carlo Simulation is one of the most common, if not the most common, method. While not disclosed in the Company’s response, a Monte Carlo Simulation will typically consist of 100,000 or more trials based on certain parameters under which an event is likely to occur (in this case, the milestone events referred to above). The $18.3 million fair value conclusion is likely to be the average indication based on a similar number of trials.
Navios Maritime Acquisition Corporation (“Navios Acquisition”) merged with Navios Maritime Midstream Partners L.P. (“Navios Midstream”) on December 13, 2018, acquiring all of the outstanding publicly held common units of Navios Midstream. The Division reviewed Navios Acquisition’s Form 20-F for the Fiscal Year Ended December 31, 2018, stating: (Click here to see full comments and responses)
“We note that in accounting for the acquisition of the remaining interest of Navios Midstream, you recorded a bargain purchase gain. Please tell us and revise to disclose the reasons why the transaction resulted in a gain.”
Navios Acquisition’s legal counsel responded as follows:
“The amounts included in this response are expressed in thousands of U.S. Dollars in order to conform with the disclosures contained in Note 3 of Navios Acquisition’s Form 20-F. The excess of the fair value of the identifiable net assets acquired of $123,450 over the total purchase price consideration of $54,499, resulted in a bargain purchase gain in the amount of $68,951. During 2018, the publicly traded stock prices of US listed shipping companies were trading at discounts to their net asset value (“NAV”). This trading discount to NAV resulted in the recognition of a bargain purchase gain for Navios Acquisition. The purchase price and the number of shares to be issued at the closing of the acquisition was proposed in June 2018 by using a conversion rate of 0.42 of a Navios Acquisition share to one common unit of Navios Maritime Midstream Partners L.P. (“Navios Midstream”), which was based on the market share prices in June 2018, plus an implied 1% premium. The definitive agreement that validated the proposed conversion rate was signed in October 2018 between Navios Acquisition and Navios Midstream. The proposed conversion rate was accepted with no adjustments. Between the proposal date, the date of the signing of the definitive agreement and the date of closing, there was no adjustment made to the number of shares to be issued by Navios Acquisition for movement in the share price or the price of the net assets to be acquired.”
A bargain purchase may occur when the seller is motivated to sell quickly, and therefore, may not execute a formal competitive bid process or does not engage actively in negotiating with the purchaser. The parties in this example are related and may not have engaged in a typical arms-length transaction, resulting in a bargain purchase. Furthermore, the length of time between price negotiation and closing a transaction can lead to situations where the fair value of assets acquired exceeds purchase consideration. In our experience, bargain purchases are infrequent, so reviewers such as external auditors (and the SEC) expect a compelling rationale for why such gains are supportable.
As evidenced by the questions discussed above, the SEC is certainly paying attention to business combinations disclosures. This has always been the case for public entities. But even for private companies that aspire to become public one day or desire to prepare quality audited financial statements, the need for supportable and defensible fair value measurements is crucial. Our hope is that the questions and responses highlighted above will better prepare you for the level of scrutiny that often accompanies the accounting for business combinations – and may help you avoid being on the receiving end of these types of comment letters.
Mercer Capital has been helping public and private companies with valuation services around business combinations for decades. Please contact one of our professionals today with any questions or to discuss your needs in confidence.
Special thanks to J. Davis Rolfe, Jr., CPA and Kate Mabry for their contributions to this article.
It’s always fun to escape the dreary, late January weather and head to sunny, warm Phoenix to catch up with and learn from my peers at Bank Director’s Acquire or Be Acquired Conference (“AOBA”). This year the wintry weather back home resulted in a flight cancellation, allowed for an extra day of sunshine, and illustrated that most things have a silver lining if you can find it.
The 2023 version of AOBA felt bigger than ever, and it was good to see that conferences and large gatherings of industry peers can still thrive after the impacts of the pandemic. Below, I note a few themes from the conference and the sessions that I attended. For those who haven’t been to AOBA before, it is a two-and-a-half-day conference that has broadened its M&A offerings over the years to focus on a combination of M&A, growth, and FinTech strategies.
These themes stuck with me the most from the 2023 iteration.
We noted in a previous article that the 2023 deal-making outlook was challenged by the potential for heightened interest rate marks (i.e., unrealized losses in fixed-rate assets) and credit marks amidst a combination of a higher rate environment and a softening economic climate and real estate values. This theme was certainly present on the AOBA agenda as several sessions discussed the impact of unrealized bond losses as reflected in the AOCI (accumulated other comprehensive income) on banks’ balance sheets. But it also showed up in discussions of how asset sensitive vs. liability-sensitive banks will perform, the need for heightened due diligence on credit risk, and how these themes can impact capital planning, equity valuations, and M&A.
While the balance sheet theme was more prominent at the 2023 AOBA, this link between bank balance sheets, earnings, and ultimately valuation is not an entirely new phenomenon. It reminded me of one of my early bank readings as a younger analyst and how the text illustrated that banks’ balance sheets tend to drive earnings. It noted how this is a unique trait compared to companies in other industries, whose balance sheets have less of an impact on generating cash flow.
Consistent with discussions around the balance sheets, rising interest rates, and the impact on the banking industry, deposits came up time and time again in sessions. These discussions covered strategies to retain business or consumer deposits, the attractiveness of core deposits for acquirers in the current environment, how to grow deposits organically, how to acquire deposits and pay premiums, rising core deposit intangible valuations, and how to provide your customers with the technology and digital banking solutions to onboard and retain deposits more efficiently. 1
We have previously discussed banks’ potential to leverage FinTech to create value and enhance profitability and efficiency. This theme seems to grow each year at AOBA as we see more sessions on structuring and performing due diligence on FinTech partnerships. I’ve also noticed an increased interest in topics like BaaS (Banking as a Service) opportunities, digital tools from different FinTechs, and case studies on how banks have developed digital strategies or partnered with FinTechs to compete and expand in the current environment. Additionally, the number of FinTech companies attending and presenting at AOBA continues to increase.
Opportunities were plentiful for those bankers interested in a demo or introduction to some of FinTech’s offerings. In my view, one emerging theme stood out a bit more from the rest: banks developing deeper partnerships with FinTechs and eventually investing with them as partners. We have noted how valuation issues and key performance indicators (KPIs) for FinTech companies and tech-forward banks can differ from traditional bank valuation methods and KPIs. I think it will be interesting to watch this trend going forward.
While we noted the turbulence and potential headwinds for bank M&A in 2023, this could present an opportunity for some acquirers with a more long-term perspective. Traditional growth acceleration and inorganic scale strategies such as M&A were still prominent themes in many sessions, as they focused on the nuts and bolts of conventional bank M&A, valuation, due diligence, structuring, and integration. While certain themes change and evolve, the strategy to achieve greater scale and growth through M&A, and to enhance efficiency and profitability that create value over the long run, still persists.
We look forward to discussing these issues with clients in 2023 and monitoring how they evolve within the banking industry over the next year. As always, Mercer Capital is available to discuss these trends as they relate to your financial institution, so feel free to call or email.
As participants and observers in transactions, the pending acquisition of Spirit Airlines, Inc. (NYSE: SAVE) by JetBlue Airways Corporation (NASDAQGS: JBLU) offers a lot of fodder for us to comment on. In this post, we look at the fairness opinions delivered by Morgan Stanley and Barclays to the Spirit board before approving the deal and then ask a key transaction-related question.
On July 28, 2022, Spirit agreed to be acquired by JetBlue for cash consideration of $33.50 per share, or $3.8 billion. Inclusive of net debt, the transaction at announcement had an enterprise value of $7.6 billion. Deal multiples included 25.5x analysts’ consensus EPS for the next 12 months and 12.3x NTM EBITDA.
The deal value excluding ticking payments that could push the total consideration to $34.15 per share, represented a 38% premium to Spirit’s closing price on July 27 of $24.30 per share; however, the announcement was not a surprise because Spirit had been in play since February 5 when the company agreed to be acquired by Frontier Group Holding, Inc. (NASDAQGS: ULCC) for 1.93 Frontier shares and $2.13 per share of cash, which was then valued at $25.83 per share.
JetBlue subsequently made an unsolicited cash offer on March 29 (disclosed on April 5) of $33.00 per share that was rejected on May 2. JetBlue then commenced a $30.00 per share tender on May 16, noting the price was less than the $33.00 per share offer because of the board’s “unwillingness to negotiate in good faith with us.”
Ultimately, the Frontier deal was terminated on July 27, and Spirit then entered into an agreement with JetBlue that provided for the following:
The proxy statement dated September 12 enumerated the reasons the Spirit board approved the merger agreement, including the fairness opinions that opined the consideration to be received by shareholders was fair from a financial point of view to the shareholders. Interestingly, both banks were retained by Spirit in late 2019 to assist in a review of strategic options that was interrupted by COVID.
A fairness opinion provides an analysis of the financial aspects of a proposed transaction from the point of view of one or more parties to the transaction, usually expressing an opinion about the consideration though sometimes the transaction itself. Ideally, the opinion is provided by an independent advisor that does not stand to receive a success fee, especially when the transaction is a close call or involves real or perceived conflicts. In the case of the JetBlue-Spirit transaction, both Spirit advisors will receive much larger contingent fees if the transaction is consummated compared to the fixed fee fairness opinions.[1]
Let’s look at a high-level comparison of each bank’s analysis, some of which were explicitly included in the fairness analyses and some of which were presented for reference only. (A link to the proxy statement can be found here.)
Barclays and Morgan Stanley reviewed and compared specific financial and operating data relating to Spirit with selected GPCs deemed comparable to Spirit. The following table compares the selected GPCs, the then-current multiples, the relevant multiple range, and indicated range of value for Spirit as calculated by each bank.
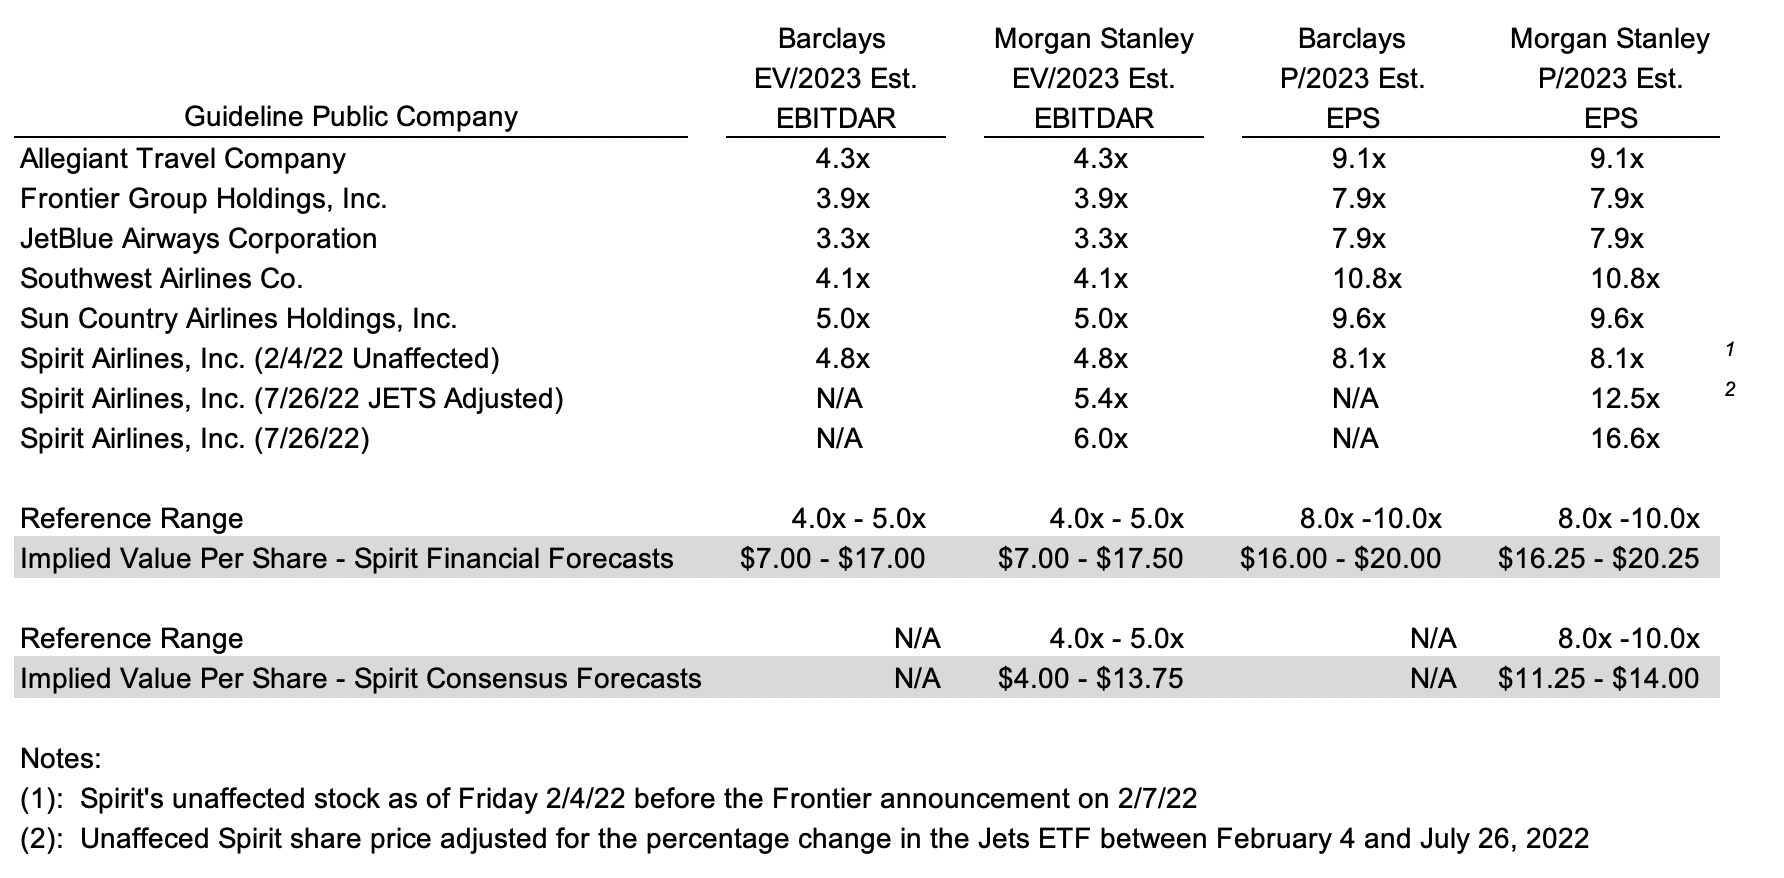
Click here to expand the image above
Both banks relied upon management’s forecast for net income and EBITDAR; however, Morgan Stanley also considered the Street’s consensus forecast for 2023. Spirit is included in the comp group to develop the applicable multiples with both banks relying upon pricing in early February immediately before the Frontier deal was announced; however, Morgan Stanley included alternate multiples based upon Spirit’s price as of July 26 and as of July 26 based upon the change in the industry ETF (JETS) from February 4. Nonetheless, the indicated values each developed based upon management’s forecast were the same.
The opinions did not include guideline transactions, presumably because there is limited M&A data involving U.S. carriers. The most recent significant acquisitions include Northwest Airlines and Continental Airlines in 2008, AirTran Holdings in 2010, and Virgin America in 2016. Nonetheless, we find it odd that a GT analysis was not addressed in the proxy.
Both banks included a DCF analysis, a valuation method that is standard in virtually all valuation analyses. The gist of the analysis reflects the discounting of unlevered cash flows over a discrete period (2H22-2026) and the projected debt-free value of the company at the end of the projection period to present values based upon the weighted average cost of capital. Net debt is then subtracted to derive the indicated equity value.
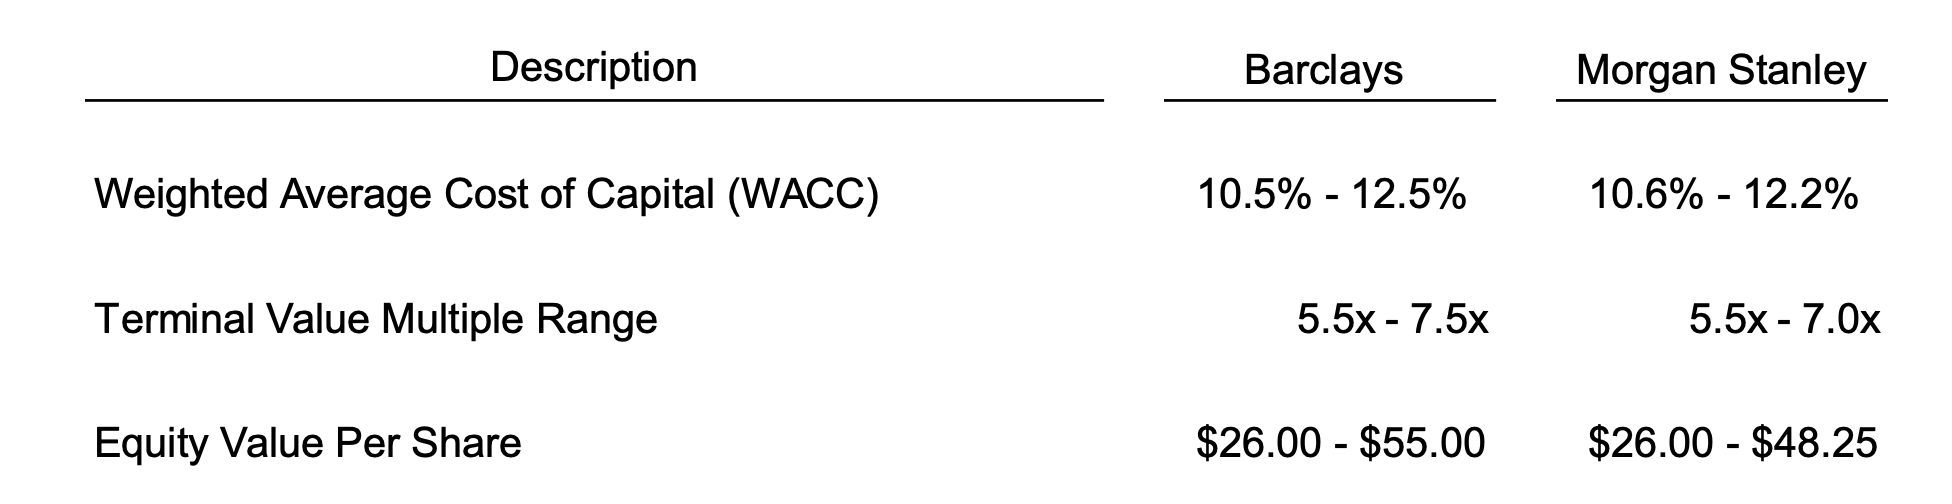
Morgan Stanley but not Barclays derived indicated ranges of value per share by discounting management’s forecasted 2025 EBITDAR and EPS to present values based upon a 12.9% equity discount rate. If Spirit paid common dividends, the present value of the dividends through 2025 presumably would have been included, too. The analysis is similar to the DCF method except that cash flows are viewed from the perspective of what is received by shareholders compared to enterprise-level cash flows in the DCF analysis. Morgan Stanley derived a range of $24 to $43 per share based upon 5.0x to 6.5x EBITDAR and $39 to $47 per share based upon 9.0x to 11.0x forecasted 2025 EPS.
Both banks reviewed the 52-week trading history for Spirit for the period ended July 26, 2022 ($16-$29 per share) and in the case of Morgan Stanley for the 52 week period ended February 4, 2022 ($20-$40 per share). Although seemingly an important consideration for the fairness analyses, neither bank’s proxy write-up discussed the deal price premium relative to Spirit’s recent trading on a stand-alone basis or compared to M&A involving publicly traded midcap companies. The proxy did note that the board considered the premium in approving the merger agreement, however.
Both banks reviewed sell-side analysts’ one-year price targets ($24-$36 per share). Morgan Stanley discounted the price targets to a present value range of $21 to $32 per share using a discount rate of 12.9%, though the analysis was presented only for reference.
Both banks opined that, from a financial point of view, the consideration to be received by the stockholders of Spirit in the proposed transaction is fair to such stockholders. As can be seen in the graph below, the $33.50 share price falls within the range of values determined by both banks and decidedly above trading-based indications of value vs management’s forecast as reflected in the DCF valuations.
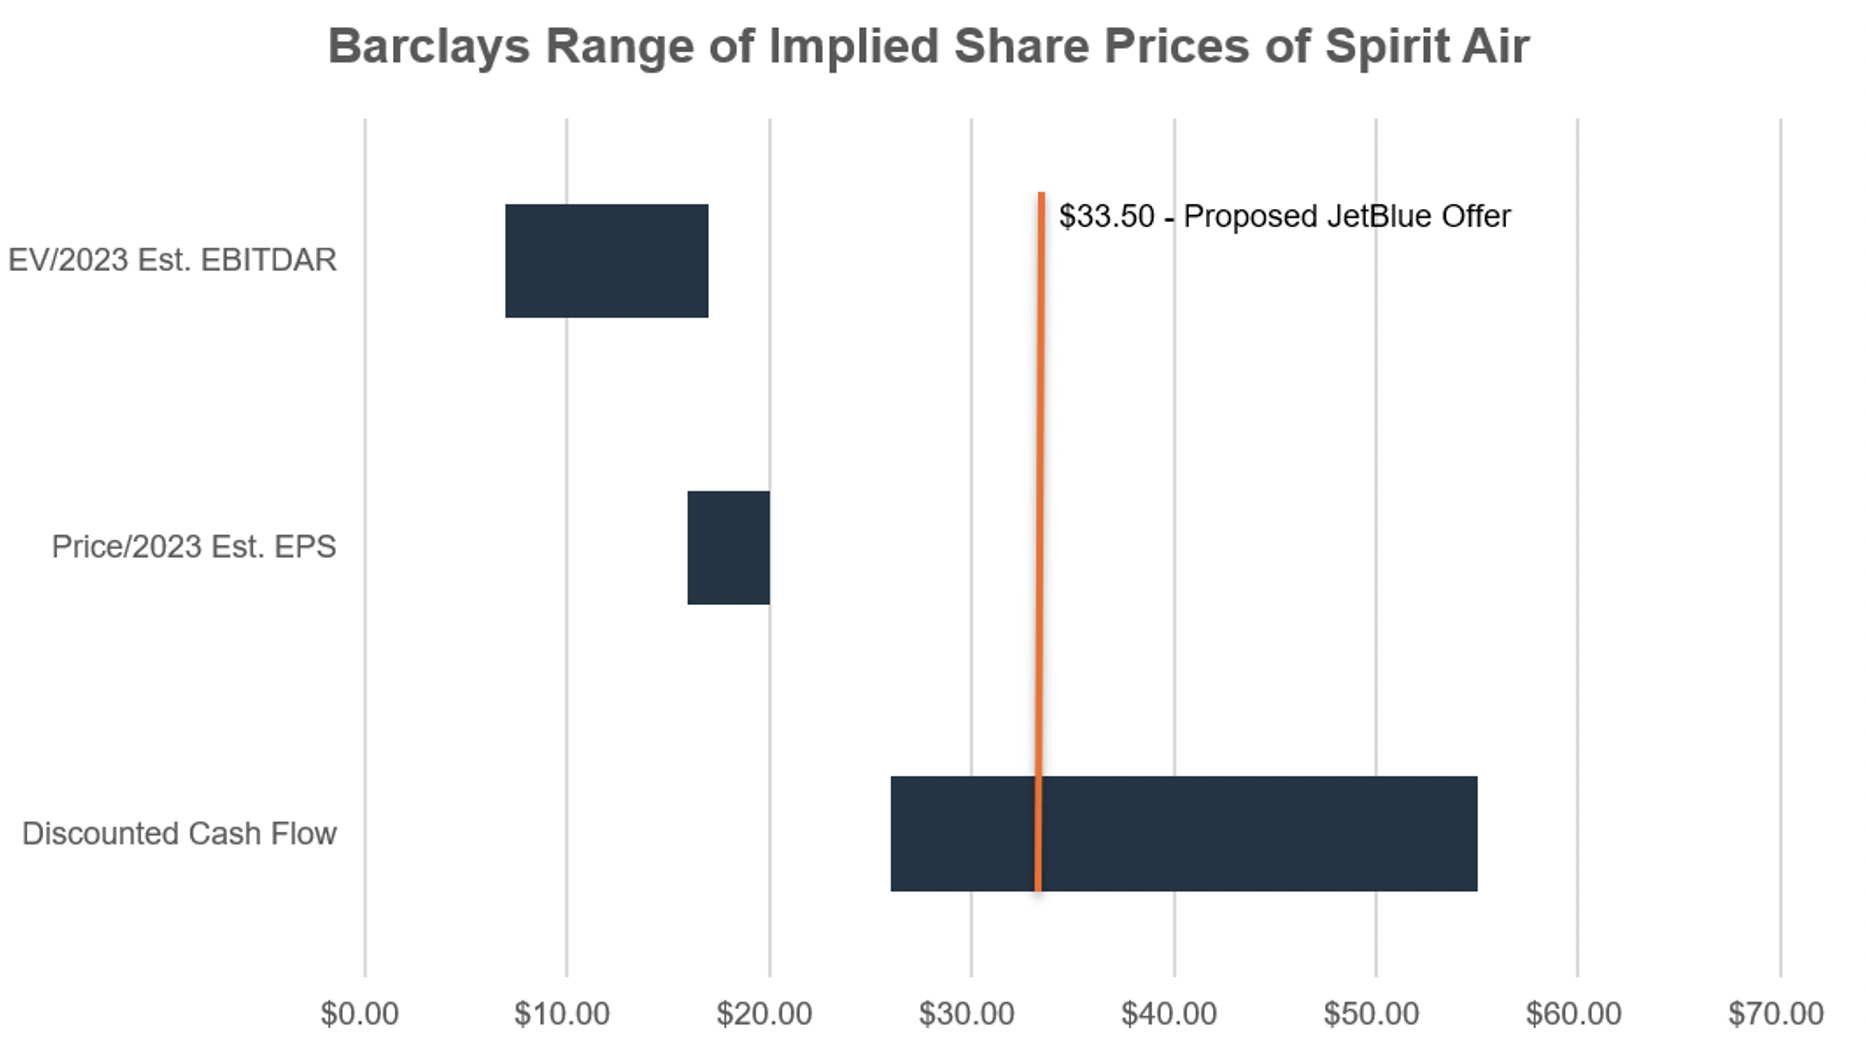
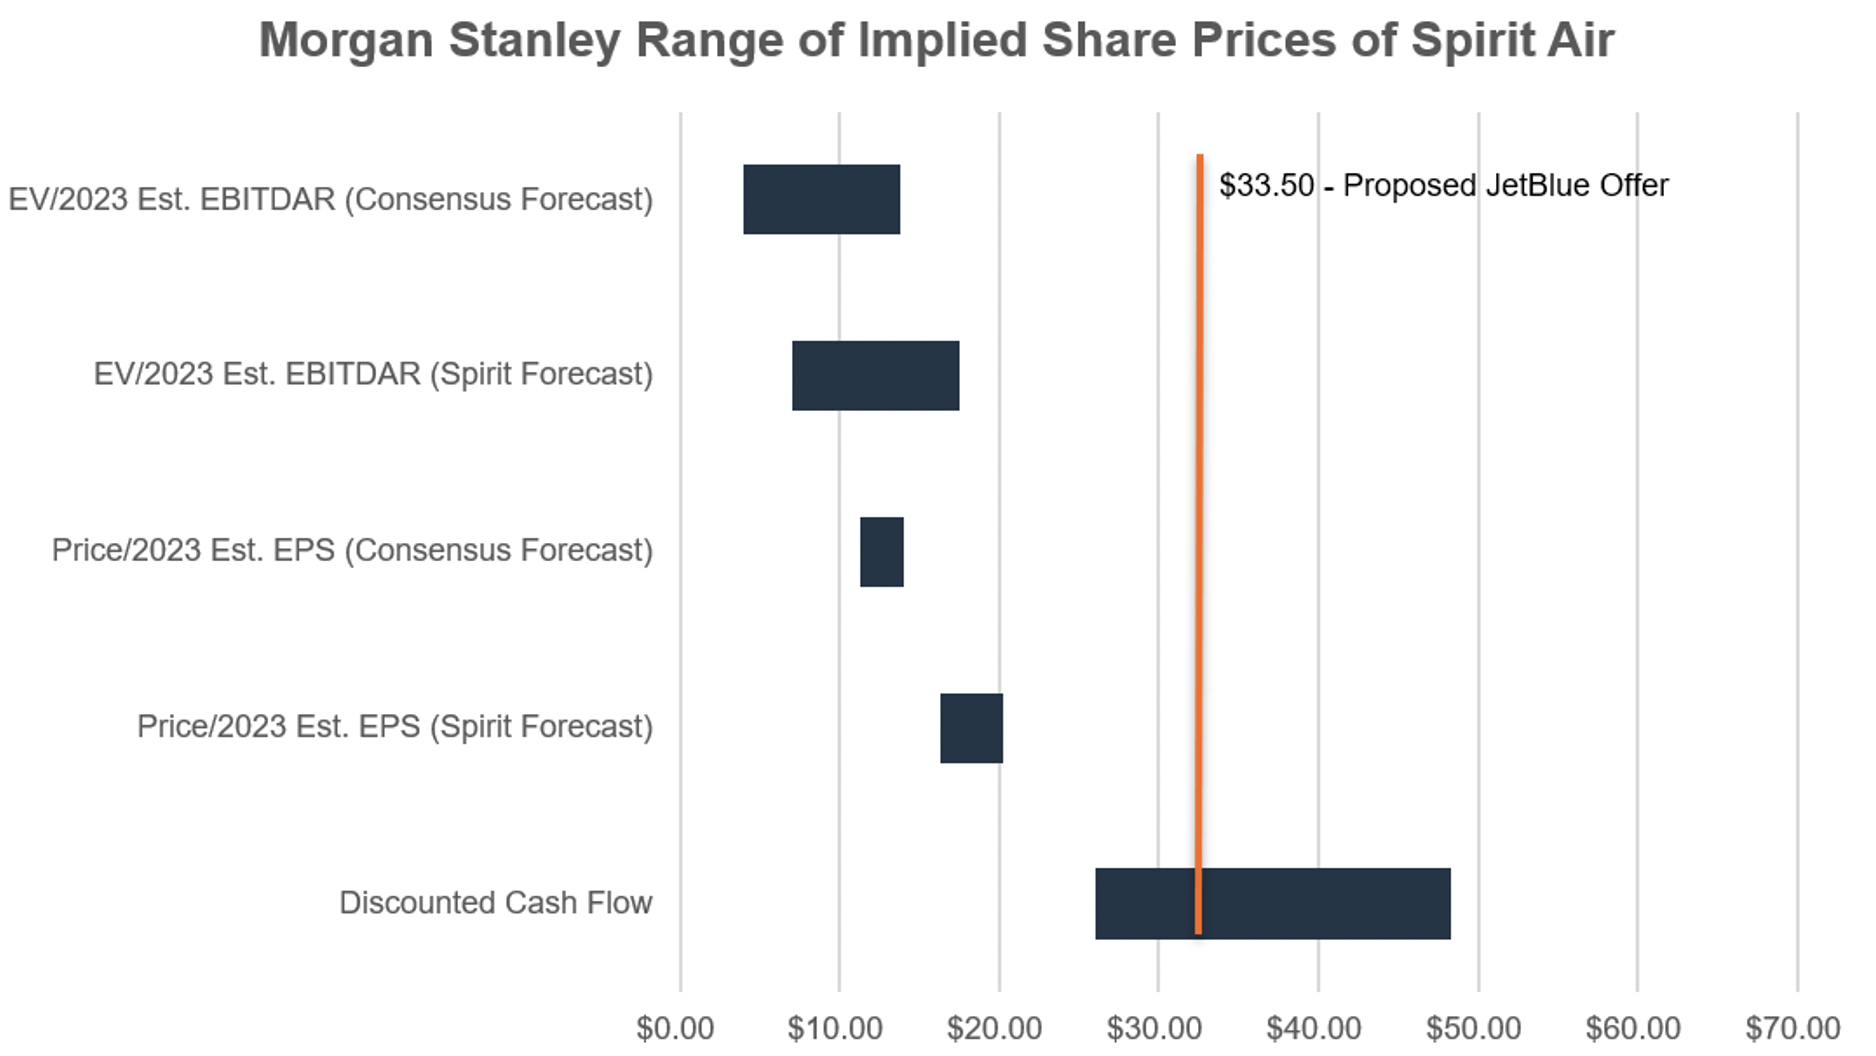
Given the price and terms of the JetBlue deal, rendering the fairness opinions appears to have been a straightforward exercise; however, one deal point a board must always consider is the ability of a buyer to close. This begs the question: Can JetBlue close the deal?
The market’s answer to the question is “no” given the deep discount Spirit trades to the acquisition price net of the approval payment. The deep discount reflects the growing likelihood that the U.S. Department of Justice will sue to block the deal because it would eliminate another low-cost carrier and position JetBlue-Spirit as the USA’s fifth-largest airline behind American Airlines, Delta Air Lines, Southwest Airlines, and United Airlines.
Among the factors the board considered that weighed against approving the deal was the risk that regulators would block the deal. These concerns were voiced by Frontier and some investors when JetBlue made its unsolicited offer nearly a year ago, but the board approved the transaction nonetheless, perhaps figuring JetBlue offered downside payments and that Frontier would still be an option if Washington nixed the JetBlue transaction.
And for what it is worth, the terminated Frontier deal would be valued around $23 per share, with its shares trading near $11 per share as of February 21.

Click here to expand the image above

Timothy R. Lee, ASA is the firm’s Managing Director of Corporate Valuation services and is a member of the firm’s board of directors. He provides litigation support services in cases involving economic damages, business valuation, dissenting shareholder rights, marital dissolution, and tax matters. Tim also provides valuation and corporate advisory services for purposes including mergers and acquisitions, employee stock ownership plans, profit sharing plans, trust & estate planning and compliance matters, corporate planning, and reorganizations.
Timothy Lee: As a “late” starter in financial services, I sought a path that would leverage years of practical experience gained from real world selling and managing in my teens and 20s. Business valuation has exposed me to a great diversity of business models and allowed me to learn from the successes and challenges of our clients.
Over the years, the core valuation discipline bridged into a multi-line financial advisory practice that places me in a position to assist clients facing both difficult and opportunistic events in the lifecycle of business ownership. For me, the bet on valuation and the fortitude of nearly 30 years of financial and industry breadth has placed me and my Mercer Capital colleagues in the enviable position of offering services with uncompromising credibility and with broad ranging experience well beyond a pure-play valuation shop.
Timothy Lee: Mercer Capital offers services across three broadly defined groupings: 1) valuation for tax, financial reporting, and other compliance and corporate finance purposes, 2) dispute resolution services ranging from unmatched buy-sell functionality to expert witness services for corporate and personal litigation matters, and 3) buy- and sell-side transaction advisory services primarily covering the middle-market M&A space and including large business concerns in numerous financial and non-financial industry verticals.
My personal practice has become more focused on the diverse needs of larger private companies whose regular needs require all three service buckets in real time and where reconciling these needs is essential for ownership success and strategic execution. Organizationally and personally, we are focused on the forest of client needs, which over time have become more business and industry centered while maintaining our legacy leadership in business valuation services.
Timothy Lee: Mercer Capital has worked diligently to parlay Chris Mercer’s longstanding success in significant litigation matters into a diverse dispute resolution practice with growing depth regarding industry coverage, legal setting, and dispute scenario. Today, we have several litigation-focused senior professionals who handle everything from business-heavy marital dissolution to corporate damages and fair value matters across the country.
Like most senior professionals at Mercer Capital, my litigation involvements are generally allied to certain industries and/or are related to certain dispute scenarios. For me, industry depth is broad ranging and particularly deep in numerous areas: construction contracting, trades, and building materials; food & beverage ranging from multi-unit franchise models to alcoholic beverage distribution; equipment dealership industries including earth-moving, agricultural, and material handling networks; manufacturing industries in metal fabrication and processing; vertically integrated agricultural concerns; real estate, hospitality, and hotels; specialty chemicals; professional practices; warehousing and merchant wholesale distribution models; transportation and logistics. I also have significant experience assisting clients in buy-sell design and dispute matters offering a functional path toward collaborative resolution.
Timothy Lee: Valuation perspective and financial market comprehension are lacking among a great many business owners, boards, and management teams. Relegating valuations to critical (often stressful) events as opposed to maintaining a programmatic discipline is very much like the saying: failing to prepare is preparing to fail. Self-serving as it may sound, I see basic business valuation as an elemental and regular need of business owners.
Businesses have employees dedicated to daily cash management, inventory control, and capital investment; but owners and boards rarely seek the all-important measurement of business value. Harsh as it sounds – that is preparation to fail and an abdication of wealth accountability. Understanding business value and how it changes in response to industry, market, and organic forces is what we help business owners understand. That is the essence of the service we provide.
Timothy Lee: Well, if I am limited to just one thing, I’d have to say the excitement is one of living up to the incredible trust and responsibility of informing clients with meaningful and actionable financial information. The derivatives (now I’m cheating) of that one thing are the countless benefits I get from interacting with clients and colleagues to do meaningful work.
We recall discussions in early 2022 with clients regarding their outlook for 2022 – three 25 basis point Fed rate increases, a “more normal” operating environment following the pandemic afflicted 2020 and 2021, and stable credit quality. The latter of those three items held true, but 2022 was anything but normal. Instead of three 25 basis point rate increases, the Fed delivered seven totaling 425 basis points. The bull market was routed for both equities and, most exceptionally, bonds.
Given this backdrop, publicly-traded banks did comparatively well. The median stock price change among the 343 banks and thrifts traded on the NASDAQ and NYSE was negative 9% in 2022, relative to negative 19% for the S&P 500 and negative 33% for the NASDAQ. Further, there was more dispersion in performance during 2022.
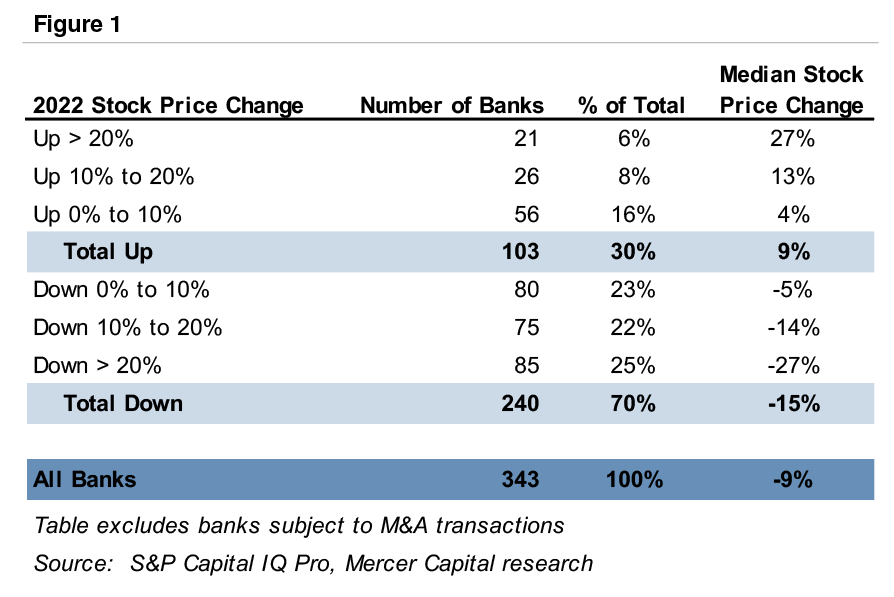
In 2020, only 13% of publicly-traded banks reported a rising stock price during the year, whereas in 2021 only 5% of banks reported a falling stock price from year-end 2020 to 2021. That is, banks generally moved in tandem—down in 2020 and up in 2021. While not evenly balanced, 30% of banks reported a positive year-over-year stock price change in 2022 (see Figure 1). We believe this positive performance for quite a few banks in 2022 was masked by the downbeat market sentiment and warrants further investigation.
Figure 2 distinguishes shares price changes in 2022 by asset size range. The largest banks, with assets exceeding $100 billion, performed the worst in 2022, with no banks reporting share price appreciation and a median stock price decline of 22%. Smaller banks performed better, led by banks with assets between $1 and $5 billion. This stratum reported a median share price decline of only 5%, with 38% of the banks experiencing positive share price appreciation in 2022.
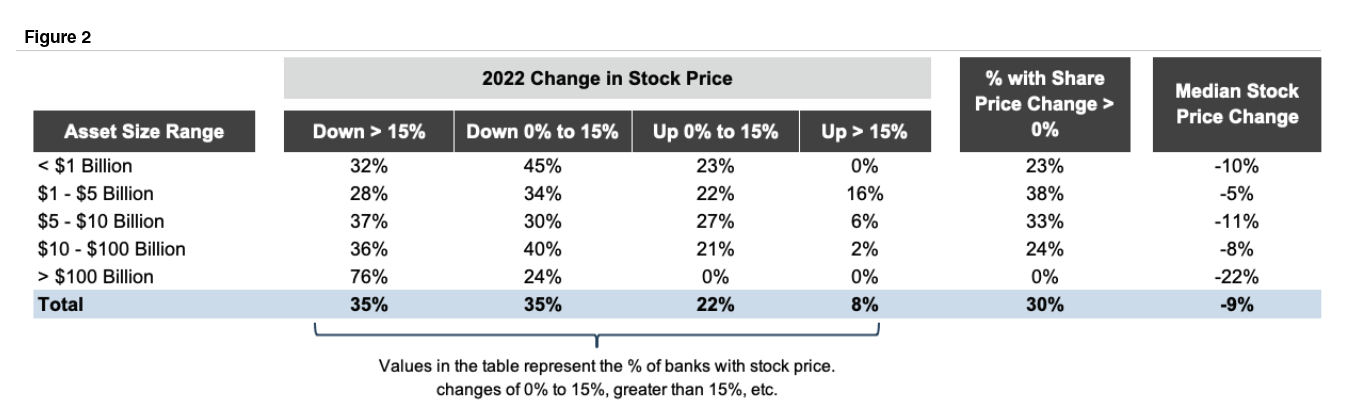
Click here to expand the image above
While market performance remains a function of the market’s ever evolving view of a particular bank’s earning power, growth outlook, and risk attributes, we explore in this article some of the factors influencing the better and weaker performing banks in 2022.
One of the best predictors of share price appreciation in 2022 was, in fact, performance from year-end 2019 to year-end 2021. As indicated in Figure 3, banks with the strongest price appreciation during 2020 and 2021 performed the worst in 2022, while those banks that most lagged the market in 2020 and 2021 outperformed in 2022.
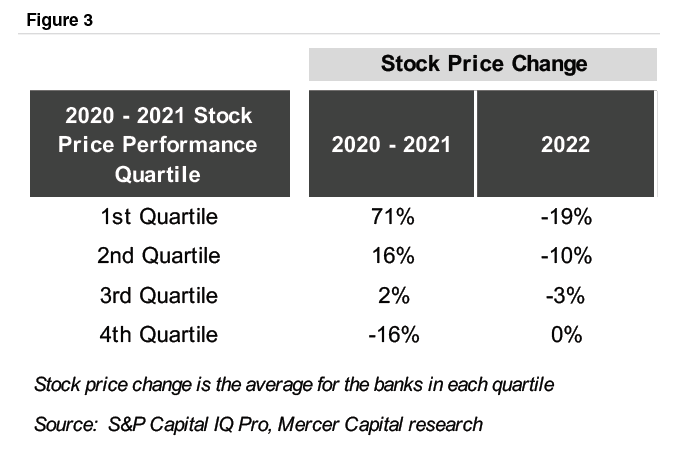
Some of the market leaders in 2020 and 2021 crashed out of favor in 2022, such as those embracing crypto or positioning themselves as technology leaders rather than stodgy, traditional banks. Figure 4 presents the ten banks with the largest negative returns in 2022.
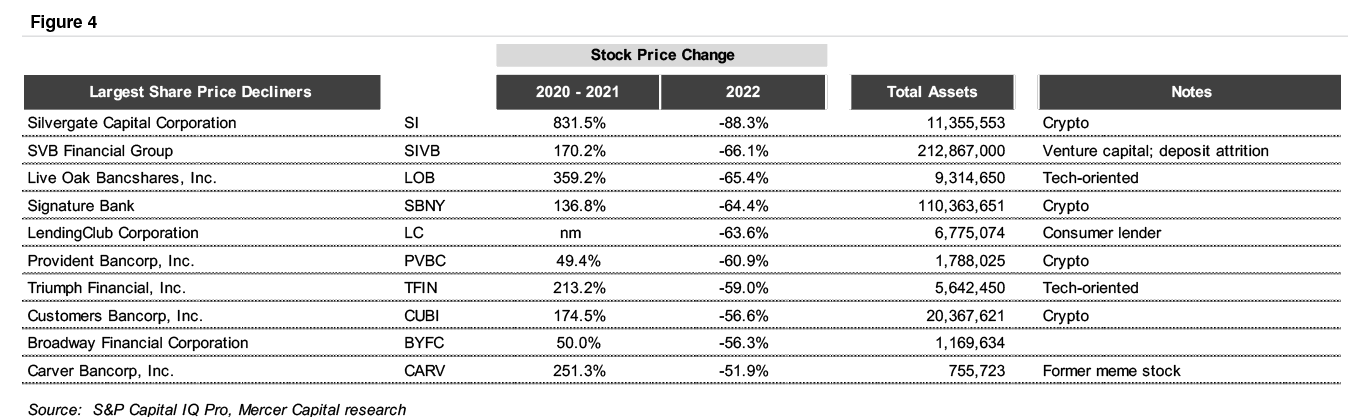
Click here to expand the image above
The most common question we received over the last twelve months was, “what is the effect of the unrealized securities portfolio loss on share value?” While there are possibly extenuating circumstances for some banks (see, e.g., Silvergate Capital Corp. in Figure 4), our general guidance is that the market emphasizes forward-looking earning power, not the magnitude of the unrealized loss.
Figure 5 correlates stock performance in 2022 with the magnitude of the unrealized securities portfolio loss.1 For example, banks in the first quartile had a median unrealized loss of 5% of equity.2 These banks experienced a median stock price change of negative 6%. Meanwhile, banks with the largest unrealized losses—ranging from 29% to 111% of tangible equity—reported a median stock price change of negative 5%. A more robust statistical analysis indicates a similar result; that is, virtually no relationship between the size of a bank’s unrealized securities portfolio loss and market performance in 2022.
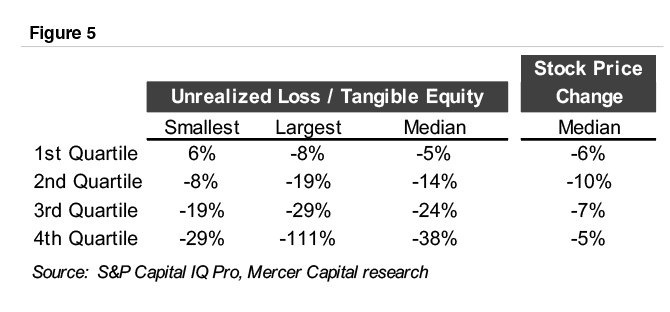
Our view is that the unrealized loss on securities should be evaluated in the context of the entire balance sheet. We would be more concerned, from a valuation standpoint, when a large unrealized loss is coupled with a heavier exposure to fixed rate loans, particularly if the bank is facing pressure on deposit rates.
As we found out in 2022, some core deposits are more core than others. One of the strongest determinants of stock price performance in 2022 was the change in the cost of funds. We evaluated the change in the cost of funds from the first through the third quarters of 2022.3 As indicated in Figure 6, banks in the first quartile reported a median increase in the cost of funds of two basis points, whereas banks in the fourth quartile reported a median increase of 48 basis points. Further, banks in the first quartile reported a median stock price change of positive 5% in 2022, versus negative 16% for the fourth quartile banks.
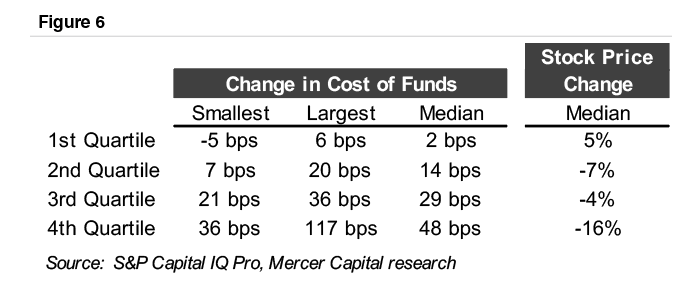
An analysis of net interest margin expansion between the first and third quarters of 2022 shows a similar result. Banks in the first quartile reported a median change in NIM of six basis points and a stock price change of negative 18%, while banks in the quartile with the most NIM expansion—82 basis points for the median fourth quartile bank—eked out a 1% positive share price appreciation.
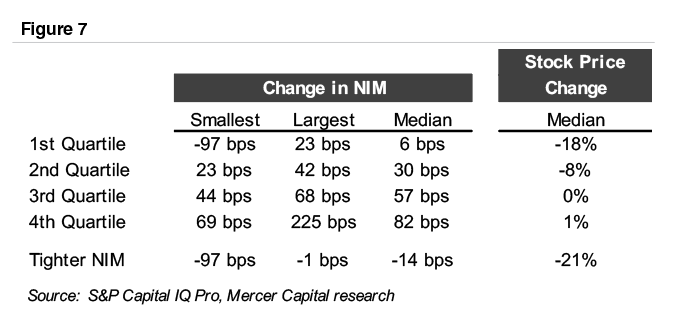
The preceding analysis masks the market’s concern for banks with tightening NIMs, however. Among the 205 banks in our analysis, eighteen reported NIM compression between the first and third quarters of 2022. These banks underperformed, with sixteen of the eighteen reporting lower stock prices in 2022 and a median stock price decline of 21%. This indicates the market’s sensitivity to NIM compression, which will be an issue for more banks in 2023 as rising deposit rates bite.
From publicly-available disclosures, it is difficult to discern the sensitivity of a bank’s assets, including both loans and securities, to rising rates. In the recent zero rate environment, pressure existed to invest in anything but short-term liquid assets. Therefore, we evaluated whether balance sheet composition could explain market performance in 2022. We could find no discernable relationship between loan/deposit ratios and market performance in 2022. However, while the evidence is somewhat weak, banks with the largest exposures to short-term liquid assets performed better in 2022.4
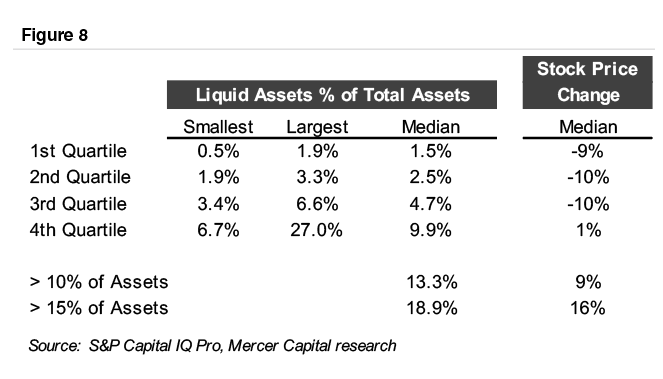
Figure 8 shows short-term liquid assets as a percentage of total assets. Most banks operate with short-term liquid assets in a relatively tight range (under 5% of total assets); thus, limited correlation is evident between exposure to short-term liquid assets and performance. However, a more positive relationship begins to emerge in the tail of the distribution. Banks in the fourth quartile reported liquid assets of 9.9% and a positive 1% stock price change. Narrowing the fourth quartile banks to those with liquid assets exceeding 10% or 15% of total assets results in stronger share price changes of positive 9% and 16%, respectively.
As in 2022, no doubt some newfound concerns will emerge in 2023 to drive bank stock performance. We suspect that funding cost pressure will remain an overarching concern in 2023, with true core deposits proving their value in a way not evident for years. Loan repricing will be interesting to watch. With many Prime, LIBOR, and SOFR-based floating rate loans having already repriced, further expansion in asset yields will depend on the contractual repricing periods for existing adjustable rate loans and, for newly originated loans, the “rate beta” between origination rates and broad market rates. After a long period of near nil credit losses, it would not be surprising to see some upward pressure on credit losses, although this seems likely to remain episodic in 2023. Some banks with heavier exposure to consumer loans underperformed in 2022, and it will be interesting to watch if weaknesses emerge in any segments of banks’ commercial loan portfolios in 2023.