Pioneer Natural Resources Pay to Play
A Tale of Two Transactions


As noted in our June 2021 blog post covering Permian M&A activity, M&A transactions picked up in the twelve months ended mid-June relative to the twelve-month period preceding it. Perhaps more importantly, there seemed to be an inflection point in transaction multiples that hinged around the U.S. elections in November 2020.
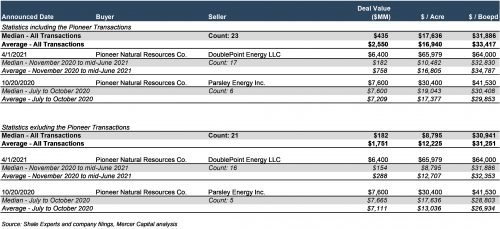
Among all the transactions that occurred over this period, one pair jumped out involving a common buyer and for which valuation metrics were available. These related to Pioneer’s acquisition of Parsley Energy in October 2020 and DoublePoint Energy in April 2021, with implied transaction metrics well above the average and median values in the the respective sub-periods of the reviewed period. Statistics of the valuation metrics for the transactions occurring between mid-June 2020 to mid-June 2021 and the bifurcated sub-periods, both including and excluding Pioneer transaction data, are as follows:
Click Here to Enlarge the Image
We note that, as compared to the transactions table in the aforementioned Permian M&A activity blog post, the transaction counts and statistics presented exclude four transactions for which acquired assets were working interests, as opposed to a property or corporate acquisition. We also note that only one of the four excluded transactions involving the acquisition of a working interest had any useful transaction data available, and the metrics for this one transaction tended to be outliers (on the high side) in the context of the full set of transactions.
Tech talk aside, the main point here is Pioneer consistently paid top dollar for its acquisitions from the perspective of the transactions’ valuation metrics. Why?
Easy Answer: Pioneer Is a Large Strategic Buyer
In Pioneer’s October 2020 press release covering its acquisition of Parsley Energy and April press release for its acquisition of DoublePoint Energy, the strategic nature of the acquisitions was cited. Prominent in both releases was mention of significant synergies and “unmatched scale” with respect to Pioneer’s footprint in the Permian play.
Regarding the Parsley acquisition, Pioneer’s President and CEO, Scott D. Sheffield, stated, “This combination is expected to drive annual synergies of $325 million and to be accretive to cash flow per share, free cash flow per share, earnings per share and corporate returns beginning in the first year.…” It was further noted that, “The combined company will be the leading Permian independent exploration and production company with a premium asset base of approximately 930,000 net acres [representing an approximately 37% increase over its pre-transaction net acreage] with no federal acreage and a production base of 328 thousand barrels oil equivalent per day (“MBoepd”) and 558 MBoepd as of the second quarter of 2020. Additionally, based on year-end 2019 proved reserves, this transaction will increase Pioneer’s proved reserves by approximately 65%.”
Similarly, synergies were noted in the DoublePoint acquisition, including expectations annual cost savings over the next 10 years of $175 million, stemming from increased operational efficiencies and reduced G&A and interest expenses, with a total present value of savings of approximately $1 billion. This transaction also expanded Pioneer’s Permian footprint by an additional 97,000 net acres to over 1 million total net acres in its core Permian position. This addition implies an increase of 10% over its 930,000 total net acreage holdings following the Parsley Energy acquisition, and further fortifies the company’s position as a premier Permian E&P operator.
While the strategic argument makes sense fundamentally, arguably any transaction involving an existing E&P company entering or expanding their presence in the Permian could be deemed a “strategic” acquisition. Let’s dive a little deeper into the numbers behind Pioneer’s acquisitions to see if there may be another differentiating factor.
Deeper Answer: Production Density
In our analysis of Permian M&A activity over the past twelve months, we presented deal values and valuation metrics such as deal value per acre and per production (Boepd). As might be gleaned from those metrics, our data set included the net acreage and production values associated with the acquisitions, though these specific data points were not presented outright.
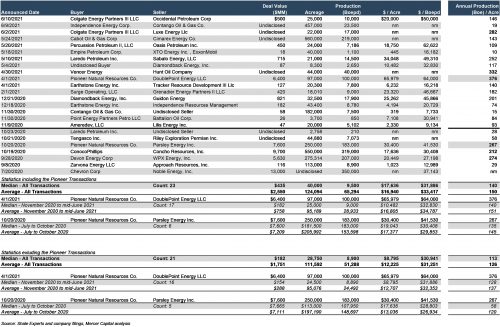
Utilizing the full set of data to examine the transactions, we developed and reviewed certain indicators beyond the presented valuation metrics. In particular, we calculated the implied annual production (total implied Boe) per acquired acre for each transaction. We’ll refer to this as “production density.” The following table presents the full data set which will be referenced:
Click Here to Enlarge the Image
Pioneer’s acquisition of Parsley Energy indicated a production density factor of 267 Boe/acre. Among the six transactions that occurred from July to October 2020, this was the second highest value, being only 7 Boe/acre lower than the highest indicated value implied by the Devon Energy-WPX Energy transaction. Conversely, this production density factor of 267 Boe/acre was 26% greater than the next highest factor of 212 Boe/acre implied in the ConocoPhillips acquisition of Concho Resources, which was announced the day prior to the Parsley acquisition announcement.
Among the transactions announced from November 2020 through mid-June of this year, the production density factor of the Pioneer-DoublePoint Energy acquisition was 376 Boe/acre, which was just over 13% higher than the production density of the next highest value of 332 Boe/acre implied by the Vencer Energy-Hunt Oil acquisition, and was the highest value among all the acquisitions in the Permian listed over the full 12-month period ended mid-June.
Conclusion
In our prior analysis of Permian M&A activity from mid-June 2020 to mid-June 2021, several points came to light:
- Transaction multiples appeared to have an inflection point, with significantly lower multiples indicated from the transactions announced after October 2020 relative to the indicated multiples for transactions announced prior to November 2020.
- Given the publicly available information, Pioneer was the only buyer in both sub-periods noted (for which useful transaction data was available).
- The transaction multiples stemming from the Pioneer acquisitions were among the highest, if not the highest, in the respective sub-periods, making them among the highest multiples for the entire 12-month period reviewed.
While commodity prices could have been a factor, we note that WTI futures as of April 2021 were, on average, 30% higher than WTI futures as of October 2020 when looking at a 12-month span consecutively for nine annual periods that followed the respective measurement dates. On one hand, this could be interpreted to mean that valuations should have been greater in the latter sub-period (with higher futures prices). On the other hand, the higher prices in the future might have been indicative of uncertainty regarding the Biden Administration’s rhetoric and possible actions that would more than likely prove to be headwinds to the oil and gas industry overall. Commodity prices notwithstanding, the data available and subsequent information gleaned from it suggest Pioneer was able to act on two prime opportunities that would further enhance the quality of its acreage and production portfolio.
We have assisted many clients with various valuation needs in the full stream of the oil and gas space for both conventional and unconventional plays in North America, and around the world. Contact a Mercer Capital professional to discuss your needs in confidence and learn more about how we can help you succeed.


