In the two short years since Aileen Lee introduced the term “unicorn” into the VC parlance, the number of such companies has steadily increased from the 39 identified by Lee’s team at Cowboy Ventures to nearly 150 (and growing weekly) by most current estimates. Pundits and analysts have offered a variety of explanations for the phenomenon, with some identifying unicorns as the sign that the tech bubble of the late 1990s has returned under a different guise, others attributing the existence of such companies to structural changes in how innovation is funded in the economy, and the most intrepid of the group suggesting that the previously undreamt valuations are fully supported by the underlying fundamentals given the maturity and ubiquity of the internet, smart phones, tablets, and related technologies.
We suspect there is merit to each of these perspectives. As valuation analysts, however, what sets our hearts atwitter is the very definition of “unicorn”, which is predicated on valuation. Since companies are christened unicorns upon closing a financing round, one would assume valuation to be self-evident. Alas, that is generally far from the case. Because of the common features of VC investments, the “headline” valuation numbers are not reliable measures of the market value of the underlying enterprises. As a result, the frequent breathless comparisons of the value of startup X to publicly traded stalwart Y are often overblown and potentially misleading.
Consider the following example. The capitalization of a hypothetical freshly-minted unicorn, BlueCo, is summarized in the following table:
With 200 million fully-diluted shares post issuance, the $5.00 per share Series E offering results in a headline valuation of $1.0 billion (on a pre-money basis, BlueCo’s headline valuation is $825 million). But is BlueCo really worth $1 billion? In other words, what does the Series E investment imply about the value of the stakes in BlueCo held by other investors?
The value of the whole is equal to the sum of the individual parts. So, for BlueCo to truly be worth $1 billion, all 200 million fully-diluted shares must be worth $5.00 each. But the various share classes are not created equal. At each subsequent funding stage, investors in startup companies negotiate terms to provide downside protection to their investment while preserving the upside potential if the subject company turns out to be a home run. Such provisions commonly include some or all of the following:
- Liquidation preferences that put the latest investors at the front of the line for exit proceeds. This is especially advantageous in the event the Company fails to meet expectations (basically LIFO treatment: the last one in is the first one out).
- Cumulative dividend rights that cause the liquidation preference to increase over time. When such rights are present, the preferred investors not only stand at the front of the line, but are entitled to a return on their investment if there are sufficient proceeds.
- Anti-dilution or ratchet provisions that allow preferred investors to hit the reset button on many of their economic rights in the event the company is forced to raise money in the future at a lower price.
- Participation rights that allow the preferred investors to simultaneously benefit from the payoff to common shares while also recovering their initial investment via liquidation preference.
A recent New York Times article highlighted additional, more exotic rights and privileges being attached to recent financings.
For the sake of illustration, we will assume that the terms of BlueCo’s Series E preferred shares are generally favorable to the other investors: pro rata liquidation preference to other preferred investors, non-cumulative dividends, and no participation rights. Despite these relatively benign terms, owning Class E shares is clearly preferable to owning more junior classes. Consider the waterfall of proceeds under various strategic sale exit scenarios:
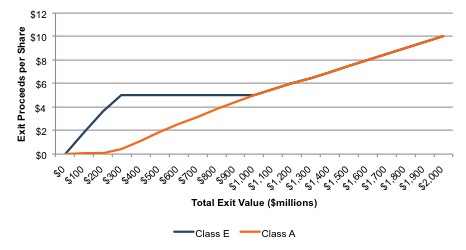
Even under the relatively disappointing $400 million exit scenario, the Scenario E shareholders are entitled to return of their investment, or $5.00 per share, while the proceeds to more subordinate classes range from $1.14 per share to $3.00 per share. The following chart depicts the superiority of the proceeds for Series E preferred shares to Series A shares over enterprise exit values less than $1.0 billion:
The area between the payoff lines for Class E and Class A preferred shares represents the incremental value available to the more senior Class E shares. Borrowing from the fair value measurement lexicon, if the recent Series E issuance price of $5.00 per share is consonant with market participant expectations, then that same group of market participants would rationally assign a lower value to the Class A shares. Valuation analysts use two primary techniques for estimating the magnitude of the difference in share value across the various classes. Examining the relative merits of the two techniques (the probability-weighted expected return method, or PWERM, and the option pricing method, or OPM) is beyond the scope of this blog post. Both models are reasonably intuitive but require numerous assumptions for which irrefutable support can prove elusive.
We use the OPM to illustrate the impact of the rights and preferences of the most senior preferred shareholders on the economic value of a nominal unicorn. The two most subjective assumptions in the OPM are the time remaining until exit and the return volatility of the underlying business. The sensitivity table below depicts the implied total enterprise value of BlueCo (that would reconcile to the $5.00 per Series E preferred share transaction price) using the OPM under a range of assumptions for exit timing, given assumed volatility of 100%:
Over the range of exit timing assumptions noted above, the implied total enterprise value ranges from less than $600 million to just over $800 million, meaningful discounts to the $1 billion headline number. The reliability of the OPM and the assumed inputs can be debated; however the point remains that, since the subordinate classes are necessarily worth less than Series E, the total enterprise value is less than $1 billion.
So what?
Is the preceding analysis just so much valuation pedantry? Perhaps, but we suggest that these observations reflect one practical peril of high valuations for late stage investors and management teams. The implied enterprise value based on rights and preferences of senior investors is relevant precisely because buyers in the exit markets for start-up companies – strategic sales and IPOs – assess the value of the entire enterprise, not individual interests. The exit markets assign a value for the entire company, exhibiting a serene indifference to how that value is allocated to various investors. This can result in unflattering headlines and unpleasant outcomes for late stage investors.
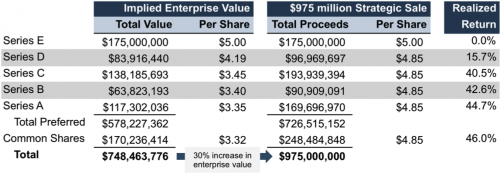
Let’s return to the BlueCo example to illustrate. Assume that the appropriate assumptions for BlueCo from the sensitivity table above are three years to exit, implying an enterprise value of $748 million. In the year following the Series E investment, BlueCo management executes its strategy successfully, causing the enterprise value to increase 30% to $975 million. If BlueCo exits via a strategic sale at that point, none of the incremental enterprise value will accrue to the Series E investors; despite identifying an attractive company, and the strong execution of management, the Series E investors will receive their capital back with no return.
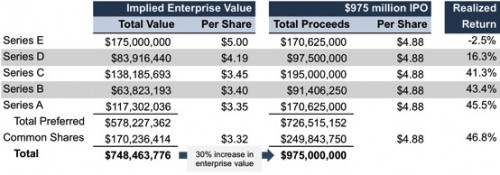
If the exit occurs instead by IPO, things get even more awkward. In contrast to a strategic sale, an IPO is a pro rata exit, meaning that the realized return for the Series E preferred investors will actually be negative, despite the 30% increase in enterprise value. Further, the Company and its management team will likely be subject to some unfavorable press for executing a “downround” IPO, although in reality, it generated a handsome return for the investor group as a whole.
So when is a unicorn really a unicorn? We hesitate to draw a bright line; circumstances and assumptions vary. Regardless of size, the lesson for investors and management teams at early-stage companies is to beware the headline valuation number. Appearances can be deceiving.


