Over the previous weeks, we have discussed specific factors in the Eagle Ford like DUCs (Drilled but Uncompleted Wells) and how certain operators behave in this resource play. Today, we take a step back and review the broad characteristics of the Eagle Ford Shale resource. Download this information in a convenient PDF at the bottom of this post.
Eagle Ford at a Glance
| First Discovered | 2008 |
| Discovery as Viable Play | 2008 |
| Primary Production | Oil |
| Oil Type | Sweet, Light Crude |
| Play | Unconventional Shale |
| Drilling | Horizontal, Multi-Stage Hydraulic Fracturing |
| Top 3 Production Companies | EOG Resources, BHP Billiton, Conoco Phillips |
| Breakeven | $27 – $63 per barrel 1 |
| Abnormal DUCs | 416 2 |
| Production Since 2007 | 4,338 MMBOE 3 |
| Issues | Likely to have High Entry Cost & Low Oil Prices |
| Potential | Low Breakeven Oil & Gas Prices due to High Productivity per Well & New Play so Large Amounts of Oil & Gas Remain |
| 1 Bloomberg Intelligence county-level estimates 2 Drilled Uncompleted Wells with > 3 months in inventory as of January 2016; also referred to as fraclog (Bloomberg Intelligence) 3 EIA as of June 2016 | |
Eagle Ford Shale
Located in south Texas, the Eagle Ford is the most active shale play in the world. The shale’s potential was first recognized in 2008 when the first drillers, Petrohawk, found natural gas. Soon after that, other drillers began to enter the play and discovered not only significant natural gas reserves, but also large quantities of oil. Since then companies have invested heavily in Eagle Ford, with almost $30 billion spent on developing the play in 2013. In 2015, 57% of production was oil, and 43% of production was natural gas.
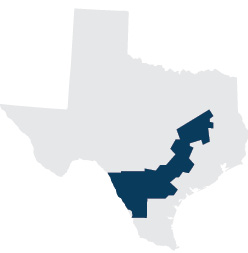
As with other oil and gas formations, the current price environment hampers profitability. However, the region has some of the lowest natural gas breakeven prices in the U.S. (according to Barclays) and the lowest shale oil breakeven prices after the Permian (according to Bloomberg). Such low costs are likely to attract many large players to the region, particularly as other areas struggle. This in turn will raise the cost to enter the play.
Undiscovered, Recoverable Resources in Eagle Ford
| Resource Estimate* | |
| Recoverable Oil | 994 MMB |
| Recoverable Natural Gas | 52,428 BCF |
| Recoverable Liquid N.G. | 2,059 MMB |
| *Estimate calculated from the mean undiscovered, recoverable reserve estimates in the 2011 USGS report. | |
The U.S. Geological Survey (USGS) completed a geology-based assessment of the undiscovered, technically recoverable oil and gas resources in Upper Cretaceous strata of the U.S. Gulf Coast region, which includes the Eagle Ford Group. The amount of undiscovered, recoverable natural gas in the Eagle Ford exceeds that in the Permian Basin.
Eagle Ford Production
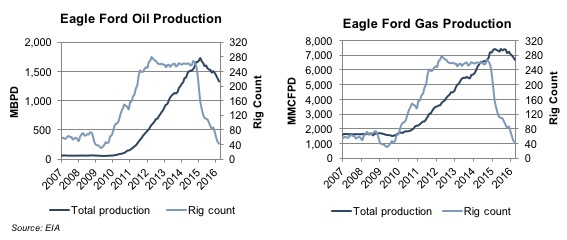 Baker Hughes collects and publishes information regarding active drilling rigs in the United States and internationally. The number of active rigs is used as a key indicator of demand for oilfield services & equipment. However, rig counts can be misleading if not considered along with production. Rig counts in the Eagle Ford drastically decreased in late 2014 and throughout 2015. However production did not experience the same scale of decline. This demonstrates that producers with average or poor locations, higher costs, and inefficiencies were forced out of the market, while those with good locations and lower costs continued to drill for oil and gas in the Eagle Ford.
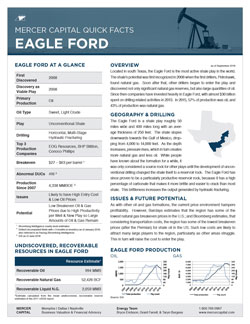
AVAILABLE RESOURCE
Quick Facts: Eagle Ford
Download this information in a convenient, one-page PDF. Download


