Given that our own Taryn Burgess is attending the 7th Annual National Association of Royalty Owners (NARO) Appalachia Conference in West Virginia today, we decided to revisit this post (originally published in April 2017). Enjoy!
What is a Royalty Interest?
Ownership of a percentage of production or production revenues, produced from leased acreage. The owner of this share of production does not bear any of the cost of exploration, drilling, producing, operating, marketing or any other expense associated with drilling and producing an oil and gas well.
What is an Overriding Royalty Interest (ORRI)?
A percentage share of production, or the value derived from production, which is free of all costs of drilling and producing, and is created by the lessee or working interest owner and paid by the lessee or working interest owner.
ORRI’s typically do not own a perpetual interest in the mineral rights. Typically they are structured to have rights to royalties for the term of the lease period. Royalty interests, on the other hand, generally have mineral ownership into perpetuity, even after a lease expires. Thus the main difference between royalty interests and ORRI’s is that royalty interests are tied to the ownership of the mineral rights below the surface, and ORRI’s are tied to the lease agreement and ceases to exist once the lease expires.
Some may find it surprising that the popular publicly traded Permian Basin Royalty Trust (PBT) only owns ORRI’s, not royalties, in various oil and gas properties in the United States. PBT owns a 75% net ORRI in the Waddell Ranch properties comprising Dune, Judkins, McKnight, Tubb, University-Waddell, and Waddell fields located in Crane County, Texas. As of December 31, 2016, its Waddell Ranch properties contained 349 net productive oil wells, 64 net productive gas wells, and 102 net injection wells.
The company also holds a 95% net overriding royalty in the Texas Royalty properties that consist of various producing oil fields, such as Yates, Wasson, Sand Hills, East Texas, Kelly-Snyder, Panhandle Regular, N. Cowden, Todd, Keystone, Kermit, McElroy, Howard-Glasscock, Seminole, and others located in 33 counties in Texas. Its Texas Royalty properties consist of approximately 125 separate ORRI’s containing approximately 51,000 net producing acres.
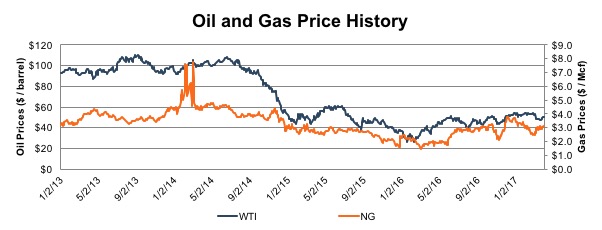
Over the past four years, crude oil and gas prices have fluctuated significantly. While this is creating significant volatility on the E&P side of the industry on both an operational and investment decision level, many look at royalty trusts as a way to bypass the complexities of an operating E&P and attempt to “pure play” the price of oil and gas. Based on this assumption, we will analyze the changes PBT has endured over the past four years.
Production
 PBT derives revenue from ORRI’s which cover approximately 382,000 gross acres (85,205 net acres) in west Texas. Since the ORRI’s that PBT owns were not derived from a 100% working interest, their gross acreage differs from their net acreage. Net acreage is calculated as the company’s percentage interest multiplied by its gross acreage. Over the past four years, the amount of acreage has not changed. Production, on the other hand, has changed significantly as shown in the table below.
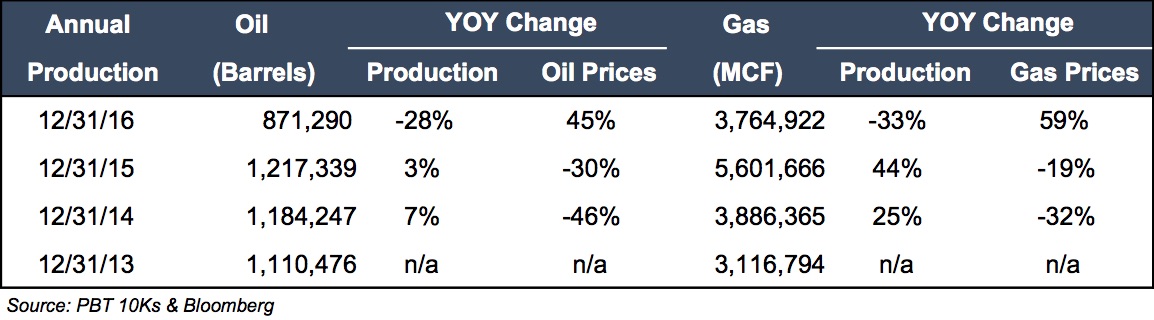 Comparing the production levels to the price levels of oil and gas indicates that even after the decline in oil and gas prices during 2014, production increased during 2015. Oil production increased 3% while gas production increased 44%. The increased production was in part due to the 3 new wells drilled during 2014, 3 workovers completed during 2014 and 29 wells completed during 2014 and 2015.
During 2016, investment activity was significantly different which resulted in a 28% decline in oil production and 33% decline in gas production. No wells were drilled and completed during 2016. Only 1 workover was performed. Clearly, the operators were holding back capital as they waited for more price certainty in the future.
Comparing the production levels to the price levels of oil and gas indicates that even after the decline in oil and gas prices during 2014, production increased during 2015. Oil production increased 3% while gas production increased 44%. The increased production was in part due to the 3 new wells drilled during 2014, 3 workovers completed during 2014 and 29 wells completed during 2014 and 2015.
During 2016, investment activity was significantly different which resulted in a 28% decline in oil production and 33% decline in gas production. No wells were drilled and completed during 2016. Only 1 workover was performed. Clearly, the operators were holding back capital as they waited for more price certainty in the future.
Reserves
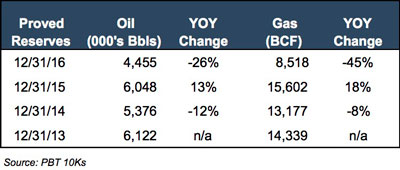 The change in reserves tells the same story. After investing in the drilling and completion of new wells, and workover wells, the proved reserves increased from 2014 to 2015 for both oil and gas. The increase is significant as reserves are impacted by (1) investment in new/existing wells and (2) future prices of oil and gas. The price utilized in the 2015 reserves was significantly lower than what was used in the 2014 reserves. Therefore, the increase in reserves is significant as the additional proved reserves more than countered the reduction in the commodity prices in the reserve model.
For 2016, the reserves declined due to the lack of investment in current and future wells. And while pricing stayed relatively the same from 2015 to 2016, the loss in proved reserves was directly attributed to the lack of investment in new and existing wells.
The change in reserves tells the same story. After investing in the drilling and completion of new wells, and workover wells, the proved reserves increased from 2014 to 2015 for both oil and gas. The increase is significant as reserves are impacted by (1) investment in new/existing wells and (2) future prices of oil and gas. The price utilized in the 2015 reserves was significantly lower than what was used in the 2014 reserves. Therefore, the increase in reserves is significant as the additional proved reserves more than countered the reduction in the commodity prices in the reserve model.
For 2016, the reserves declined due to the lack of investment in current and future wells. And while pricing stayed relatively the same from 2015 to 2016, the loss in proved reserves was directly attributed to the lack of investment in new and existing wells.
Distributions
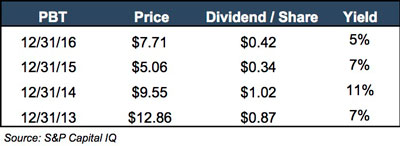 PBT is at its lowest yield in the last four years. While the price was lower at the end of 2015, the dividend as a percentage of price was higher in 2015 relative to 2016. The above chart shows the impact of (1) changes in oil and gas prices; as well as (2) changes in production levels. These two areas are directly related to the dividend per share. The price, however, is directly related to the movement of buyers and sellers of PBT securities. While the dividend is “trailing” information, because it is the result of the previous 12 months of activity, the price factors in forward-looking information. For example, as of 2013, buyers and sellers of PBT were expecting higher dividends in 2014 due to the high price of oil and gas, PBT’s investment in wells and increasing proved reserves1. When commodity prices declined during 2014, the price quickly reflected the new pricing environment, the impact on reserves, and the shift in management’s investment attitude for new and existing wells. All of these factors pressured prices downward while the trailing dividends showed strength, resulting in a higher than normal yield. During 2015 and 2016, the price, dividend, and yield settled to relatively tempered levels. All data points above have had enough time to reflect the current environment and as such, are communicating a similar story.
Finishing Thought
When valuing a royalty interest or ORRI, here are a few items to keep in mind:
- Understand the rights and restrictions of the subject royalty interest:
- Royalty interests may have value into perpetuity as it is a direct ownership in the minerals;
- ORRI’s typically only have value for the life of the lease;
- Understand the differences between the subject ORRI and a publicly traded security that owns ORRI’s and make adjustments for the differences;
- Understand the historical, current and future outlook for commodity prices relating to the subject ORRI;
- Understand the historical, current and future outlook for reserves;
- Utilize publicly traded yields to assess the market's attitude for investments in similar securities; and
- Adjust for the differences between a publicly traded security and a non-marketable security.


