Warren Buffett’s guidance is salt in the wound for those in the oil and gas industry: “You pay a very high price in the stock market for a cheery consensus.” That was the title of his article published in Forbes Magazine in November of 2008. Energy companies, investors and royalty owners all paid a very high price to invest in the oil and gas industry prior to July 2014. But, those who invested when there was a “Cheery Consensus” have now endured more than 20 months since the crash of oil started. Fear and uncertainty were so rampant that many anticipated oil prices to fall to $10 per barrel. Yet during this turmoil did you remember another famous investing principle from Baron Rothschild: “Buy when there's blood in the streets, even if the blood is your own." Okay, I’m sure you remembered it at some point during the fall, but did you have the moxy to act on it?
There was blood in the street, lots of it, over the last two years. Many operators and oil and gas service companies didn’t survive the last 20 months and most of the news headlines focused on their story. For royalty owners, who might depend upon royalty checks for steady income, it was equally scary as their payments shrunk due to low oil prices which were magnified by lower production rates. Operators went belly up or were acquired, each of which leads to administrative complications and disruptions in check disbursements to royalty owners. Some unlucky royalty owners received demand letters indicating they received royalty payments for interests they didn’t own and therefore must pay back multiple years’ worth of royalty receipts to the operators. How does that happen? It appears, when there is a cheery consensus, details get overlooked until the environment turns dire.
However, the last 12 months have provided some relief. Oil prices have increased more than 65%, acquisition activity in the Permian Basin is high, and the oil and gas equity markets have shown positive growth. Additionally, investors seeking income generating investments have been interested in royalty trusts which have had significant returns over the last 12 months. If you had the moxy to grab the “falling knife” back in early 2016, it appears you grabbed the handle and not the blade. Returns over the last 12 months have been in the double digits and perhaps triple digits depending on the investment vehicle. Sadly, the fall in oil price was so significant that investments made more than 18 months ago are largely still under water, while those made less than 12 months ago are sitting pretty. This is true for royalty owners as well.
Market indications are available in the form of publicly traded oil & gas royalty trusts. There are approximately 20 oil and gas focused royalty trusts publicly traded, as of the date of this article. In the last two months, the implied payback period increased 1.1 years, on average, from 11.1 years to 12.2 years. This occurred from declining yields as equity prices increased.
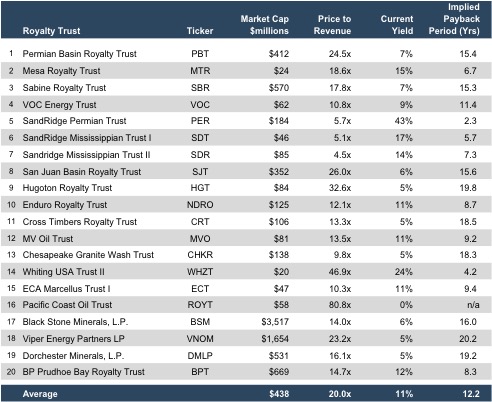
Market Observations
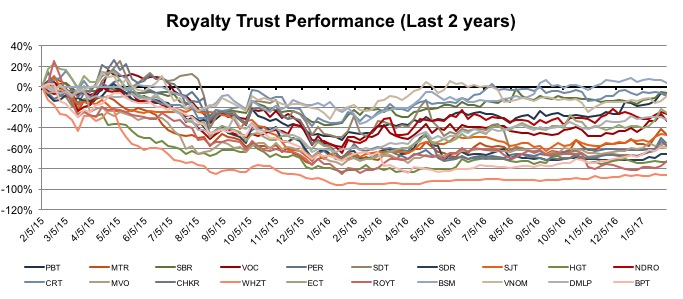
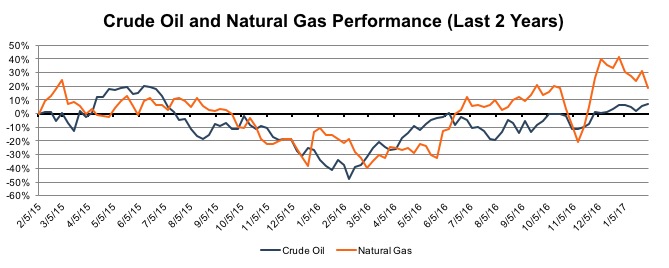
Royalty trusts, like the rest of the oil and gas industry, have been hit hard over the previous 24 months. Before the bottom fell out, oil traded as high as $107.95 in June of 2014 and plunged to a low of $29.05 in February of 2016. Since February, the price of oil appears to have found a new home between $50-$60 / barrel. That said the last two years have been a trying time to hold investments in oil and gas, especially in Royalty Trusts. Below is a chart of the market price performance for each royalty trust over the last two years. Only one is showing a positive price performance, Black Stone Minerals, LP, but this is slightly misleading as it’s only been publicly traded for the prior 42 months (just shy of two years).
 The above chart looks very similar to the performance of the price of oil and gas over the same time period. Royalty interest owners have seen their monthly payments move in the same manner.
 Yes, if you invested in the energy sector approximately two years ago, there is a good chance your investment is still underwater. However, if you invested one year ago, the results are dramatically different. We are approximately 12 months from the days oil prices hit the “bottom of the barrel” and since February 2016, WTI has increased more than 65%. Below is the same chart adjusted to show the performance over the last 12 months.
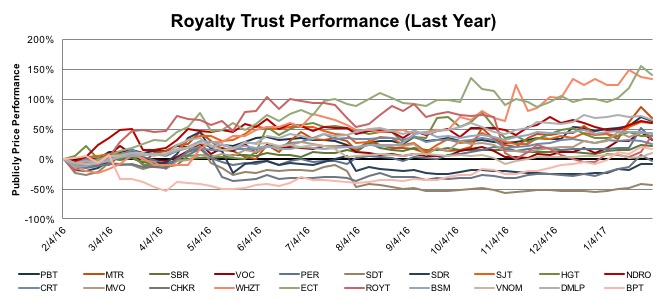 Only three of the twenty royalty trusts have negative price performance over the last year, compared to 19 when observing performance over the last two years. Of the three that are negative, two were discussed in earlier posts. Sandridge Mississippian Trust I and II’s operator was going through bankruptcy and the location of their wells was not as desirable as other plays. The other royalty trust with negative performance is Chesapeake Granite Wash Trust.
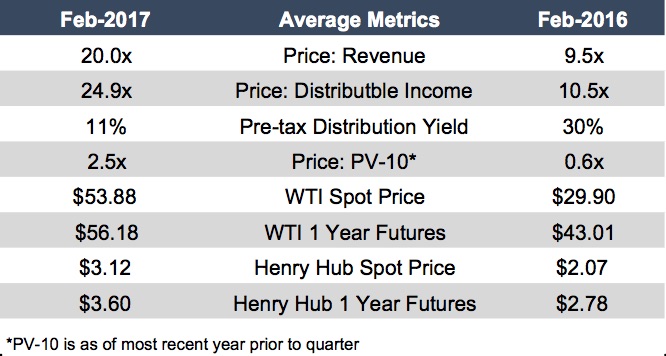
For the above 20 Royalty Trusts, we compared various pricing metrics between today and one year ago:
Only three of the twenty royalty trusts have negative price performance over the last year, compared to 19 when observing performance over the last two years. Of the three that are negative, two were discussed in earlier posts. Sandridge Mississippian Trust I and II’s operator was going through bankruptcy and the location of their wells was not as desirable as other plays. The other royalty trust with negative performance is Chesapeake Granite Wash Trust.
For the above 20 Royalty Trusts, we compared various pricing metrics between today and one year ago:
Observations and Disclaimers1
- Price to revenue and price to distributable income indicate, on average, the trusts are more expensive now than a year ago. This trend has continued from our discussion in December 2016.
- Yields were higher last year as they did not reflect the quickly falling market price. Increase in pricing over the last 12 months is the primary cause of the lower yields. Some Trusts have cut their distributions in response to falling royalties. The combination of the two results in lower yields.
- As of today, market prices have leveled off and annual distributions are comprised of a full year of lower royalty payments, resulting in lower yields compared to a year ago.
- Price to PV-10 is significantly higher this year compared to last. The market is now willing to pay 2.5x more than the present value of future cash flows for the operating wells as opposed to 0.6x a year ago. However, PV 10 data is only disclosed annually, typically during the first quarter of the year. We are monitoring disclosures to update our models as the data becomes available. Stay tuned.
- A year ago, many expected oil prices to reach $43/ barrel, or increase by 44%, over the year. This turned out to be directionally correct, but understated the actual performance. The current spot price is $53.88/ barrel which was an increase of 80%. Natural gas prices performed much the same way, increasing 34%. However, for the next 12 months oil prices are expected to increase by only 4% while natural gas prices are anticipated to jump by 15%.
Implications for Royalty Owners
In many respects, royalty owners can utilize publicly traded royalty trusts to observe changes in investor behavior and get a feel for how much their royalty interests may be worth. Here are a few areas to consider for your specific situation to compare and contrast with Royalty Trusts:
- Set Number of Assets. Royalty trusts typically have a set number of wells and producing assets after they are formed. Does your property have a fixed number of assets or will it grow? If new oil and gas wells are not being added to the property, then the oil and natural-gas reserves will be depleted as they age and produce.
- Location. The Royalty Trusts above have assets all over North America. Some are located in hot spots while others are not. Location drives investor appetite as operating costs and production levels, which vary by location, drive profitability in an industry that has zero control over the price of their product. This is a significant reason for the high transaction activity in the Permian Basin. Operators know they are able to make a profit through high production rates and low operating costs in Permian Basin even at $40 oil. Consider the investor activity, or lack there-of, in your area.
- Price and Production. Now that the U.S. has significant recoverable oil and gas reserves and the ability to export unrefined crude world-wide, the U.S. can be considered a swing producer, a power which historically characterized OPEC. As a swing producer, price dictates the level of production the market will consume and production will increase or decrease relatively quickly to meet demand. In response to price changes, operators will increase or decrease production levels at will. Consider how your operator has behaved in various pricing environments and the operators of the Royalty Trusts.
 Chris Mercer explains,
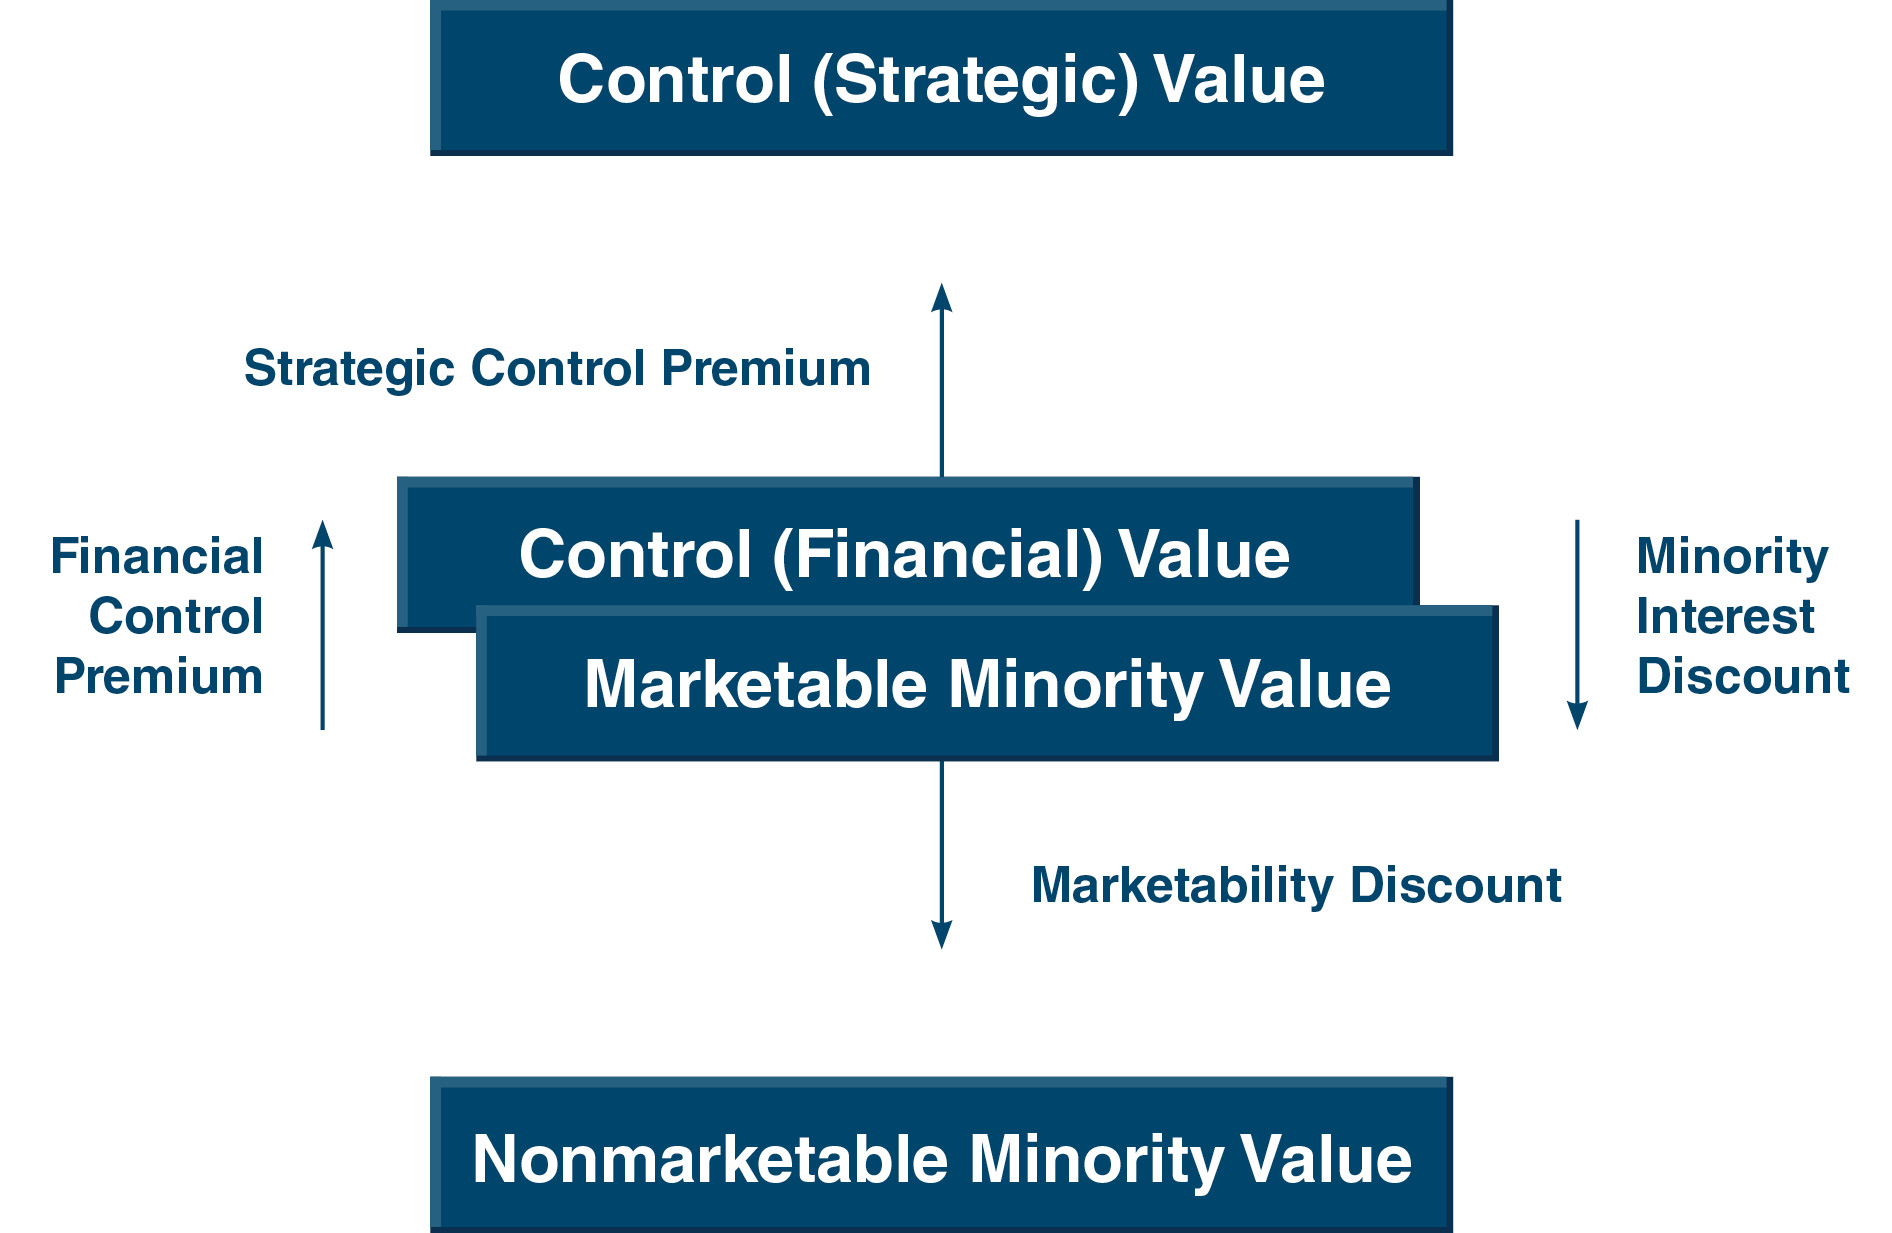
The benchmark level is the marketable minority level of value, or the middle level in the chart above. Conceptually, it represents the pricing of the equity of a public company with an active and freely trading market for its shares. For a private company, it represents that same price as if there were a free and active market for its shares. The lowest level on the traditional levels of value chart is called the nonmarketable minority level of value. This level represents the conceptual value of illiquid (i.e., nonmarketable) minority interests of private companies, or entities that lack active markets for their shares.
Royalty trusts provide an indication of value at the Marketable Minority Value level for minority interests in an entity with royalties as the primary asset. For royalty owners the value level can be a mixed bag. Many own the asset directly while others own equity interests in entities with royalties as their main assets. It is important to understand the value level comparability difference for your situation.
To move from the Marketable Minority Value to the Nonmarketable Minority Value level, simply apply a marketability discount. Stated a different way, apply a discount for not having the ability to quickly sell your asset and receive cash. Fully marketable assets, like those publicly traded, have the ability to exchange the asset for cash in approximately three days. All other assets which do not have this access lack marketability. Therefore in order to build and find a market for the assets, a discount is typically required by potential investors.
We have assisted many clients with various valuation and cash flow issues regarding royalty interests. Contact Mercer Capital to discuss your needs in confidence and learn more about how we can help you succeed.
1 Disclaimer: no two of the above royalty trusts are alike. Differences abound in asset mix, asset location, term, and resource mix, just to name a few. In future blog posts, we will explore each trust individually and discuss their uniqueness.


