Latecomers are inevitable at parties. They skulk in at the end, missing out on most of the fun, food and games that everyone else has been enjoying. Yet, savvy socialites aim to arrive fashionably late, after the labor of getting the party going but still in time to enjoy the night.
When it comes to valuations, are oilfield servicers late to the proverbial oil patch valuation gala or just in time to enjoy the recovery?
Energy Sector Performance Improving
Since oil prices fell off a cliff in the summer of 2014, most other energy sectors have been climbing back in various phases of recovery:
- E&P company valuations are recovering as companies have benefited from increases in production, escalating acreage values, lower breakeven prices and a recuperating oil price. This is especially true in the Permian Basin. In fact, activity and production in West Texas is growing so fast that existing pipelines and infrastructure struggle to keep up.
- Meanwhile, US refiners, feasting on the spread between Brent and WTI, continue to see valuation gains as well. Refineries are busting at the seams, with current utilizations over 98%, and acquisitions abound. Refinery performance appears sustainable for the short to intermediate term, but in the long run, capacity may be a limiting factor.
- Even midstream and pipeline valuations, after taking a beating through the end of 2015, are recovering nicely. The current West Texas hydrocarbon traffic jam presents a growth opportunity for this sector.
Past Oilfield Service Performance
Oilfield service providers, drillers, pumpers and equipment providers enabled E&P companies to make impressive efficiency leaps. So, where do they stand today? One lens through which to view things is the OSX index–a popular metric to track sector performance.
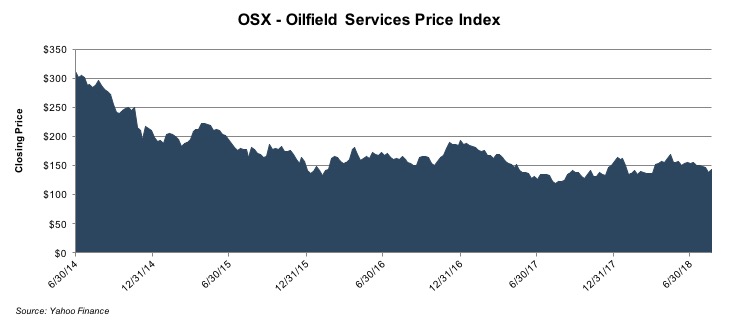 Since mid-2014, the OSX index does not exactly portray an inspiring comeback by oilfield service companies. In fact, looking at the index alone might lead one to think oilfield servicers have not even received an invitation to this reputed party, much less arrived.
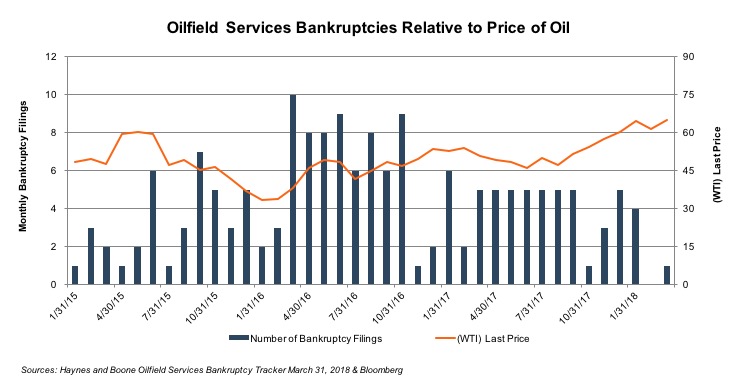
Earnings sunk in 2015 and bottomed out in 2016 as a result of producers cutting drilling and completion costs. Balance sheets went through significant write downs, impairments and asset sales. Not surprisingly, bankruptcies for the sector peaked in 2016 with 72 oilfield service companies filing for bankruptcy, up from 39 the year prior.
Since mid-2014, the OSX index does not exactly portray an inspiring comeback by oilfield service companies. In fact, looking at the index alone might lead one to think oilfield servicers have not even received an invitation to this reputed party, much less arrived.
Earnings sunk in 2015 and bottomed out in 2016 as a result of producers cutting drilling and completion costs. Balance sheets went through significant write downs, impairments and asset sales. Not surprisingly, bankruptcies for the sector peaked in 2016 with 72 oilfield service companies filing for bankruptcy, up from 39 the year prior.
 It was a mess, to say the least. Oh, but how things have changed in the past two years.
Current Oilfield Service Performance
Higher oil prices, coupled with lower breakeven costs for producers, are making drillers, completers and a host of other servicers busier than a gopher on a golf course. Capex budgets for E&P companies, known as lead indicators for drillers and contractors, have taken off. While dormant for decades, proven drilling locations (PUDs) now multiply in light of new fracking technologies and their resultant economics. Drilling and completion budgets are not only growing for operators, but an increasing percentage of those budgets are being spent in West Texas.
Utilization Rates and Day Rates
Specifically, as it pertains to oilfield service companies, two key metrics, utilization rates and day rates, have begun to align in a way not seen since 2014.
By the end of 2017, utilization rates for certain rigs averaged around 80%, or almost fully utilized considering necessary downtime and transition from one drilling location to another. However, things are currently so hot that utilization rates have now risen to over 90%.
Day rates, the measure of how much a servicer can charge an operator for every day the rig is operating, have been slower to increase. Increases in day rates started to move upward in the last six months or so. Estimates suggest that day rates will notch up 10-15% by the end of 2018. This is good news for oilfield servicers.
Valuation Turnaround
Now that utilization rates and day rates are both trending upward, valuations should logically respond and by certain aspects, they are.
Take, for example, a selection of guideline company groups: onshore drillers and pressure pumpers (fracking companies). One way to observe the degree of relative value changes is to look at enterprise value (sans cash) relative to total book value of net invested capital (debt and equity) held by the company or “BVIC”. Any multiple over 1.0x indicates valuations above what net capital investors have placed into the firm, which for drillers and pumpers is a notable threshold.
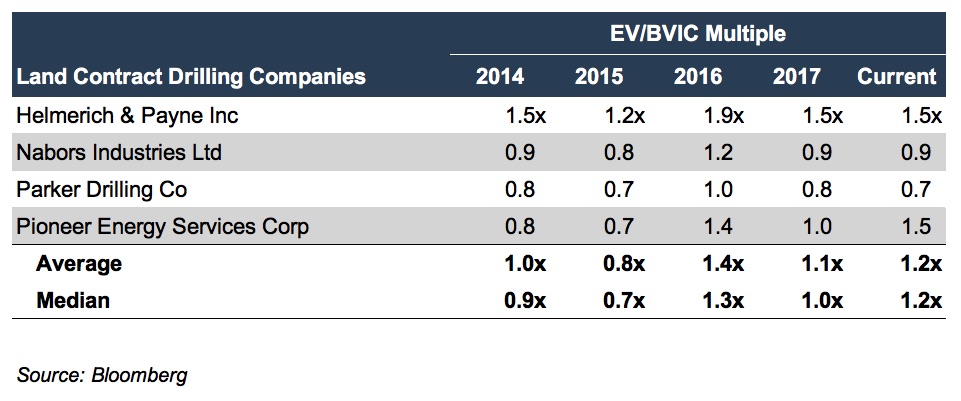 While 2016 was an anomaly (due to the significant balance sheet changes mentioned above), the rest of the time frame shows a clear trend. In 2015, with a multiple below 1.0x, investors didn’t expect to get an adequate return on the capital deployed at these companies. However, as 2017 came to a close and now moving into mid-2018, that trend has reversed. All except Parker Drilling have met or exceeded their 2014 multiples, and the average is around 1.2x. This suggests that the market is recognizing intangible value again for assets such as developed technology, customer relationships, trade names and goodwill.
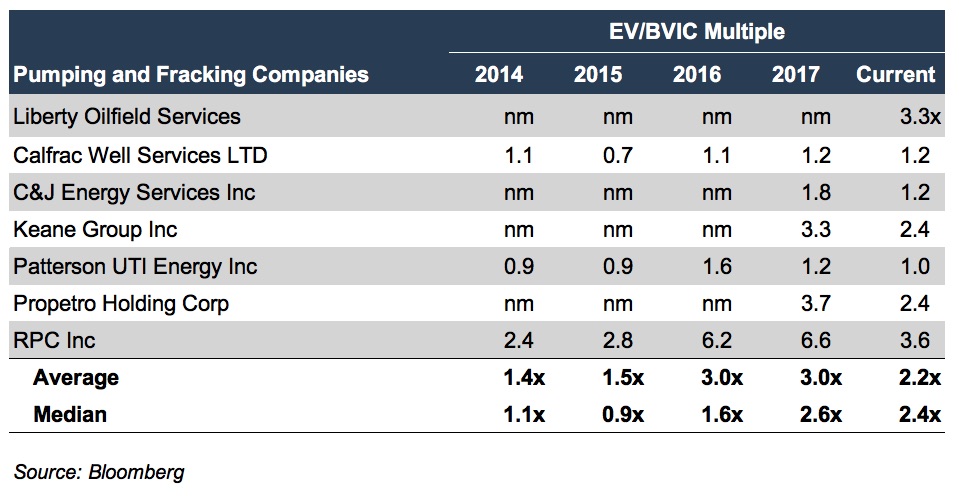
For pressure pumping and fracking concentrated businesses, which are more directly tied into the value expansion in the oil patch, the trend is clear. Intangible asset valuations have grown even faster, more heavily weighted towards pumpers’ developed technology that is driving demand for these companies’ services. However, the recent infrastructure logjam in West Texas has pushed multiples lower. Nonetheless, the market has been recognizing the value contributions of these companies.
While 2016 was an anomaly (due to the significant balance sheet changes mentioned above), the rest of the time frame shows a clear trend. In 2015, with a multiple below 1.0x, investors didn’t expect to get an adequate return on the capital deployed at these companies. However, as 2017 came to a close and now moving into mid-2018, that trend has reversed. All except Parker Drilling have met or exceeded their 2014 multiples, and the average is around 1.2x. This suggests that the market is recognizing intangible value again for assets such as developed technology, customer relationships, trade names and goodwill.
For pressure pumping and fracking concentrated businesses, which are more directly tied into the value expansion in the oil patch, the trend is clear. Intangible asset valuations have grown even faster, more heavily weighted towards pumpers’ developed technology that is driving demand for these companies’ services. However, the recent infrastructure logjam in West Texas has pushed multiples lower. Nonetheless, the market has been recognizing the value contributions of these companies.
Conclusion
To be clear, nearly all of these companies had to shrink their balance sheets to get these multiples in line. This explains why some of the data is not as meaningful in 2016. However, it appears that’s what was necessary in light of the shift in the market.
Overall rig counts have shifted downward since 2014 and are currently nowhere near prior levels, thereby forcing these companies to shed assets in recent years. That’s the price of market efficiency. However, with those challenges no longer weighing them down, some oilfield services companies may be finally arriving at the valuation party.
Remember the initial question posed in this post: When it comes to valuations, are oilfield servicers late to the proverbial oil patch valuation gala or just in time to enjoy the recovery? Maybe the question to ask is: How much time is left before the celebration ends?
Originally appeared on Forbes.com.

