In previous posts, we have discussed the existence of publicly traded royalty trusts & partnerships and their market pricing implications to royalty owners. Before using publicly traded royalty trusts as a pricing reference for your royalty interest, it is important to understand the economic rights and restrictions within those royalty trusts. Many publicly traded trusts have a set number of wells generating royalty income at declining rates for multiple years to come. In contrast, some trusts participate in a number of wells that have not been drilled, which represent upside potential for investors. Future growth and outlook potential for these publicly traded trusts are significantly different. A potential investor would want to know the details. The same is true for a privately held royalty interest.
Market Observations1
As of April 25, 2018, there are approximately 21 publicly traded oil and gas-focused royalty trusts and partnerships.
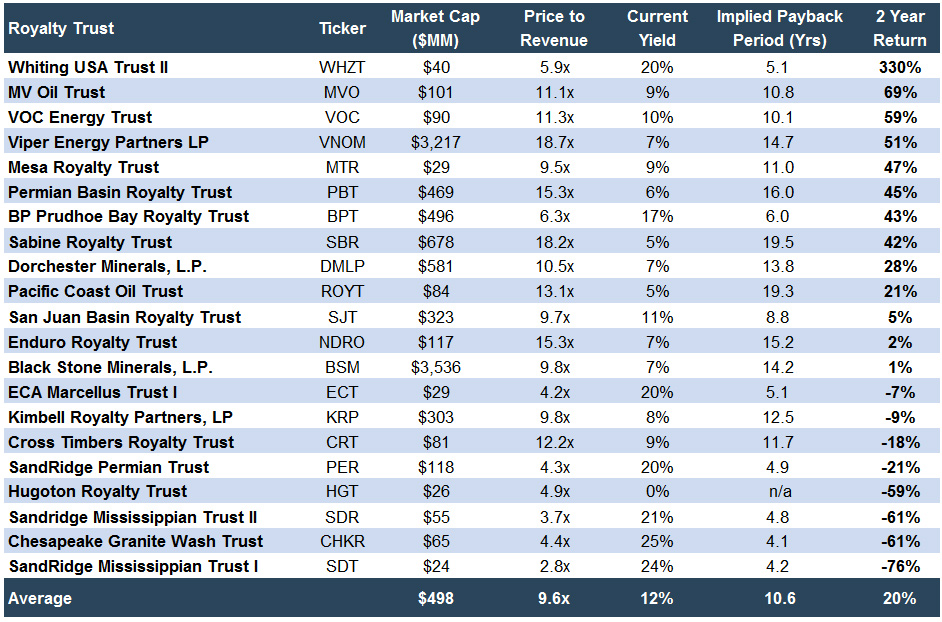
Figure 1
Over the previous two years, the performance of the 21 publicly traded royalty trusts has been a mixed bag. Eight have returned market value losses during the previous two years with an average market value return of negative 39%. Thirteen have experienced positive market value returns with an average of positive 57%.
Contrast this wide return with the price of crude oil and natural gas which have both increased over the same period (Figure 2). Oil has consistently marched from $45 to $68, while dry gas has climbed from $1.88 to $2.79.
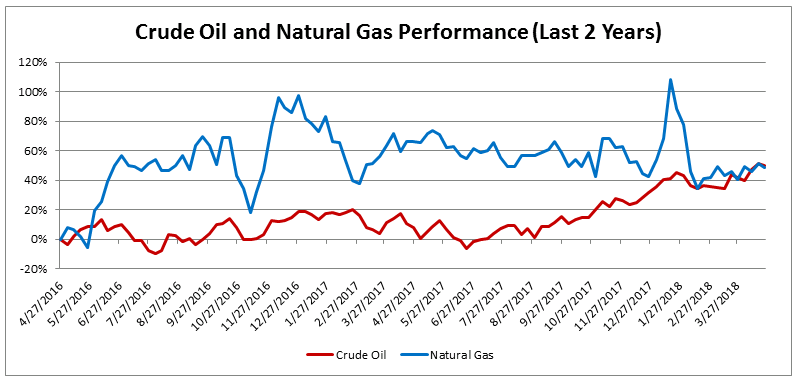
Figure 2
Clearly, there are some winners and losers among the 21 royalty trusts over the previous two years and, noticeably, more winners than losers. As seen in Figure 1, the royalty trust with the highest market value return was Whiting USA Trust II (WHZT) (+330%) over the previous two years, with MV Oil Trust (+69%) and VOC Energy Trust (+59%) coming in second and third, respectively.
Why did Whiting USA Trust II outperform all other royalty trusts over the previous two years and what is the nature of its economic rights and restrictions?
Whiting USA Trust II (WHZT)
Recent Pricing Activity
Over the previous two years, WHZT's stock price has increased from $0.50 to $2.15, an increase of 330% (Figure 3). Much of this increase was a steady climb from $0.50 to $1.50 as of April 5, 2018, which represents an increase of 200%. The last movement of $0.65 occurred in the previous 20 days. WHZT released their most recent 8K and 10K on March 23 and March 22, respectively. It appears it took the market a few weeks to get around to reading it. Additionally, the pricing activity is functioning much more like a working interest versus a royalty interest. Digging deeper will help us learn why.

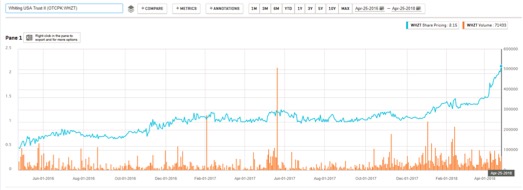 Figure 3
Description of Assets Owned by WHZT
WHZT assets include “term net profits interest in the oil and gas producing properties located in the Permian Basin, Rocky Mountains, Gulf Coast, and Mid-Continent regions” as described in their latest 10K filing:
[The term net profits interest (NPI)] represents the right for the Trust to receive 90% of the net proceeds from Whiting’s interests in certain existing oil, natural gas and natural gas liquid producing properties which are referred to as “the underlying properties”. The underlying properties are located in the Permian Basin, Rocky Mountains, Gulf Coast and Mid- Continent regions of the United States. The underlying properties include interests in 1,312 gross (376.7 net) producing oil and gas wells as of December 31, 2017.
Overall, these positions look positive as the Permian Basin is the most popular North American play currently and the Rocky Mountains, Gulf Coast, and Mid-Continent have positive characteristics too.
Is an NPI Closer to a Royalty or Working Interest?
The NPI represents a 28.7% profits interest in the producing oil and gas wells of Whiting. Net proceeds are calculated in the following manner: (1) Quantity of oil, gas and natural gas liquids times the price of oil, natural gas or natural gas liquids; minus (2) lease operating costs and workover costs; minus (3) production and property taxes; minus (4) development costs, hedge payments and all such production and development costs; minus (5) a maximum reserve of $2 million for future development. If the result of this formula is positive, 90% is distributed to the unitholders of WHZT. If the result is negative, the unitholders of WHZT are not liable currently. Unitholders are quasi-liable with any future net profits as accumulated losses will be zeroed out with future gains until there is a gain greater than zero.
It appears an NPI is a fancy term for working interest. If not for the protection of direct capital calls, there is not a significant difference between an NPI and working interest, or any material difference from what we read. Indirectly, the unitholders are making capital calls, in the form of the promise to pay off any accumulated losses with future income before receiving any distributions.
On the positive side, the 10K does appear to communicate relief in the form of limited and capital expenditures deducted from the NPI calculation. As of January 2018, capital expenditures included in the net profits calculations were limited. The annual limitation, effective January 1, 2018, is the average annual capital expenditure amount for the previous three years. Therefore, the capital expenditure limitation for 2018 is approximately $4.0 million. This limitation is new for 2018.
Based upon the NPI calculation, make whole provision for accumulated losses, and the limited capital expenditure protection, the unitholders of WHZT appear to own a working interest in the oil and gas properties versus a royalty interest.
Distributions to Unitholder
Perhaps part of the publicly traded price activity can be explained by considering the historical distribution pattern to unitholders (Figure 4). Distributions are based upon the NPI formula discussed above. Since its inception in 2012, distributions have been consistent during Q2 2012 through Q3 2014, at which point distributions decline for the remainder of 2014, 2016 and are non-existent for much of 2016. Based on the data available, future distributions appear to be uncertain, erratic and dependent on oil prices, operating expenses and capital expenditures, to name the large items.
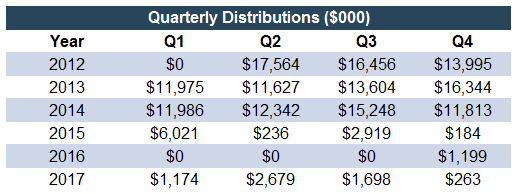
Figure 4
Specific Time Horizon
WHZT also has a specific time horizon before the trust will be terminated and shutdown. WHZT will be shut down when the first occurs:
- (a) the NPI termination date, which is the later to occur of (1) December 31, 2021, or (2) the time when 11.79 MMBOE have been produced from the underlying properties and sold (which amount is the equivalent of 10.61 MMBOE in respect of the Trust’s right to receive 90% of the net proceeds from such reserves pursuant to the NPI), or;
- (b) the sale of the net profits interest. The Trust is required to sell the NPI and liquidate if cash proceeds to the Trust from the net profits interest are less than $2.0 million for each of any two consecutive years. During the years ended December 31, 2017 and 2016, the Trust received cash proceeds of $6.7 million and $1.9 million, respectively, from the net profits interest.
Underlying Property Description2
The underlying properties consist of certain oil and natural gas producing properties located in the Permian Basin, Rocky Mountains, Gulf Coast, and Mid-Continent areas. The underlying properties include interests in 1,312 gross (376.7 net) producing oil and natural gas wells located in 47 mature fields with established production profiles.
As of December 31, 2017, approximately 98.9% of estimated proved reserves attributable to the trust were classified as proved developed producing reserves and 1.1% were classified as proved developed non-producing reserves. For the year ended December 31, 2017, the net production attributable to the underlying properties was 1,168 MBOE or 3,199 BOE/d. Whiting operates approximately 65% of the underlying properties based on the December 31, 2017 reserve report standardized measure of discounted future net cash flows.
Figure 5 summarizes estimated proved reserves and the standardized measure of discounted future net cash flows as of December 31, 2017 attributable to (i) the Trust based on the term of its NPI, and (ii) the underlying properties on a full economic life basis (dollars in thousands):
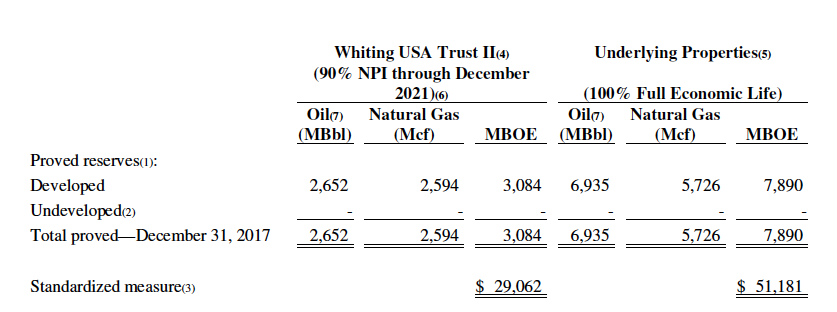
Figure 5
Trust Rights and Restrictions
Surprisingly, a unitholder within this trust can have significant power, compared to other comparable entities. The Trustee or a Trust unitholder, holding at least 10%, may call meetings of the unitholders. Each Trust unitholder is entitled to one vote for each unit owned and the majority of unitholders can:
- Dissolve the trust
- Remove the trustee or the Delaware trustee
- Amend the trust agreement
- Merge or consolidate with another entity
- Approve the sale of assets in certain circumstances;
- Agree to amend or terminate the conveyance;
Analysis
According to the IPO price on March 28, 2012, the net profits interest was given a market value of $418 million. The same properties are given a current market value of $39.6 million six years later. This change represents a decline of 90%. Furthermore, the current market value is approximately $10 million more than the most recent reserve report present value measures ($29.1 million).
It is clear the market anticipates positive factors to push the underlying property cash flows higher compared to the 2017 reserve report. Based upon the latest 10K, we know the additional future cash flow will not come from new wells, as all wells within the property are classified as PDP or PDNP. No PUD’s or other classification of reserves has been identified. Therefore, the increase in cash flows is coming from higher commodity prices, lower operating costs or lower development costs.
Either way, with over six years of production history, it appears optimistic that operations will become more efficient in years seven, eight and nine than they have been in years one through six. This leaves future commodity prices as the only logical lever left to base an increase. Additionally, with the market value holding close to $40 million dollars, an investment of approximately 51% or nearly $20 million, would allow for significant powers within the Trust. Given that the market value appears to be higher than the underlying asset value, a strong strategic case would need to be presented for that action to be logical.
Conclusion
This discussion is an example of the importance of understanding the details about your royalty interest or in the case of WHZT, your net profits/working interest. Consideration must be given to the underlying assets, current and future wells, outlook for oil and gas prices, rights and restrictions of the mineral rights owner, lease terms, distributions, etc. WHZT is also an example of why some publicly traded royalty trusts are not appropriate to use for comparison. WHZT may best be used for a working interest comparable but definitely not a royalty interest comparable.
Mercer Capital is an employee-owned independent financial advisory firm with significant experience (both nationally and internationally) valuing assets and companies in the energy industry (primarily oil and gas, bio fuels and other minerals). Our oil and gas valuations have been reviewed and relied on by buyers and sellers and Big 4 Auditors. As a disinterested party, we can help you understand the fair market value of your royalty interest and provide confidence that you get a fair price for your interest. Contact anyone on Mercer Capital’s Oil & Gas team to discuss your royalty interest valuation questions in confidence.
1 Capital IQ
2 WHZT 2017 10K


