It has been often discussed, particularly in recent years, that the value of privately held professional sports franchises is a newsworthy item. Analysts, investors, and fans alike have an interest in observing team owners buy and sell teams and watch the prices at which they trade. However, are team owners doing as well as some may portray? How about their investments as compared to their investing peers in the stock markets. We attempt to answer these questions based on some known data sources and return analytics over time. The answers are interesting but not entirely clear. There are two components to an investor’s rate of return: (i) interim returns in the form of cash flows or dividends, and (ii) price appreciation. Many commentators and writers have noted that some major league sports franchises have incurred operating losses in past years. For example, at one point it appeared that the MLB franchises on average had operating losses as players’ salaries increased faster than revenues. This was a big factor underlying the NFL and NHL lockouts in 2011 and 2012. There is a silver lining, however, and that appears to be the price appreciation realized from the increased values of these major league franchises. We traced over time the estimated appreciation (by league) of the values of sports teams, according to Forbes magazine. We also tracked the returns over the same time frames of several familiar equity market indices. The table below summarizes our findings.
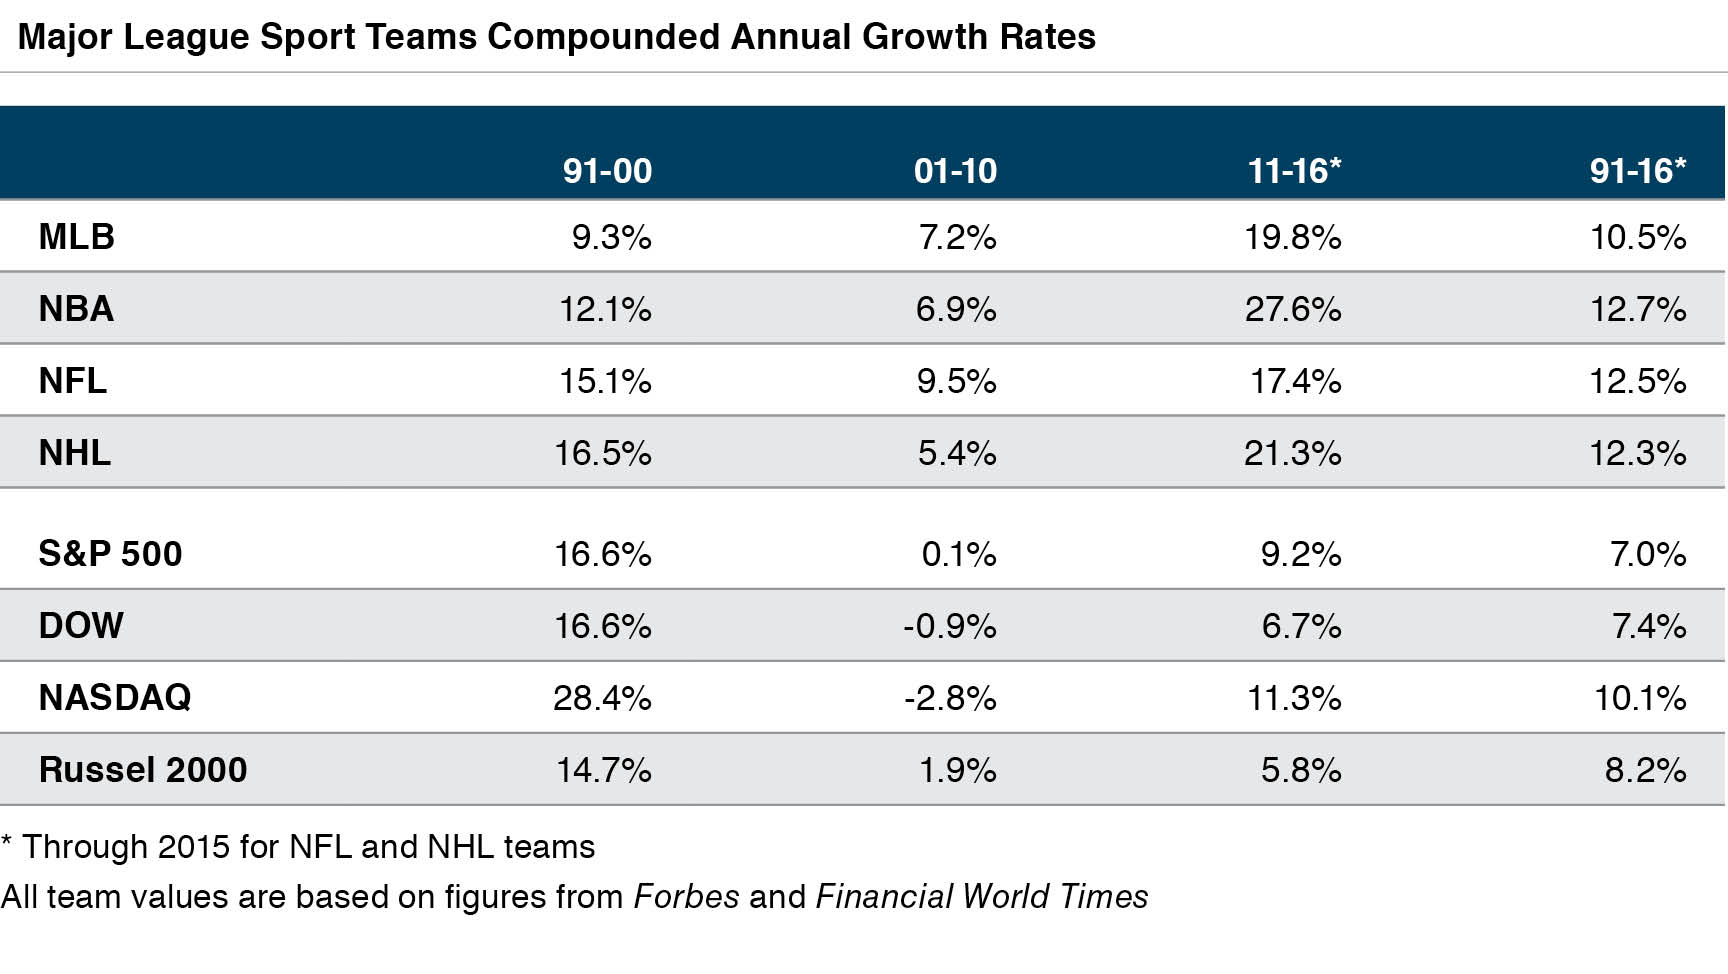 We tracked this data going all the way back to 1991. We then sorted the returns over different decades – the 1990s, the 2000s, and our current decade. We aggregated it for the 25 total years of data.1
We observe that equity markets outperformed league appreciation in the 1990s, but the leagues caught up in the 2000s and 2010s. The biggest reason for the significant increase in the 2000s and the 2010s (among others) is television contracts – specifically, increases in national TV contracts for the NFL and NBA and regional and local contracts for MLB and NHL (and to a lesser degree the NBA as well).
Consider a few examples:
We tracked this data going all the way back to 1991. We then sorted the returns over different decades – the 1990s, the 2000s, and our current decade. We aggregated it for the 25 total years of data.1
We observe that equity markets outperformed league appreciation in the 1990s, but the leagues caught up in the 2000s and 2010s. The biggest reason for the significant increase in the 2000s and the 2010s (among others) is television contracts – specifically, increases in national TV contracts for the NFL and NBA and regional and local contracts for MLB and NHL (and to a lesser degree the NBA as well).
Consider a few examples:
- The NFL had its national TV contract increase dramatically in the last several renewals, most significantly, the most recent one. The 2014 season was the first year of the NFL’s nine-year deal with Fox, CBS, and NBC. The networks will pay about $3.1 billion in rights fees every season or 63% more than the previous TV deal.
- The NBA, which signed a nine-year deal with ESPN and Turner Broadcasting and other networks, had total fees worth $24 billion in 2014. This skyrocketed to $3.6 billion a year, up from about $930 million in the contracts reached in 2007. In addition, NBA teams have benefited from increased local TV rights that have usually doubled or even tripled in annual rights fees in the last 5 years.
- For MLB and NHL teams, the majority of the TV revenue comes from local TV contracts. These contracts have also appreciated substantially in the last five years increasing 3 to 5 times in comparison to the contracts signed 5 to 7 years ago.


