After a slow start, M&A activity among U.S. commercial banks and thrifts picked up to the point where 2018 should look like recent years. Historically, approximately 2% to 4% of the industry is absorbed each year via M&A. Since 2014, the pace has been at or slightly above 4% as a well performing economy, readily available financing, rising stock prices for bank acquirers, and strong asset quality and earnings of would be sellers have supported activity.
There were 140 announced transactions according to S&P Global Market Intelligence through early July, which equates to 2.4% of 5,913 FDIC-insured institutions that existed as of year-end 2017. The average assets per transaction based upon YTD activity was $656 million, which is below the 28 year average of $1.1 billion.
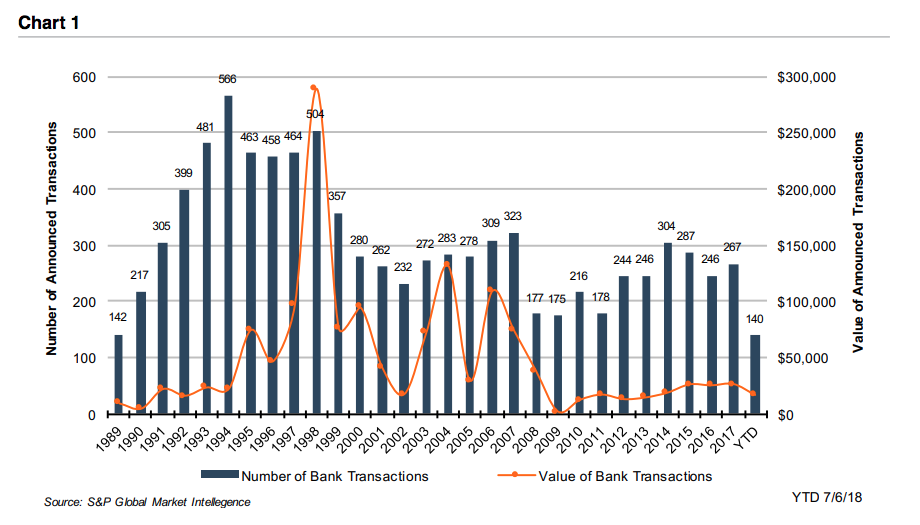 Pricing has trended higher as measured by the average price/tangible book value (P/TBV) multiple, which increased to 172% in 2018 from 164% in 2017 and about 140% in 2014-2016 before the sector was revalued after the national election on November 8, 2016.
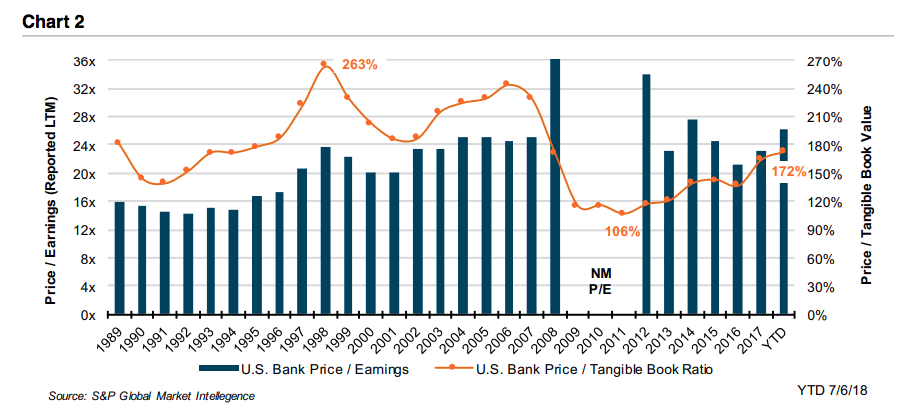
The median P/E based upon trailing 12 month earnings increased to 26x in 2018 from 23x in 2017 and 21x in 2016; however, the 2018 P/E based upon trailing 12 month earnings does not reflect a full year impact of the reduction in the top marginal federal tax rate to 21% from 35% that occurred on January 1. The adjusted P/E assuming the lower tax rate was in effect for 2017, too, is around 20-22x.
Lower tax rates notwithstanding, it appears that buyers are still paying roughly 9-13x pro forma earnings assuming all expense savings are fully realized, a level of pricing that we believe has existed for many years excluding periods when industry fundamentals are stressed. For example, Fifth Third Bancorp (FITB) estimates the $4.6 billion consideration to be paid to MB Financial (MBFI) shareholders equates to 16.4x consensus 2019 earnings and 9.6x assuming all expense savings realized in 2019 (which will not be the case due to the phase-in lag).
Pricing has trended higher as measured by the average price/tangible book value (P/TBV) multiple, which increased to 172% in 2018 from 164% in 2017 and about 140% in 2014-2016 before the sector was revalued after the national election on November 8, 2016.
The median P/E based upon trailing 12 month earnings increased to 26x in 2018 from 23x in 2017 and 21x in 2016; however, the 2018 P/E based upon trailing 12 month earnings does not reflect a full year impact of the reduction in the top marginal federal tax rate to 21% from 35% that occurred on January 1. The adjusted P/E assuming the lower tax rate was in effect for 2017, too, is around 20-22x.
Lower tax rates notwithstanding, it appears that buyers are still paying roughly 9-13x pro forma earnings assuming all expense savings are fully realized, a level of pricing that we believe has existed for many years excluding periods when industry fundamentals are stressed. For example, Fifth Third Bancorp (FITB) estimates the $4.6 billion consideration to be paid to MB Financial (MBFI) shareholders equates to 16.4x consensus 2019 earnings and 9.6x assuming all expense savings realized in 2019 (which will not be the case due to the phase-in lag).
Cash Deals vs. Mix/Stock Deals
Dig deeper and, of course, there is more to the pricing story. The reduction in tax rates has had a material impact on profitability. Depending upon the index bank stocks rose 25-30% in the three months after the national election on November 8, 2016, on the expectation of what has mostly played out: a reduction in corporate tax rates, less regulation, higher short rates and faster economic growth.
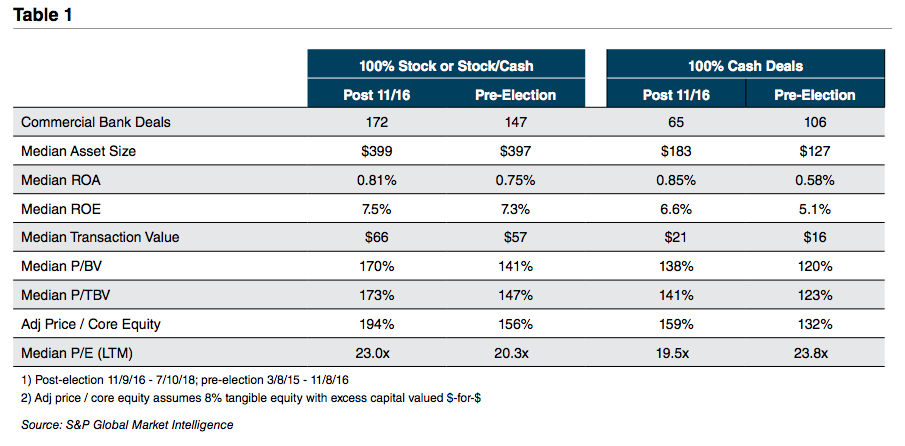 The improvement in public market multiples has supported expansion of M&A multiples when the majority of the consideration consists of the buyer’s common shares. As shown in Table 1, the median P/TBV and P/E ratios for transactions announced in the 20 months since the election were 173% and 23.0x compared to 147% and 20.3x for the 20 months ended November 8, 2016. Multiple expansion is even more pronounced when only 2018 deals are considered because the YTD median P/TBV and P/E multiples are 193% and 25.4x.
Not surprisingly (to us), the median multiples for cash deals did not rise as much, increasing to 141% after the election compared to the 20 month pre-election median of 123%. Cash did not inflate in value over this period like public market bank stock valuations; hence, the only meaningful factor that drove the limited improvement in cash acquisition multiples was the increase in ROE.
In addition, cash activity slowed post-election because buyers and sellers waited to see if would be sellers’ earning power would increase from a reduction in corporate tax rates, which was not confirmed until late 2017. Transactions in which the primary form of consideration consisted of the buyer’s common shares did not have to wait for the tax issue to be resolved because buyer and seller both faced the issue.
The improvement in public market multiples has supported expansion of M&A multiples when the majority of the consideration consists of the buyer’s common shares. As shown in Table 1, the median P/TBV and P/E ratios for transactions announced in the 20 months since the election were 173% and 23.0x compared to 147% and 20.3x for the 20 months ended November 8, 2016. Multiple expansion is even more pronounced when only 2018 deals are considered because the YTD median P/TBV and P/E multiples are 193% and 25.4x.
Not surprisingly (to us), the median multiples for cash deals did not rise as much, increasing to 141% after the election compared to the 20 month pre-election median of 123%. Cash did not inflate in value over this period like public market bank stock valuations; hence, the only meaningful factor that drove the limited improvement in cash acquisition multiples was the increase in ROE.
In addition, cash activity slowed post-election because buyers and sellers waited to see if would be sellers’ earning power would increase from a reduction in corporate tax rates, which was not confirmed until late 2017. Transactions in which the primary form of consideration consisted of the buyer’s common shares did not have to wait for the tax issue to be resolved because buyer and seller both faced the issue.
Small Deals, Larger Deals, and Perhaps Big Deals
M&A is largely a story of the consolidation of the small banks by large community and small regional banks. Two decades ago the theme was the same, but overlaid was the formation of the nationwide and multi-region franchises through mega-mergers such as NCNB/Bank of America and Wells Fargo/Norwest.
Since the financial crisis, activity has mostly been confined to small deals with deal values a fraction of the pre-crisis and especially pre-2000 amounts. Annualized year-to-date deal value is $33 billion, which compares to approximately $26 billion annually during 2015-2017. By comparison, the value of announced transactions in 1997 and 1998 were many multiples greater at $97 billion and $289 billion, respectively.
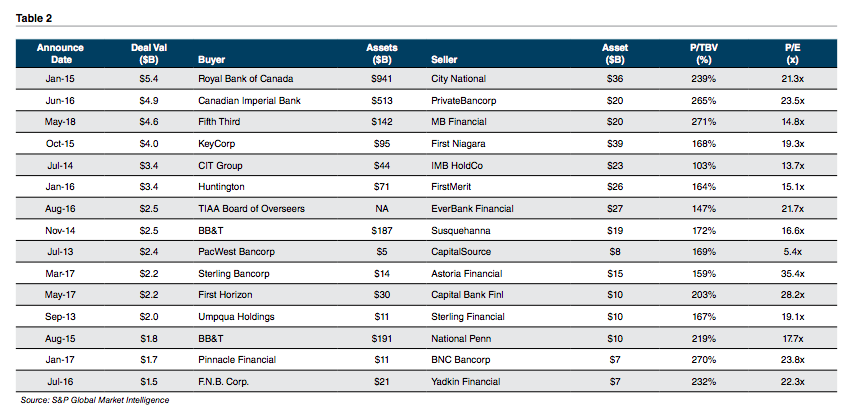
During the past five years, there only have been 10 deals that exceeded $2 billion of consideration and 22 deals in which the consideration exceeded $1 billion. As shown in Table 2, the two largest transactions involved Canadian banks, while three involved the large Ohio-based banks.
 Change may be afoot, however. Fifth Third’s $4.6 billion pending acquisition of MB Financial is its first bank acquisition since 2008, and it was announced a couple of days before President Trump signed into law the Economic Growth, Regulatory Relief, and Consumer Protection Act. Among other things, the financial deregulation law moved the SIFI asset threshold from $50 billion to $100 billion and provided significant relief for institutions such as Fifth Third that fall within the $100 billion to $250 billion asset bucket.
Notably, during the past five years only CIT Group crossed the prior $50 billion SIFI threshold via acquisition, and apparently did so at the urging of regulators who wanted CIT to shore up its deposit funding.
We look for more activity among mid-sized regional banks that are near or over $50 billion of assets; however, deal activity among the very largest banks is off the table given the $250 billion asset threshold for the global SIFI designation and the 10% nationwide deposit market share cap if pierced via acquisition.
The potential fly in the ointment to the robust bank M&A environment is the flattening yield curve and the attendant underperformance of bank stocks this year. If bank stocks lag and valuations compress further, then it may be difficult for buyers to meet inflated seller expectations that rarely take into account downward moves in buyers’ share prices.
Change may be afoot, however. Fifth Third’s $4.6 billion pending acquisition of MB Financial is its first bank acquisition since 2008, and it was announced a couple of days before President Trump signed into law the Economic Growth, Regulatory Relief, and Consumer Protection Act. Among other things, the financial deregulation law moved the SIFI asset threshold from $50 billion to $100 billion and provided significant relief for institutions such as Fifth Third that fall within the $100 billion to $250 billion asset bucket.
Notably, during the past five years only CIT Group crossed the prior $50 billion SIFI threshold via acquisition, and apparently did so at the urging of regulators who wanted CIT to shore up its deposit funding.
We look for more activity among mid-sized regional banks that are near or over $50 billion of assets; however, deal activity among the very largest banks is off the table given the $250 billion asset threshold for the global SIFI designation and the 10% nationwide deposit market share cap if pierced via acquisition.
The potential fly in the ointment to the robust bank M&A environment is the flattening yield curve and the attendant underperformance of bank stocks this year. If bank stocks lag and valuations compress further, then it may be difficult for buyers to meet inflated seller expectations that rarely take into account downward moves in buyers’ share prices.
How We Can Help
The adage banks are sold rather than bought is largely true, meaning most banks transact when the sellers are ready to do so. Sometimes that occurs after years of planning; sometimes it occurs unexpectedly when another institution makes a casual inquiry.
Mercer Capital has over three decades of experience as a financial advisor helping institutions navigate the process as buyer and seller. Even if your board has no interest in selling (or buying) we would be happy to present an overview to your board about the lay of the land as it relates to the public market, M&A market and what actions your board might consider to enhance value. Please call if we can be of assistance.
Originally published in Bank Watch, July 2018.


