Publicly traded BDC discounts are signaling a disconnect between private credit valuations and market-based pricing, raising questions about whether private NAV marks are overstated or simply lagging reality. The failed Blue Owl transaction and rising secondary market activity highlight investor demand for liquidity and skepticism toward “sticky” valuations, as public markets imply meaningful discounts to stated NAVs. While these discounts reflect factors beyond asset values, such as leverage, fees, and sentiment, they still provide a real-time benchmark that valuation professionals cannot ignore. Absent a rebound in BDC prices, persistent gaps between public prices and NAVs indicate that NAVs are too high for public BDCs and private BDCs to the extent private BDCs hold similar loans.
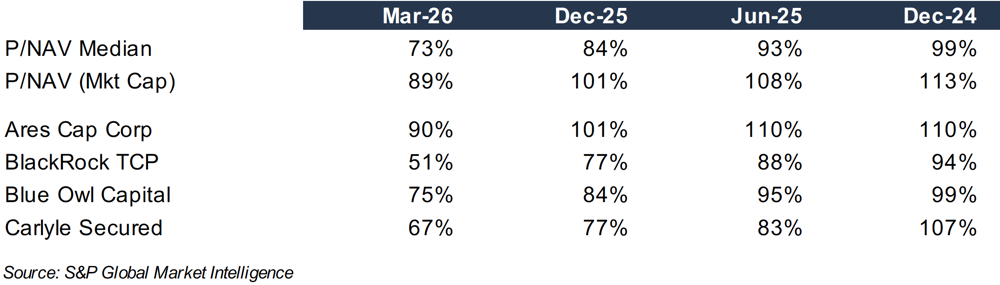
Figure 1: Publicly Traded BDC Price / NAV
The chorus of Doubting Thomas who question private credit and equity marks is growing. The rise of GP-led continuation funds is one marker that funds are unwilling to part with an asset at a, presumably, lower market clearing price via M&A or episodically via an IPO.
Another marker is a growing tension in private credit markets that has been fanned by sensationalist media coverage following the gating of multiple interval funds that limit quarterly redemptions at NAV to 5% of assets and multiple high profile credit blow-ups.
The credit manager that has drawn the most attention is Blue Owl Capital Inc. (NYSE:OWL) after it was forced to call off a merger of Blue Owl Capital Corporation II (“BOCC”), a private business development company (“BDC”), with publicly traded Blue Owl Capital Corporation (NYSE:OBDC).
The aborted transaction highlighted multiple issues:
The desire for liquidity by investors who knowingly invested in an illiquid security;
A growing gap between private asset marks and public market pricing for comparable securities;
Whether the sizable discount that most BDCs trade to NAV signals an emerging credit cycle that is not reflected in private NAV marks; and
What constitutes a fair exchange ratio in a stock swap merger.
Blue Owl unwittingly became the focal point of questions about private asset marks last year when it arranged for privately held BOCC to merge with its affiliated publicly traded BDC and thereby create liquidity for shareholders, many of whom invested in BOCC through financial advisors that promoted private BDCs as a high yielding investment with low NAV volatility. Some have called this “volatility laundering.”
The exchange ratio was based on each company’s NAV. Outwardly this was reasonable since both BDCs largely held the same assets. However, OBDC was trading at a ~20% discount to NAV when the deal was terminated in November 2025. If BOCC II shareholders wanted immediate liquidity, then they would have to accept a 20% discount to NAV that today is 25%. Otherwise, the shareholders would be forced to wait for OBDC’s shares to possibly recover to NAV to cash-out.
We do not know how much anguish the BOCC board faced in approving the merger agreement or what hoops BOCC’s financial advisor jumped through to issue its “fairness” opinion, but basing the exchange ratio on NAV-to-NAV was odd when the market said NAV overstated the value of the assets.
There are a couple of caveats to note, however. One is that OBDC is levered, and leverage magnifies discounts to NAV when the market assesses that asset value are less than the marked value and vice versa. Also, some amount of the discount to NAV should reflect management fees if the calculated NAV does not factor in such fees.
Nonetheless, publicly traded BDCs offer a market-based referendum on private credit valuations. As shown in the chart on the top of page 8, a widening discount to NAV reflect investor concerns around credit quality, liquidity, and ultimately the realizability of stated NAVs. Some may also reflect lower expected distributions as SOFR declined in the fall with 75bps of Fed rate cuts.
The catalyst bringing this issue to the forefront is Boaz Weinstein, the CEO of Saba Capital, who has offers for stakes in multiple private credit funds at a 20%–35% discount to stated NAV. If the offer is oversubscribed, he over bid and his return may not be great if a flood of bids reflects expectations for lower future NAVs. Weinstein indicated he “would get in line with everyone else” and tender shares to the fund for NAV each quarter subject to 5% redemption caps.
The saga supports a basic premise: if an asset cannot be readily sold at NAV, then NAV is not fair value.
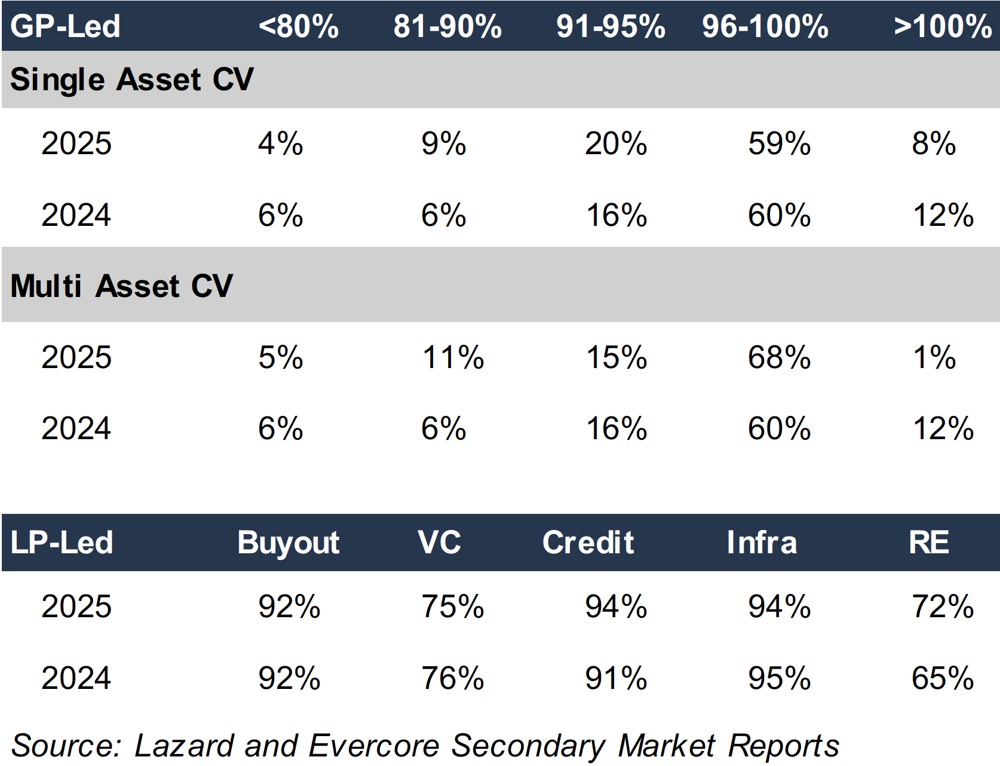
This tension mirrors what we observe in secondary markets more broadly. Private market transactions, whether LP-led secondaries or GP-led continuation funds, often occur at discounts to NAV, reflecting a combination of illiquidity, uncertainty, and differences between modeled value and executable price. The fact that these discounts persist across cycles suggests they are not anomalies but structural features of private markets.
Figure 2: PE Secondary Price / NAV
The key question, then, is how much weight should be given to public market signals when marking private assets.
There are good reasons not to solely consider indications of value derived from public market prices. Public BDCs embed factors beyond underlying asset value, including management fees, leverage structures, tax considerations, and investor sentiment. Discounts may also reflect technical factors such as retail flows or closed-end fund dynamics. In stressed environments, public markets can overshoot to the downside, just as they can overshoot to the upside.
However, dismissing public market data entirely is equally problematic. Public BDC pricing represents continuous, arms-length transactions among informed participants. It incorporates forward-looking expectations about credit losses, refinancing risk, and the cost of liquidity.
The current environment suggests that private marks are lagging the price signals from the public markets. This divergence raises a broader issue: whether “sticky” marks are themselves contributing to market instability.
If investors believe NAVs are overstated, or even just slow to adjust, they may seek liquidity preemptively. The result is a feedback loop similar to the “reflexivity” described in the context of semi-liquid funds: redemption requests increase, liquidity becomes constrained, and secondary transactions occur at discounts that reinforce concerns about valuation.
Recent developments in private credit markets support this view. Rising redemption requests, gating provisions, and increased secondary activity all point to a growing demand for liquidity. In this context, discounts observed in public BDCs and secondary transactions may be less a sign of dislocation and more an early indication of where private marks will ultimately converge.
None of this implies that private credit is fundamentally mispriced or that NAVs are broadly incorrect. Loans will either repay at par or they will not. Over time, realized outcomes, not interim marks, will determine returns. But the path to those outcomes matters, particularly for investors with liquidity needs or finite investment horizons.
For valuation professionals, public market data alone should not dictate private marks, but it cannot be ignored. It provides a real-time check on assumptions embedded in valuation models, particularly around discount rates, recovery expectations, and liquidity.