Valuation Lessons from Credit Union & Bank Transactions
In recent years, credit unions have been increasingly active as acquirers in whole bank and branch transactions. This session focuses on the top considerations for credit unions when assessing and valuing bank and branch franchises in the current environment.
For bankers, this session should enhance your knowledge regarding how credit unions identify potential targets, assess potential opportunities and risks of a bank or branch acquisition, and ultimately determine a valuation range for target banks and branches.
This session, presented as part of the 2021 Acquire or Be Acquired Conference sponsored by Bank Director, addresses these issues.
Understand the Discount Rate Used in a Business Valuation
What Comprises the Discount Rate and What’s a Reasonable Range?
The discount rate is the key factor in business valuation that converts future dollars into present value as of the valuation date. For a layperson, the discount rate utilized in a business valuation may appear to be subjective and pulled out of a hat. However, the discount rate is a crucial component of the valuation formula and must be assessed for the specific company at hand.
Using any method under the income approach, the valuation formula comes down to three things:
- Ongoing (or expected) cash flow (or other measure of earnings)
- Discount rate
- Growth rate
In valuations that “feel” too high or too low, one of the potential culprits may be an aggressive discount rate, either on the high or low end. There are several generally accepted methodologies to build up discount rates employed by valuation analysts. In this article, we will examine the various components of a discount rate. Then, we will relate the discount rate to rates of return of other investments that should provide a commonsense road map for what is reasonable and what is not.
What Is a Discount Rate?
Companies with larger cash flows are likely to be more valuable, as are those with cash flows that are growing at a faster rate. Each of these statements makes perfect sense. Now, if the future cash flows are less certain, they are deemed to be riskier, which reduces the value of the business. The discount rate “discounts” future cash flows to a present value. As we have all heard, “a dollar today is better than a dollar tomorrow.” Measuring the present value of future earnings allows us to develop a value for a business today.
The discount rate goes by many names including “equity discount rate,” “return on investment,” “cost of capital,” and “rate of return.” For companies that use debt, the appropriate way to discount cashflows may be the weighted average cost of capital, or “WACC.” Thinking about a discount rate as a rate of return is likely the most intuitive approach.
Returns to an equity investor come after all other parties have been paid. Debt capital providers are paid before equity capital providers, typically at a fixed or floating interest rate (for example, a company’s line of credit could be 4.0% fixed rate or vary, such as 1% over the prime rate). After generating revenue, paying expenses and taxes, and reinvesting funds needed in the business, any remaining cash flow is shared by the equity investors. Because equity investors come last, they require the highest rate of return in order to provide equity capital to a business. Intuitively, this explains why the cost of equity, or “discount rate,” is higher than the cost of debt, or interest rate.
How to Build Up a Discount Rate
Before we delve into what is reasonable and what is not, one must first understand the components of a discount rate as these help the attorney understand how an appraiser estimates this rate. We describe the development of an equity discount rate with a description of each component below.
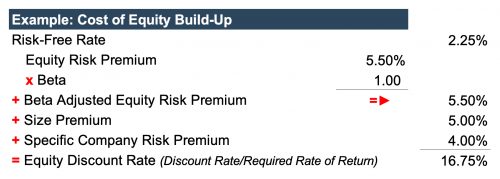
Risk-Free Rate: As alluded to previously, we would all prefer a dollar today over a dollar tomorrow, which both removes the uncertainty of receipt and quells any potential concerns about lost purchasing power from rising prices. To build up the discount rate, we begin with a base rate called the “risk-free rate,” which compensates for the time value of money. An example of a risk-free rate is the 20-Year Treasury Bond yield as of the valuation date. If an appraisal uses an alternative figure that is materially different than the prevailing rate, the assumption would likely require justification.
Equity Risk Premium: Next, to capture generic market risk for the equity market, appraisers employ an “equity risk premium,” frequently in the range of 4.0% to 7.0%, which captures what an investor would expect for an investment in the equity market over a less risky investment like the bond market. Again, something out of this range would likely require justification. [1]
Beta: The equity risk premium is then multiplied by a selected beta. The beta statistic measures a company’s exposure to market risks, with a beta of 1.0 indicating typical market risk. Low beta companies or industries are less correlated with market risk, while high beta companies are more exposed to market risk. For example: auto dealers and airlines tend to ebb and flow with the economy, doing well when the market is good and declining when economic activity contracts, meaning they tend to have betas of 1.0 or higher. In contrast, grocery stores tend to have a beta below 1.0. When the economy contracts, consumers increase their consumption at grocery stores instead of restaurants to save money. Consumers also need toilet paper regardless of the economic environment, and companies that sell such durable goods (like grocery stores) tend to be lower beta companies.
To this point, we have built up the equity discount rate under the Capital Asset Pricing Model (“CAPM”) for a diversified equity market investment.[2] The risk-free rate plus the equity risk premium (assuming a beta of 1.0) gives a rate of return of approximately 7.0% to 8.0%. This should sound familiar because money managers and retirement planners frequently say equity investors should anticipate investment returns on the order of 7.0%, or something in this range. While Mercer Capital makes no such investment advice, this is a reasonable consideration for large, diversified equity portfolios in the context of building up a discount rate for a smaller private company. However, in recognition of the greater risks inherent in privately held smaller companies, business valuation analysts frequently consider two other sources of risk premia: size and specific company.
Size Premium: Smaller companies tend to be subject to greater issues with concentration and diversification. Smaller companies also tend to have less access to capital, which tends to raise the cost of capital. To compensate for the higher level of risks as compared to the broad larger equity market, appraisers frequently add a premium of approximately 3.0% to 5.0% (or more, for very small businesses) to the discount rate when valuing smaller companies. To get an idea of reasonableness, we can consider the following example. A company valued at over $200 million may seem large, but it is actually relatively small when compared to most publicly traded companies. As such, a size premium would still apply, albeit on the lower end. Valuation analysts source these size premiums from data which provides empirical evidence in support of risks associated with smaller size. This data is updated annually, and providers such as Duff & Phelps are frequently cited.
Specific Company Risk Premium: The final component of a discount rate is the specific company risk premium. This represents the “risk profile” specific to the individual subject company above and beyond the factors above – i.e., what is the required return an investor requires to invest in said company over any other investment?
To illustrate with an example, a soon-to-retire CEO of a small business maintains all client relationships. In assessing the potential risk(s) to the business, we would inquire about and assess the risk of clients leaving when the CEO retires. In addition to the risk of losing clients, there are other risks associated with the departure of a key executive. Valuation analysts refer to these risks as “key person risk,” or “key person dependency.” We would also assess depth of other management and succession planning. A few additional examples, but certainly not all, of company specific risk are shown below:
-
- Customer/Supplier Concentration: If the ongoing level of earnings/cash flow is heavily dependent on one key customer/vendor, and the loss of said customer/supplier would lead to significant revenue loss, a risk premium is appropriate.
- Product Diversification: Does the company reap sales from a one hit wonder product, or are other product offerings available that diversify this risk?
- Product Evolution/Research & Development: Is there research & development to keep the products evolving with consumer demands and technological advancements?
- Geographic Concentration: If a company solely operates in one city or geographic region, the company could suffer if the local economy lags the growth of the national economy. Having operations in multiple locales would help reduce this risk. Also, concentration may create a ceiling to potential growth and expansion.
- Earnings Volatility: Do earnings change significantly from year to year? If so, an investor in such a company would likely require a higher return to compensate for the uncertainty. (Note: it is important that the valuation analyst is cautious and does not double count risk considering the selected earnings stream. For example, if a company has one down year but the analyst includes it in a historical average, it may not be appropriate to add additional risk for earnings volatility. In this case, the risk may already be captured in giving weight to it in the analysis of ongoing earnings.)
- Competitive Environment: Are there many competitors, and how does the company perform in comparison to those competitors? Does the company offer goods or services which are differentiated?
When determining a specific company risk premium, some analysts may choose to assess a company through a SWOT analysis – strengths, weakness, opportunities, and threats of the company – relative to past performance, performance of its peers, the industry, and the broader economy. Put simply, what is the risk profile of the business? If there are risks (or lack thereof) that are specific to said company, how much higher or lower does the discount rate have to be for an investor to be willing to invest in this company instead of an alternative company or investment?
The specific company risk premium is frequently an area where experts may differ due to selection of varying levels of risk for a company. While understanding what “feels” reasonable here takes nuance and experience, a valuation analyst should provide the attributes which support the selected risk premium.
What Is a Reasonable Discount Rate and What’s in Range?
Following our equity build-up example in Figure 1, adding a size premium of 5.0%, and specific company of 4.0% to an equity market return of 7.75% leads to a discount rate of 16.75%. For a smaller, riskier company, this could be higher; however, for a larger, less risky company with consistent history of strong earnings, this could be lower. An equity discount rate range of 12% to 20%, give or take, is likely to be considered reasonable in a business valuation. This is about in line with the long-term anticipated returns quoted to private equity investors, which makes sense, because a business valuation is an equity interest in a privately held company. Again, while many of the specific terms utilized in the build-up of a discount rate may be new to attorneys, rates of return quoted in that context are more familiar to many.
A business appraisal with a discount rate below 10% likely deserves more scrutiny, but it may be reasonable if the company is sufficiently large, diversified, well-capitalized, less exposed to market risk, has a strong management team and succession plan, and generates consistent cash flow and/or growth.
On the other end of the spectrum, a company with a discount rate in excess of 25% may be undervalued, and such a discount rate similarly deserves justification. However, there could be numerous reasons why this is ultimately reasonable given specific facts and circumstances. Early stage/start-up companies without sufficient history of earnings and performance would likely have a high discount rate. While there could be certain instances where a discount rate above 25% may be reasonable, a proper appraisal will enumerate in detail why such a large discount rate is warranted.
Conclusion
In financial situations that may be scrutinized by courts and other potential adversaries, an expert’s financial, economic, and accounting experience and skills are invaluable. These complex analyses are best performed by a competent financial expert who will be able to define and quantify the financial aspects of a case and effectively communicate the conclusion.
[1] Mercer Capital regularly reviews a spectrum of studies on the equity risk premium and also conducts its own study. Most of these studies suggest that the appropriate large capitalization equity risk premium lies in the range of 4.0% to 7.0%.
[2] W.F. Sharpe, “Capital Asset Prices: A Theory of Market Equilibrium Under Conditions of Risk,” Journal of Finance, Vol. 19 (1964): pp. 425-442.
Should You Diversify Your Family Business?
Travis W. Harms, CFA, CPA/ABV, presented the session “Should You Diversify Your Family Business” at Transitions Spring Conference 2021 on March 24, 2021. This conference was sponsored by Family Business Magazine.
Diversification — such as entry into new lines of business, new geographies, or new markets — can protect your family enterprise from economic downturns. In this presentation, he provides an overview of what is involved in diversifying a family business and the best way to calculate whether it’s the right move for the business.
What Attorneys Should Know About Valuations of Closely Held Businesses
Karolina Calhoun, CPA/ABV/CFF, presented the session “What Attorneys Should Know About Valuations of Closely Held Businesses” at the Tennessee Trial Lawyers Association’s “Memphis Family Law Seminar 2021” on March 18, 2021.
The valuation of a business is a complex process, requiring specialized professionals who apply the same finance & economic fundamentals used by public companies to evaluate and price private companies. This presentation delves into the processes and methodologies used in a valuation and provides examples of scenarios that may invoke the need for valuation services.
Mortgage Banking Lagniappe
2020 was a tough year for most of us. Schools and churches closed, sports were cancelled, and many lost their jobs. There were a select few, however, that thrived during 2020. Jeff Bezos and Elon Musk saw a meteoric rise in their personal net worth over the past 12 months. Mortgage bankers are another group showered with unexpected riches last year (and apparently this year).
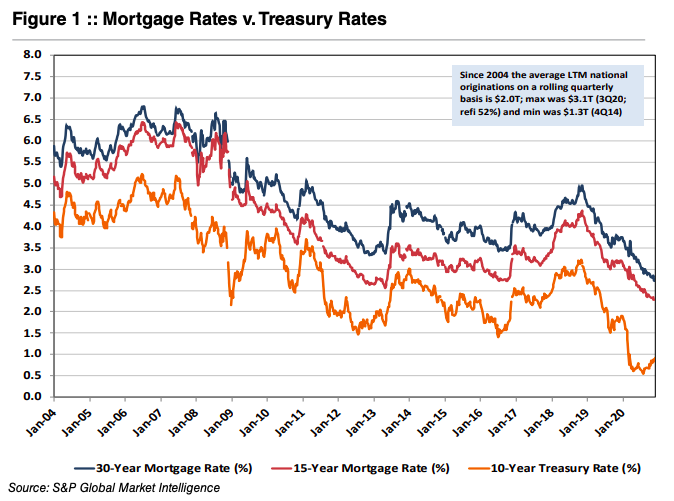
As shown in Figure 1, long-term U.S. Treasury and mortgage rates have been in a long-term secular decline for about four decades. Last year, long-term rates fell to all-time lows because of the COVID induced recession after having declined modestly in 2019 following too much Fed tightening in 2018. The surprise was not an uptick in refinancing activity, but that it was accompanied by a strong purchase market too. Housing was and still is hot; maybe too hot.
Overlaid on the record volume (the Mortgage Bankers of America estimates $3.6 trillion of mortgages were originated in 2020 compared to $2.3 trillion in 2019 and $1.7 trillion in 2017 and 2018) was historically high gain on sale (“GOS”) margins. The industry was capacity constrained after cutting staff in 2018 when rates were then rising.
Private equity and other owners of mortgage companies set their eyes on the public markets after many companies attempted to sell in 2018 with mixed success at best. During the second half of 2020, Rocket Mortgage ($RKT) and Guild Mortgage ($GHLD) made an initial public offering and began trading while seven other nonbank mortgage companies have either filed for an IPO or announced plans to do so. Also, United Wholesale Mortgage ($UWMC) went public by merging with a SPAC.
The inability of several (or more) mortgage companies to undergo an IPO at a price that was acceptable to the sellers has an important message. The industry was accorded a low valuation by Wall Street on presumably peak earnings even though many mortgage companies will produce an ROE that easily exceeds 30%. The assumption is that earnings will decline because rates will rise and/or more capacity will reduce GOS margins.
While it is likely 2020 will represent a cyclical peak, no one knows how steep (or gentle) the descent will be and how deep the trough will be. Mortgage companies may produce 20% or better ROEs for several years. One may question the multiple to place on 2020 earnings, but book value could double in three or four years if conditions remain reasonably favorable.
Community and regional banks with mortgage operations have benefitted from the mortgage boom, too. Although various bank indices were negative for the year, it could have been much worse given investor fears surrounding credit losses and permanent impairment to net interest margins given the collapse in rates. In a sense, outsized mortgage banking revenues funded reserve builds for many banks and masked revenue weakness attributable to falling NIMs.
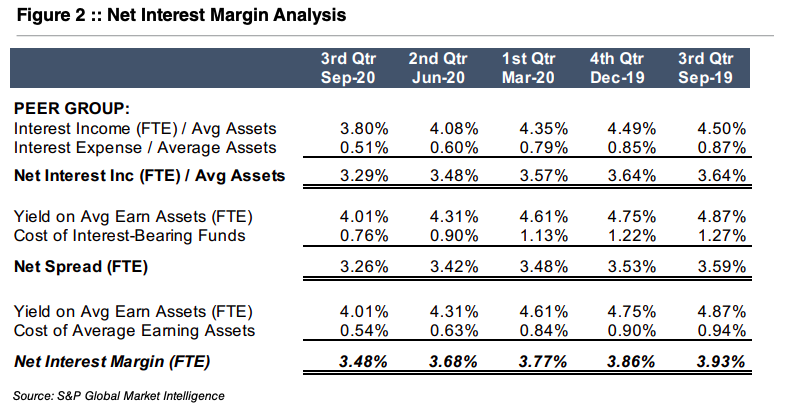
The average NIM for banks in the U.S. with assets between $300 million and $1 billion as of September 30, 2020 is shown in Figure 2. The NIM fell 45bps from 3Q19 to 3Q20 due to multiple moving pieces but primarily reflected an increase in liquid assets because deposits flooded into the banking system and because the reduction in the yield on loans and securities was greater than the reduction in the cost of funds.
Unless the Fed is able (and willing) to raise short-term policy rates in the next year or two, we suspect loan yields will grind lower as lenders compete heavily for assets with a coupon (i.e., loans) because liquidity yields nothing and bonds yield very little. Deposit costs will not offset because rates are or soon will be near a floor. Fee income and expense management are more critical than ever for banks to maintain acceptable profitability. When analyzing the same group of banks (assets $300M – $1B), banks with higher GOS revenues as a percentage of total revenue tended to be more profitable. As shown in Figure 3, median profitability was ~15% greater in the trailing twelve months for banks more engaged in mortgage activity than those that were not.
Selling long-term fixed-rate mortgages for most banks is a given because the duration of the asset is too long, especially when rates are low. The decision is more nuanced for 15-year mortgages with an average life of perhaps 6-7 years. With loan demand weak and banks extremely liquid, most banks will retain all ARM production and perhaps some 15-year paper as an alternative to investing in MBS because yields on originated paper are much better.
As for 30-year mortgages, net production profits for 3Q20 increased above 200bps according to the MBA for the first time since the MBA began tracking the data in 2008. Originating and selling long-term fixed rate mortgages has been exceptionally profitable in 2020.
Mortgage banking in the form of originations is a highly cyclical business (vs servicing); however, it is a counter-cyclical business that tends to do well when the economy is struggling and therefore core bank profitability is under pressure. We have long been observers of the mortgage banking conundrum of “what is the earnings multiple?” It is a tougher question for an independent mortgage company compared to a bank where the earnings are part of a larger organization. Even when outsized mortgage banking earnings may weigh on a bank’s overall P/E, mortgage earnings can be highly accretive to capital.
In the February issue of Bank Watch, we will explore how to value a mortgage company either as a stand-alone or as a subsidiary or part of a bank to understand in more detail the true valuation impacts of mortgage revenue.
Originally appeared in Mercer Capital’s Bank Watch, January 2021.
Mortgage Banking Lagniappe (Part II)
The January Bank Watch provided an overview of the mortgage industry and its importance in boosting bank earnings in the current low-rate environment. As we discussed, mortgage volume is inversely correlated to interest rates and more volatile than net interest income. In this article, we discuss key considerations in valuing a mortgage company/subsidiary, including how the public markets price them.
Valuation Approaches
Similar to typical bank valuations, there are three approaches to consider when determining the value of a mortgage company/subsidiary: the asset approach, the market approach, and the income approach. However, since the composition of both the balance sheet and income statement differ from banks, several nuances arise.
Asset Approach
Asset based valuation methods include those methods that write up (or down) or otherwise adjust the various tangible and/or intangible assets of an enterprise. For a mortgage company, these assets may include mortgage servicing rights (“MSR”). The fair value of the MSR book is the net present value of servicing revenue minus related expenses, giving consideration to prepayment speeds, float, and servicing advances. MSR fair value tends to move opposite to origination volume. For example, MSR values tend to increase in periods marked by low origination activity. Other key items to consider include any non-MSR intangible assets, proprietary technology, funding, relationships with originators and referral sources, and the existence of any excess equity.
Market Approach Market
methods include a variety of methods that compare the subject with transactions involving similar investments, including publicly traded guideline companies and sales involving controlling interests in public or private guideline companies. Historically, publicly traded pure-play mortgage companies were a rare breed; however, the COVID-19 mortgage boom has produced several IPOs, and others may follow. There are many publicly traded banks that derive significant revenues from mortgage operations, especially in this low-rate environment.
The basic method utilized under the market approach is the guideline public company or guideline transactions method. The most commonly used version of the guideline company method develops a price/earnings (P/E) ratio with which to capitalize net income. If the public company group is sufficiently homogeneous with respect to the companies selected and their financial performance, an average or median P/E ratio may be calculated as representative of the group. Other activity-based valuation metrics for the mortgage industry include EBITDA, revenues, or originations.
Another relevant indicator includes price/tangible book value as investors tend to treat tangible book value as a proxy for the institution’s earnings capabilities. The key to this method lies in finding comparable companies with a similar revenue mix (high fee income) and profitability.
When examining the public markets, there are generally two types of companies that can be useful in gathering financial and valuation data: banks emphasizing mortgage activities and non-bank mortgage companies.
Group 1: Banks with Mortgage Revenue Emphasis
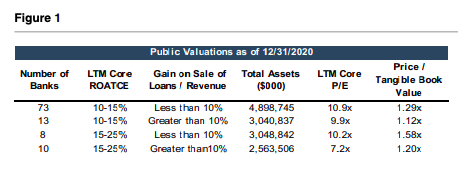
Figure 1 details the first step in identifying a group of banks with significant mortgage operations. First, financial data from the most recently available quarter (4Q20) regarding banks with assets between $1 billion and $20 billion were identified. Once that broad group of banks is identified, it is then important to segment the group further to identify those with significant gain on loan sales as a proportion of revenue and particularly those with higher than typical mortgage revenues/originations as opposed to SBA or PPP loan originations.
Group 2: Non-Bank Mortgage Companies
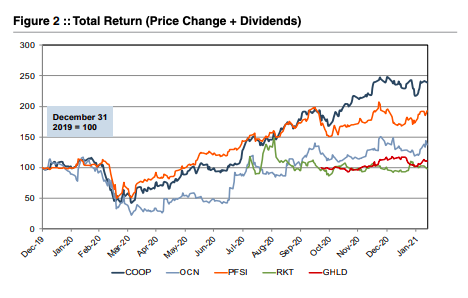
Non-bank mortgage companies found favor with the public markets in 2020 as beneficiaries of the sharp reduction in mortgage rates. In 2021 investor sentiment has faltered due to the impact of rising long-term rates on consensus earning estimates. Several companies undertook IPOs, while another company went public via merging with a SPAC. This expanded the group of non-bank mortgage companies from which to derive valuation multiples and benchmarking information. Figure 2 includes total return data for non-bank mortgage companies.
Notable transactions include the following: Rocket Mortgage (NYSE: RKT) raised $1.8 billion via an IPO at an approximate $36 billion valuation in August; Guild Holdings (NASDAQ: GHLD) raised ~$98 million in a November IPO; United Wholesale Mortgage (NYSE: UWM) went public in the largest SPAC deal in history (~$16 billion) that closed in 2021; and Loan Depot (NYSE: LDI) went public during February by raising $54 million.
Other pending IPOs based upon public S-1 filings include Caliber Home Loans and Better.com. Amerihome Mortgage Company had filed a registration statement but apparently obtained better pricing through an acquisition by Western Alliance Bancorp (NYSE: WAL) during February that was valued at ~ $1.0 billion at announcement, or about 1.4x the company’s tangible book value.
While this activity is positive for mortgage companies, the IPOs were downsized in terms of the number of shares sold with pricing below the initial target range or at the low end of the range as investors hedged how far and how fast earnings could fall in a rising rate environment.
For guideline M&A transactions, the data is often limited as there may only be a handful of transactions in a given year and even fewer with reported deal values and pricing multiples. However, meaningful data can sometimes be derived from announced transactions with transparent pricing and valuation metrics.
After deriving the “core” earnings estimate for the mortgage company as well as reasonable valuation multiples, other key valuation elements to consider include: any excess equity, mortgage servicing rights, unique technology solutions that differentiate the company, origination mix (refi vs. purchase; retail vs. correspondent or wholesale), geographic footprint of originations/ locations, and risk profile of the balance sheet and originations (for example, agency vs. non-agency loans).
Income Approach
Valuation methods under the income approach include those methods that provide for the direct capitalization of earnings estimates, as well as valuation methods calling for the forecasting of future benefits (earnings or cash flows) and then discounting those benefits to the present at an appropriate discount rate. For banks, the discounted cash flow (“DCF”) method can be a useful indication of value due to the availability and reliability of bank forecast/capital plans. However, due to the volatile and unpredictable nature of mortgage earnings, this method faces challenges when applied to a mortgage company. In certain situations, the DCF method may not be utilized due to uncertainties regarding the earnings outlook. In others, the DCF method may be applied with the subject company’s level of mortgage origination activity tied to a forecast for overall industry originations and historical gain on sale margins.
Given the potentially limited comparable company data and the difficulty associated with developing a long-term forecast for a DCF analysis, the single period income capitalization method may be useful.
This method involves determining an ongoing level of earnings for the company, usually by estimating an ongoing level of mortgage origination activity and a pretax margin and capitalizing it with a “cap rate”. The cap rate is a function of a perpetual earnings growth rate and a discount rate that is correlated with the entity’s risk. Whereas we would likely use recent earnings in the market approach, in the income capitalization method it makes sense to normalize earnings using a longer-term average, which considers origination and margin levels over an entire mortgage operating cycle.
Mortgage earnings and margins are cyclical. Due to the volatile nature of mortgage earnings, a higher discount rate is normally used. Therefore, a mortgage company’s earnings typically receive a lower multiple than a bank’s more stable earnings.
Conclusion
A mortgage subsidiary can be a beneficial tool for community banks to increase earnings and diversify revenue. This strategy, while clearly beneficial now, can be utilized throughout the business cycle. As rates fall and net interest income faces pressure, gains on the sale of loans should increase (and vice versa) to create counter-cyclical revenues. As we’ve discussed, the inherently volatile income from a mortgage subsidiary is not usually treated equally to net interest income in the public markets. Although, when it comes to price/tangible book value multiples, profitability is critical whether it is driven by mortgage activity or not. There are many factors to consider in valuing a mortgage company.
If you are considering this line of business to diversify your bank or desire a valuation of a mortgage operation, feel free to reach out for further discussion.
Originally appeared in Mercer Capital’s Bank Watch, February 2021.
Personal Goodwill: An Illustrative Example of an Auto Dealership
This article discusses important concepts of personal goodwill in divorce litigation engagements. The discussion relates directly to several divorce litigation cases involving owners of automobile dealerships. These real life examples display the depth of analysis that is critical to identifying the presence of personal goodwill and then estimating or allocating the associated value with the personal goodwill. The issues discussed here pertain specifically to considerations utilized in auto dealer valuations, but the overall concepts can be applied to most service-based industries.
It is important that the appraiser understands the industry and performs a thorough analysis of all relevant industry factors. It is also important to determine how each state treats personal goodwill. Some states consider personal goodwill to be a separate asset, and some do not make a specific distinction for it and include it in the marital assets.
Personal goodwill was an issue in several of our recent litigated divorce engagements. It is more prevalent in certain industries than others and varies from matter to matter. However, although there are several accepted methodologies to determine personal goodwill, there is not a textbook that discusses where it exists and where it doesn’t. Before any attempts to measure and quantify it, an important question to ask is “Does it exist?” Often with ambiguous concepts like personal goodwill, the adage “you know it when you see it” is most appropriate.
In this article, we examine personal and enterprise goodwill using a specific fact pattern unique to the auto dealership industry. Beyond this illustrative example, the analyses can be applied in other industries, but must be considered carefully for the unique facts and circumstances of each matter.
What Is Personal Goodwill?
Personal goodwill is value stemming from an individual’s personal service to a business and is an asset that tends to be owned by the individual, not the business itself. Personal goodwill is part of the larger bucket of an intangible asset known as goodwill. The other portion of goodwill, referred to as enterprise or business goodwill, relates to the intangible asset involved and owned by the business itself.1
Commercial and family law litigation cases aren’t typically governed by case law resulting from Tax Court matters and can differ by jurisdiction, but Tax Court decisions offer more insight into defining the conditions and questions that should be asked in an evaluation of personal goodwill. One seminal Tax Court case on personal goodwill is Martin Ice Cream vs. Commissioner.2 Among the Court’s discussions and questions to review were the following:
- Do personal relationships exist between customers/suppliers and the owner of a business?
- Do these relationships persist in the absence of formal contractual relationships?
- Does an owner’s personal reputation and/or perception in the industry provide intangible benefit to the business?
- Are practices of the owner innovative or distinguishable in his or her industry, such as the owner having added value to the particular industry?
Another angle with which to evaluate the presence of personal goodwill, specifically to professional practices, is provided in Lopez v. Lopez.3 Lopez suggests several factors that should be considered in the valuation of professional (personal) goodwill as:
- The age and health of the individual;
- The individual’s demonstrated earning power;
- The individual’s reputation in the community for judgement, skill, and knowledge;
- The individual’s comparative professional success
- The nature and duration of the professional’s practice as a sole proprietor or as a contributing member of a partnership or professional corporation.
Why Is Personal Goodwill Important?
Many states identify and distinguish between personal goodwill and enterprise goodwill. Further, numerous states do NOT consider the personal goodwill of a business to be a marital asset for family law cases. For example, a business could have a value of $1 million, but a certain portion of the value is attributable and allocated to personal goodwill. In this example, the value of the business would be reduced for personal goodwill for family law cases and the marital value of the business would be considered at something less than the $1 million value.
How Applicable/Prevalent Is Personal Goodwill in the Auto Dealer Industry?
In litigation matters, we always try to avoid the absolutes: always and never. The concept of personal goodwill is easier identified and more prevalent in service industries such as law practices, accounting firms, and smaller physician practices. Does that mean it doesn’t apply to more traditional retail and manufacturing industries? In each case, the fundamental question that should be first answered is “Is this an industry or company where personal goodwill could be present?”
For the auto dealer industry, the principal product, outside of the service department, is a tangible product – new and used vehicles. In order for personal goodwill to be present in this industry, the owner/dealer principal would have to exhibit a unique set of skills that specifically translates to the heightened performance of their business.
We are all familiar with regional dealerships possessing the name of the owner/dealer principal in the name of the business. However, just having the name on a business doesn’t signify the presence of personal goodwill. An examination of the customer base would be needed to justify personal goodwill. It would be more difficult to argue that customers are purchasing vehicles from a particular dealership only for the name on the door, rather than the more obvious factors of brands offered, availability of inventory, convenience, etc. An extreme example might be having a recognized celebrity as the name/face of the dealership, but even then, it would be debated how materially that affects sales and success.
Auto dealers attempt to track performance and customer satisfaction through surveys, which could provide an avenue to determine this value (if, for example, factors that influenced the decision to buy listed Joe Dealer as being their primary motivation) though this is still unlikely and would be subject to debate.
Another consideration of the impact of a dealer’s name on the success/value of the business would be how actively involved the owner/dealer principal is and how directly have they been involved with the customer in the selling process. Simply put, there should be higher bars to clear than just having the name in the dealership for personal goodwill to be present. In more obvious examples of personal goodwill in professional practices, the customer usually interacts directly with the owner/professional such as with the attorney or doctor in our previous examples. How often does the customer of an auto dealership come into contact or deal directly with the owner/dealer principal, or do they generally engage with the salespeople, service manager, or the general manger?
Another factor that often helps identify the existence of personal goodwill is the presence of an employment agreement and/or non-compete agreement. The prevailing thought is that an owner of a business without these items would theoretically be able to exit the business and open a similar business and compete directly with the prior business. Neither of these items typically exist with an owner of an auto dealership. However, owners of auto dealerships must be approved as dealer principals by the manufacturer.
The transferability of a dealer principal relationship is not guaranteed, and certainly an existing dealer principal would not be able to obtain an additional franchise to directly compete with an existing franchise location of the same manufacturer for obvious area of responsibility (AOR) constraints. So, does the fact that most dealer principals don’t have an employment or non-compete agreement signify that personal goodwill must be present? Not necessarily. Again it relates back to the central questions of whether an owner/dealer principal is directly involved in the business, has a unique set of skills that contributed to a heightened success of the business, and does that owner/dealer principal have a direct impact on attracting customers to their particular dealership that could not be replicated by another individual.
Conclusion
Personal goodwill in an auto dealership, and in any industry, can become a contested item in a litigation case because it can reduce the enterprise value consideration, reduced by the amount allocated to personal goodwill. As much as the allocation, quantification, and methodology used to determine the amount of personal goodwill will come into question, several central questions should be examined and answered before simply jumping to the conclusion that personal goodwill exists.
Instead of arguing whether the value of an auto dealership should be reduced by some percentage, the real debate should center around the examination of whether personal goodwill exists in the first place. The difference in reports from valuation for experts in litigation matters generally falls within the examination and support of the assumptions (that lead to differences in conclusions). If present, personal goodwill for an auto dealership, or any company in any industry for that matter, must exist beyond just having the owner’s name in the title of the business.
1 In the auto dealer industry, goodwill and other intangible assets are referred to as Blue Sky value.
2 Martin Ice Cream Co. v. Commissioner, 110 T.C. 189 (1998).
3 In re Marriage of Lopez, 113 Cal. Rptr. 58 (38 Cal. App. 3d 1044 (1974).
Critical Issues in the Trucking Industry – 2020 Edition
Every year the American Transportation Research Institute (“ATRI”) publishes its report, Critical Issues in the Trucking Industry. A key piece of this annual report is a survey of key risk factors in the industry. While some of the risks of 2020 were not anticipated at the beginning of the year, some of the industry’s largest risk factors remain major concerns.
Driver shortages and driver compensation continue to be at the forefront of peoples’ minds. This year marks the fourth year that driver shortages have topped the list and over a quarter of survey participants marked it as one of their three largest concerns. While parts of the industry have been hit hard by COVID-19 (for example, automobile shippers or marine port logistics companies), freight demand continues to grow. The pool of available drivers – already pruned by rules changes and more stringent drug testing – shrunk further as COVID limited company’s abilities to hire and train more drivers. The American Trucking Association (“ATA”) estimated that the driver shortfall at over 60,000 drivers.
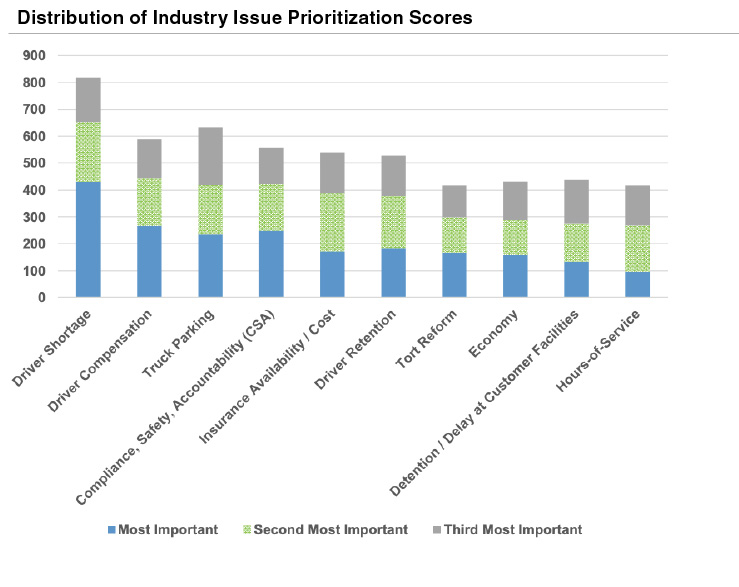 Driver compensation ranked as the second largest concern, up from the third largest in 2019. Driver compensation and driver shortages are closely linked – in order to encourage driver retention, companies are reconsidering base pay and benefits.
Truck parking first appeared on the top ten list in 2012. With just over 20% of respondents listing it as one of their top three concerns, truck parking availability reached its highest position yet. Once again, the COVID-19 pandemic underlies part of the issue – many states closed rest areas during the early stages of the pandemic. Lack of truck parking was a greater concern among owner-operators and independent contractors than among company drivers.
Compliance, safety, and accountability have been a top five concern for seven of the last ten years and has ranked in the top ten since 2010. The FMCSA has updated standards during its ten-year history, but transparency, details, and legal classifications continue to cause uncertainty and unrest in the industry.
The cost and availability of insurance ranked as the fifth highest concern. In a 2019 report, ATRI estimated that insurance costs per mile increased 12% between 2017 and 2018 and 5.6% on a compound annual basis since 2013. The impact of large court verdicts, increased vehicle values, and higher levels of traffic have all driven insurance prices up.
COVID-19 ranked 13th in the survey, although the impacts of the pandemic bleed through into other industry concerns. ATRI found that the COVID-19 pandemic tended to impact smaller carriers and owner-operators on a larger scale than bigger companies.
ATRI ultimately discusses the ten highest-ranked concerns in its report. The transportation and logistics industry continues to evolve as new risks and concerns rise in importance.
Patel v. Patel
In this case, the parties raised the matter to appeals for two issues: 1) whether the trial court erred in awarding Wife alimony in futuro of $7,500 per month, and 2) whether Wife is entitled to attorney’s fees.
The parties divorced after a 13 year marriage in which the family was initially solely supported by Wife’s $40,000 annual income. However, at the time of divorce, Husband was earning approximately $850,000 per year and Wife was not employed but was a full-time student (due to frequent moves but also a mutual decision). The trial court found that long-term alimony was appropriate given Wife’s contribution to Husband’s earning capacity, her inability to achieve his earning capacity despite her efforts at education, and the parties’ relatively high standard of living during the marriage.
At the beginning of the marriage, the husband was a full-time medical student earning no income. Across the husband’s education and career, the parties moved from Georgia to Kentucky to Florida to Ohio, and finally to Jackson, Tennessee. During separation, Wife enrolled in a college to obtain a Bachelor’s Degree in Accounting and hoped to eventually enroll in a Master’s Degree program. Wife was a full-time student at the time of trial.
Husband testified that he planned to move to Florida and his base pay upon moving to Florida after the divorce would be approximately $450,000. Husband admitted, however, that this figure did not account for the bonuses that Husband had historically received and had caused his income to increase substantially. Wife’s sole income at the time of the divorce amounted to approximately $2,000 per year in dividends.
Each of the parties created a budget of estimated forward expenses. During proceedings, each party claimed that the other was controlling the parties’ finances, refusing to permit the other to fund basic expenses. With regard to expenses, Husband claimed as an expense $10,000 per month for savings in the event that he is sued for malpractice and his insurance does not cover the entire award, costs for his parents’ health insurance, considerable maintenance on his car, and large charitable contributions. With regard to Wife’s expenses, Husband contended that they were inflated over historical actual expenses. Husband testified that expenses incurred by Wife following the separation were for extravagant gifts to family that were not representative of the parties’ lifestyle throughout the marriage.
Demonstrating the marital estate and standard of living, the parties had accumulated a level of wealth during the marriage, including two cars, several retirement accounts, and savings accounts. Husband paid off the mortgage of their Jackson, Tennessee home during the pendency of the divorce. As such, the parties had no debt at the time of the divorce and considerable assets. During the marriage, the parties also took several vacations, both in the United States and outside the country.
The trial court made the following statement on the earnings capacity of each party:
Husband’s gross earning capacity is currently about $850,000 per year. His net income based on his effective tax rate for 2016 would be in the range of about $550,000. Husband owes no debt, and will have significant assets from the property division. Wife’s current income is zero essentially, but when she finishes school, if she is able to obtain employment in her field, and achieve a CPA designation, her gross income should be in the range of $55,000 according to testimony. If she pursues a Master’s Degree and achieves it, her earning capacity could increase to $85,000 per year. Thus, there is a significant difference between the Husband’s and Wife’s earning capacity. Their obligations are about the same.
The appellate court made the following conclusion on earnings capacity:
..the evidence does not clearly and convincingly show that Wife did not significantly contribute to Husband’s career and resulting earning capacity. Rather, the evidence supports the trial court’s finding that Wife made tangible and intangible contributions to the Husband’s increased earning capacity.
Considering the factors for spousal support unique to this matter, the trial court found that the alimony in futuro of $7,500 per month alimony was appropriate given: 1) Wife’s contribution to husband’s earning capacity, 2) Wife’s inability to achieve Husband’s earning capacity despite her efforts at education, and 3) the parties’ relatively high standard of living during the marriage. Discerning no reversible error, the appellate court affirmed the trial court in all respects. Also, given the considerable property awarded to Wife in the divorce, the appellate court declined to award attorney’s fees incurred on appeal in this case.
A financial expert witness can significantly assist in the court’s determination of divorcing parties’ ability and need to pay in its determinations for spousal support. The analysis is a complex matter and calls for the expertise and analysis of a financial expert. Refer to our piece, “What Is a Lifestyle Analysis and Why Is it Important?” for more information about the process, analysis, and support that can be provided by a financial expert.
Fresh Start Accounting Valuation Considerations: Measuring the Reorganization Value of Identifiable Intangible Assets
Upon emerging from Chapter 11 bankruptcy, companies are required to apply the provisions of Accounting Standards Codification 852, Reorganizations. Under this treatment, referred to as “fresh start” accounting, companies exiting Chapter 11 are required to re-state assets and liabilities at fair value, as if the company were being acquired at a price equal to the reorganization value. As a result, two principal valuation-related questions are relevant for companies in bankruptcy:
- Reorganization Value – As noted in ASC 852, Reorganizations, reorganization value “generally approximates the fair value of the entity before considering liabilities and approximates the amount a willing buyer would pay for the assets of the entity immediately after the restructuring.” (ASC 852-05-10) Discounted cash flow analysis is the principal technique for measuring reorganization value. In certain cases, depending on the nature of the business and availability of relevant guideline companies, a method under the market approach may also be appropriate. A reliable cash flow forecast and estimate of the appropriate cost of capital are essential inputs to measuring reorganization value.
- Identifiable Intangible Assets – When fresh-start accounting is required, it may be appropriate to allocate a portion of the reorganization value to specific identifiable intangible assets such as tradenames, technology, or customer relationships. We discuss valuation techniques for identifiable intangible assets in the remainder of this article.
Measuring the Fair Value of Identifiable Intangible Assets
When valuing identifiable intangible assets, we use valuation methods under the cost, income, and market approaches.
The Cost Approach
The cost approach seeks to measure the future benefits of ownership by quantifying the amount of money that would be required to replace the future service capability of the subject intangible asset. The assumption underlying the cost approach is that the cost to purchase or develop new property is commensurate with the economic value of the service that the property can provide during its life. The cost approach does not directly consider the economic benefits that can be achieved or the time period over which they might continue. It is an inherent assumption with this approach that economic benefits exist and are of sufficient amount and duration to justify the developmental expenditures.
Methods under the cost approach are frequently used to measure the fair value of assembled workforce, proprietary software, and other technology-related assets.
The Market Approach
The market approach provides an indication of value by comparing the price at which similar property has been exchanged between willing buyers and sellers. When the market approach is used, an indication of value of a specific intangible asset can be gained from looking at the prices paid for comparable property.
Since there is rarely an active market for identifiable intangible assets apart from broader business combination transactions, valuation methods under the market approach are not commonly used to value identifiable intangible assets.
However, available market data, such as observed royalty rates in licensing transactions, is an important input in valuation methods under the income approach such as the relief-from-royalty method. Other market-derived data helps to inform estimates of the cost of capital and other valuation inputs, as well.
The Income Approach
The income approach focuses on the capacity of the subject intangible asset to produce future economic benefits. The underlying theory is that the value of the subject property can be measured as the present worth of the net economic benefits to be received over the life of the intangible asset.
Using valuation methods under the income approach, we estimate future benefits expected to result from the subject asset and an appropriate rate at which to discount these expected benefits to the present. The most common valuation methods under the income approach are the relief from royalty method and multi-period excess earnings method, or MPEEM.
- The relief from royalty method seeks to measure the incremental net profitability available to the owner of the subject intangible asset by avoiding the royalty payments that would otherwise be required to enjoy the benefits of ownership of the asset. When applying the relief from royalty method requires specification of three variables: 1) The expected stream of revenue attributable to the identifiable intangible asset, 2) An appropriate royalty rate to apply to that revenue stream, and 3) An appropriate discount rate to measure the present value of the avoided royalty payments. The relief from royalty method is most commonly used to value tradename and technology assets for which market-based royalty rates may be observed.The MPEEM is a form of discounted cash flow analysis that measures the value of an intangible asset as the present value of the incremental after-tax cash flows attributable only to the subject asset. In order to isolate those cash flows, we first develop a forecast of the expected revenues and associated operating costs attributable to the asset.
- Next, we apply contributory asset charges to reflect the economic “rent” for use of the other assets that must be in place to generate the projected operating earnings. In other words, the MPEEM recognizes that the subject identifiable intangible asset generates operating earnings only in concert with other assets of the business.
- Finally, we reduce the net after-tax cash flows attributable to the subject identifiable intangible asset to present value using a risk-adjusted discount rate. The indicated value is the sum of the present values of the “excess earnings” of the expected life of the subject asset.
We often apply the MPEEM to measure the fair value of customer relationship and technology intangibles.
Conclusion
The valuation techniques for identifiable intangible assets are rooted in the fundamental elements of business valuation, cash flow and risk, under the cost, market, and income approaches. However, when valuing identifiable intangible assets, we use valuation methods adapted to the unique attributes of those assets.
Estate Planning When Bank Stocks Are Depressed
Maybe not for the best of reasons, the stars have aligned for bank investors who have significant interests in banks to undertake robust estate planning this year.
Bank stock valuations are depressed as a result of the recession that developed from the COVID-19 policy responses, including a return to a zero interest rate policy (“ZIRP”) that is now known as the effective lower bound (“ELB”). The result is severe compression in net interest margins (“NIMs”), while the extent of credit losses will not be known until 2021 or perhaps even 2022.
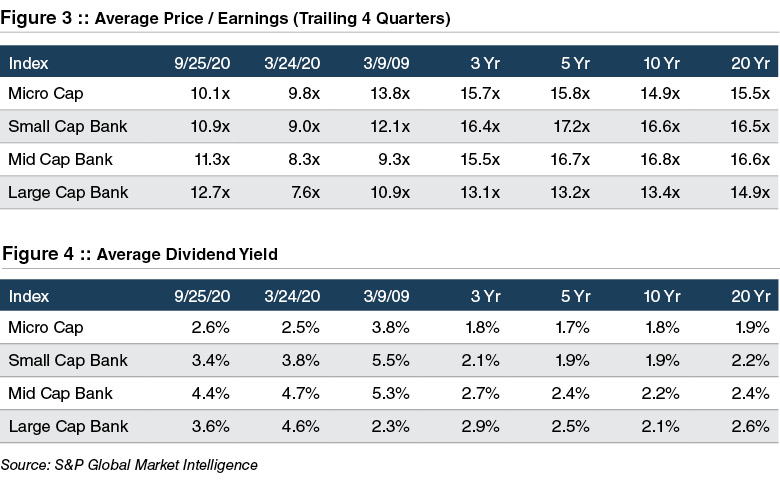
As shown in Figure 1, bank stocks have produced a negative total return that ranges from -27% for the twelve months ended September 25, 2020 for the SNL Large Cap Bank Index to -36% for the SNL Mid Cap Bank Index. At the other extreme are tech stocks. The NASDAQ Composite has produced a one-year total return of 35%–a 70% spread between the two sectors.
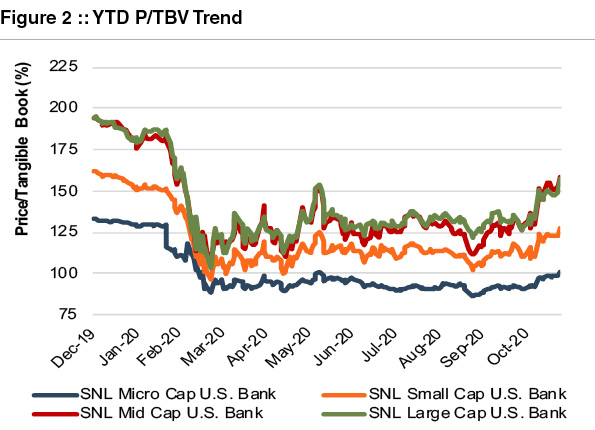
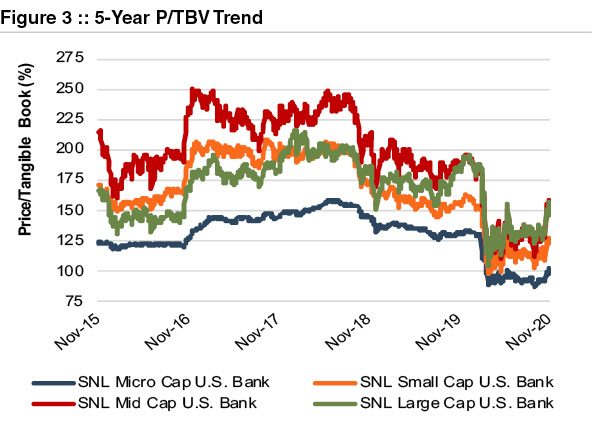
Valuations for banks are depressed and are comparable to lows observed on March 24, 2020 when market panic and forced selling by levered investors peaked and March 9, 2009 when investors feared a possible nationalization of the large banks. Price-to-tangible book value (“P/TBV”) multiples are presented in Figure 2, while price-to-earnings (“P/E”) ratios based upon the last 12-month (“LTM”) earnings are presented in Figure 3. (Note—while P/TBV multiples are little changed from March 24, 2020, P/E ratios have increased because reserve building and reduced NIMs have reduced LTM earnings).
No one knows the future, but assuming reversion to the mean eventually occurs bank stocks could rally as earnings improve once credit costs decline even if NIMs remain depressed, resulting in higher earnings and multiple expansion. Relative to ten-year average multiples based upon daily observations, banks are 30-40% cheap to their post-Great Financial Crisis trading history.
In effect, current gifting and other estate planning could lock in significant tax benefits assuming a Japan and Europe scenario does not develop in the U.S. where banks are “re-rated” and underperform for decades.
A second reason to consider significant estate planning transactions this year is the potential change in Washington if 2021 sees a Biden Administration backstopped with a Democrat-controlled Senate and House.
Vice President Biden’s proposed estate tax changes include the elimination of basis step-up, significant reductions to the unified credit (the amount of wealth that passes tax-free from estate to beneficiary) and gift tax exemption, and increasing current capital gains tax rates to ordinary income levels for high earning households. The cumulative effect of these changes is a substantial increase in high net worth clients’ estate tax liabilities if Biden’s current proposals become law.
Basis step-up is a subtle but important feature of tax law. Unusual among industrialized nations, in the United States the assets in an estate pass to heirs at a tax value established at death (or at an alternate valuation date). Even though no tax is collected on the first $11.6 million per person, the tax basis for the heir is “stepped-up” to the new value established at death. Other countries handle this issue differently, and Biden favors eliminating the step-up in tax basis. Further, he prefers taxing the embedded capital gain at death. Canada, for example, does this – treating a bequest as any other transfer and assessing capital gains taxes to the estate of the decedent.
Fortunately, there are several things bank shareholders can do now to minimize exposure to these potential tax law changes. Taking advantage of the current high-level of gift tax exemptions ($11.58 million per individual or $23.16 million per married couple) could save millions in taxes if Biden’s proposed lower exemption of $3.5 million per individual becomes law.
Other options include the formation of trusts or asset holding entities to transfer wealth to the next generation in a tax-efficient manner. Proper estate planning can mitigate the adverse effects of higher taxes on wealth transfers, but the window to do so may be closing if we have a regime change later this year.
Further, the demand (and associated cost) for estate planning services may go up significantly in November, so you need to apprise your clients of these potential changes before it’s too late.
In the 1990s, the unified credit (the amount of wealth that passes tax-free from estate to beneficiary) was only $650 thousand, or $1.3 million for a married couple. The unified credit was not indexed for inflation, and the threshold for owing taxes was so low that many families we now consider “mass-affluent” engaged in sophisticated estate tax planning techniques to minimize their liability.
Then in 2000, George W. Bush was elected President, and estate taxes were to be phased out. Over the past decade, the law has changed several times, but mostly to the benefit of wealthier estates. That $650 thousand exemption from estate taxes is now $11.6 million. A married couple would need a net worth of almost $25 million before owing any estate tax, such that now only a sliver of bank stock investors require heavy duty tax planning.
That may all be about to change.
Vice President Biden has more than gestured that he plans to increase estate taxes by lowering the unified credit, raising rates, and potentially eliminating the step-up in basis that has long been a feature of tax law in the United States.
Talk is cheap. But investors take heed; now may be the time to execute rather than plan.
Originally appeared in Mercer Capital’s Bank Watch, September 2020.
Four Reasons to Consider a Stock Repurchase Program
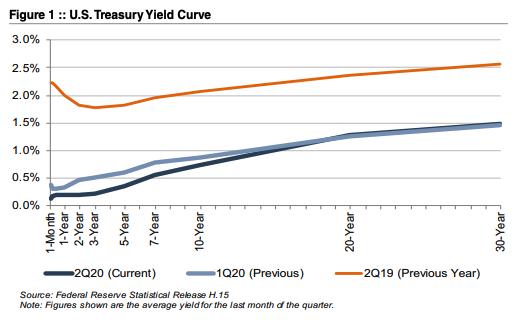
Bank stocks rallied in the first few weeks of November 2020 as the market’s Thanksgiving dinner came early, and it digested several issues including positive news on the COVID-19 vaccine candidates. While significant uncertainty still exists on credit conditions, COVID-19, and the economic outlook, bank valuations and earnings expectations also benefitted from the yield curve steepening as evidenced by the 10-year Treasury moving up from ~50 bps in early August to ~85 bps in mid-November.
Despite the recent rise in bank stock pricing, bank stock valuations are still depressed relative to pre-COVID levels as a result of the recession that developed from the pandemic and ensuing policy responses. A primary headwind for banks is the potential compression in net interest margins (“NIMs”) following a return to a zero interest rate policy (“ZIRP”) that is now known as the effective lower bound (“ELB”). Additionally, credit risk remains heightened for the sector compared to pre-pandemic levels as the extent of credit losses resulting from the pandemic and economic slowdown will not be known until 2021 or perhaps even 2022.
Amidst this backdrop, many banks and their directors are evaluating strategic options and ways to create value for shareholders. While the Federal Reserve has prohibited the largest U.S. banks from share repurchases, the current environment has prompted many community banks to announce share buyback plans. According to S&P Global Market Intelligence, more than forty U.S. community banks announced buyback plans in the third quarter and the trend has continued in the fourth quarter with another 36 buyback announcements, including new plans, extensions of existing plans, and reinstatements of previously suspended plans, in October. In our view, there are four primary reasons that many community and regional banks are announcing or expanding share repurchase programs in the current environment.
1) Valuations are Lower Relative to Historical Levels
Since the onset of the COVID-19 pandemic, the banking sector has underperformed the broader market due to concerns on credit quality and a prolonged low-interest rate environment. Despite the November rally, bank stocks are still trading at lower multiples than observed in recent years. Furthermore, many banks are finding themselves with excess liquidity in light of weaker loan demand and growing deposits.
In a depressed price environment, share repurchases can be a favorable use of capital, particularly when pricing is at a discount to book value and is accretive to book value per share. As shown in the chart below, the average P/TBV multiple has declined for all of the SNL market capitalization bank indices since the beginning of 2020. The decline has been most pronounced for the Micro Cap index, with the average P/TBV multiple for banks with a total market capitalization of less than $250 million falling from 133% to 102%.
2) Favorable Tax Environment for Shareholders Seeking Liquidity
Capital gains tax rates are low relative to historical levels and the potential for higher capital gains tax rates has risen under President-elect Biden. As part of his tax plan, Biden has proposed increasing the top tax rate for capital gains for the highest earners from 23.8% to 39.6% (akin to ordinary income levels), which would be the largest increase in capital gains rates in history. While the ability for Biden’s tax plan to become reality is uncertain, many community banks have an aging shareholder base with long-term capital gains and it is an issue worth watching and planning for as poor planning can leave significant tax consequences for the shareholder or his or her heirs. A share repurchase program can provide liquidity to shareholders who may be apt to take advantage of the current capital gains rates that are low by historical standards and lower than the rates proposed by President-elect Biden.
3) Relatively Low Borrowing Costs and Sufficient Capital for Many Community Banks
Despite the unique issues brought about by the pandemic and the uncertain economic outlook, many community banks are well capitalized and have “excess” capital at the bank level and perhaps even an unleveraged holding company. We have written previously about the idea of robust stress testing and capital planning given the economic environment but note that a recent survey indicated that most bankers believe capital levels are sufficient to weather the economic downturn. Our research also indicates that rates on subordinated debt issuances issued in September of 2020 averaged ~5% compared to ~6% average for 2018 and 2019. These lower borrowing costs and ample capital for many banks in combination with lower share prices enhance the potential internal rate of return for share repurchases when compared to other strategic alternative uses of capital.
4) Enhancing Shareholder Value and Liquidity
Board members and management teams face the strategic decision of allocating capital in a way that creates value for shareholders. Potential options include growing the balance sheet organically or through acquisition (perhaps a whole bank or branch), payment of dividends, or a stock repurchase program. While M&A has been a constant theme, activity has slowed during the COVID-19 pandemic and Bank Director’s 2021 Bank M&A Survey noted that only ~33% say their institution is likely to purchase a bank by the end of 2021, which was down from the prior year’s survey (at ~44%). Key challenges to M&A in the current environment include conducting due diligence and evaluating a seller’s loan portfolio in light of COVID-19 impacts and economic uncertainty.
Organic loan growth expectations have also been muted for many banks in light of the economic slowdown resulting from COVID-19. With organic and acquisitive balance sheet growth appearing less attractive for many banks in the current environment, dividends and share repurchases have climbed up the strategic option list for many banks. A share repurchase program can have the added benefit of enhancing liquidity and marketability of illiquid shares, which potentially enhances the valuation of a minority interest in the bank’s stock.
Conclusion
If your bank’s board does implement a share repurchase program, it is critical for the board to set the purchase price based upon a reasonable valuation of the shares. While ~5,000 banks exist, the industry is very diverse and differences exist in financial performance, risk appetite, growth trajectory, and future performance/outlook in light of the shifting landscape. Valuations should understand the common issues faced by all banks – such as the interest rate environment, credit risk, or technological trends – but also the entity-specific factors bearing on financial performance, risk, and growth that lead to the differentiation in value observed in both the public and M&A markets.
At Mercer Capital, valuations are more than a mere quantitative exercise. Integrating a bank’s growth prospects and risk characteristics into a valuation analysis requires understanding the bank’s history, business plans, market opportunities, response to emerging technological issues, staff experience, and the like.
For those banks considering a share repurchase program, Mercer Capital has the experience to provide an independent valuation of the stock that can serve to assist the Board in setting the purchase price for the share repurchase program.
Originally appeared in Mercer Capital’s Bank Watch, November 2020.
What RIAs Need to Know About Current Estate Planning Opportunities
Estate and tax planning matters are an important component of the overall financial plan for many RIA clients. The current tax policy and market environment create unique estate planning opportunities that may not last if economic conditions normalize or if Biden wins in November. This webinar addresses the available opportunities that RIA principals and advisors should be aware of in the current environment.
Original air date: October 28, 2020
Premise of Value: Why It Is a Critical Aspect of Business Continuity and Financial Restructuring
The conventions for defining value may never be more important than when making decisions related to business continuity and financial restructuring. Countless clients have demonstrated a sense of confusion regarding the various descriptors of value used in valuation settings. More than a few valuation stakeholders have mused that the value of anything (a business or an asset as the case may be) should be an absolute numerical expression and unambiguous in meaning. Unfortunately for those seeking simplicity in a trying time, the conditional cliché “it depends” is critical when defining value for the assessment of bankruptcy decisions and workout financing. The elements that underpin the Premise of Value provide a convenient base for introducing some of the vocabulary used in the bankruptcy and restructuring environment. Gaining a thorough familiarity with the Premise of Value provides a cornerstone for understanding the financial considerations employed in valuing business assets and evaluating financial options.
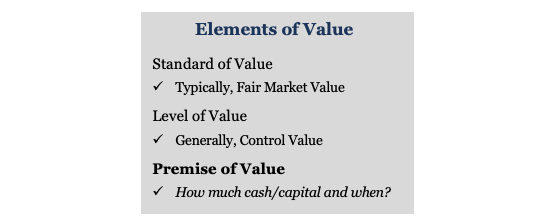
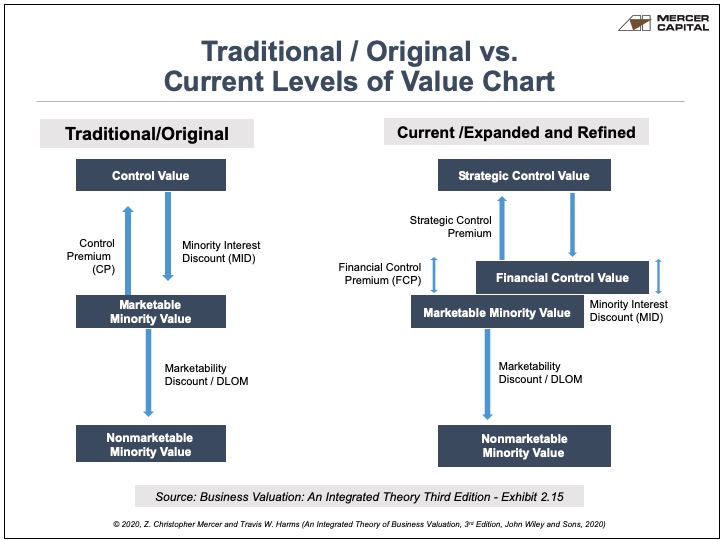
Defining value is a science of its own and can be subject to debate based on facts and circumstances. With respect to business enterprises and assets, as well as business ownership interests, there are numerous defining elements of value. These elements generally include the Standard of Value, the Level of Value, and the Premise of Value. More confusing is that real property appraisers, machinery & equipment appraisers and corporate valuation advisors may not use the same value-defining nomenclature and may have varied meanings for similar vocabulary. When the question of business value or asset value arises, the purpose of the valuation, the venue or jurisdiction in which value is being determined and numerous other facts and circumstances have a bearing on the defining elements of value.
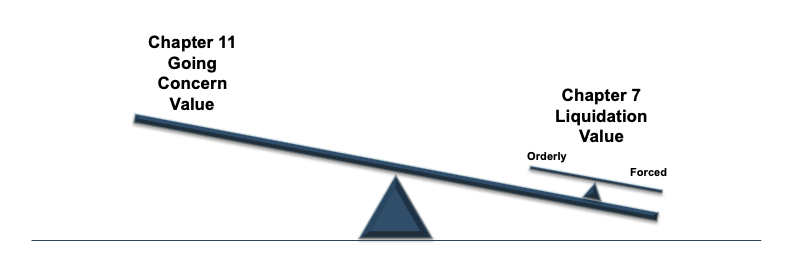
Everyone has seen the “inventory liquidation sale” sign or the “going out of business” sign in the shop window. For the merchant and the merchant’s capital providers, the ramifications of how assets are monetized for the purposes of optimizing returns on and of capital is a key focus of the valuation methods employed in the restructuring and bankruptcy environment. The international glossary of business valuation terms defines the Premise of Value and its components as follows:
- Premise of Value – an assumption regarding the most likely set of transactional circumstances that may be applicable to the subject valuation; for example, Going Concern, liquidation
- Going Concern Value – the value of a business enterprise that is expected to continue to operate into the future. The intangible elements of Going Concern Value result from factors such as having a trained work force, an operational plant, and the necessary licenses, systems, and procedures in place.
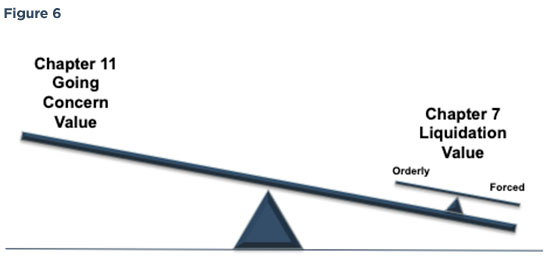
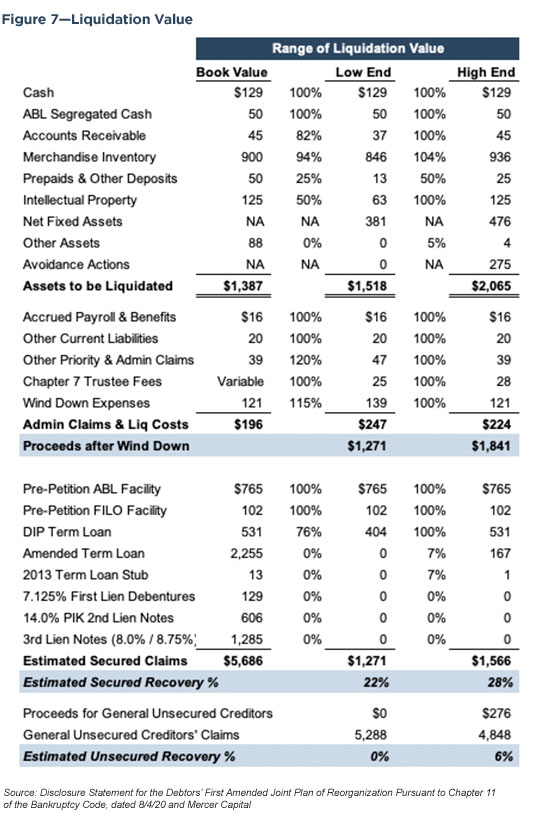
- Liquidation Value – the net amount that would be realized if the business is terminated and the assets are sold piecemeal. Liquidation can be either “orderly” or “forced.”
- Orderly Liquidation Value – liquidation value at which the asset or assets are sold over a reasonable period of time to maximize proceeds received.
- Forced Liquidation Value – liquidation value, at which the asset or assets are sold as quickly as possible, such as at an auction
The Premise of Value is a swing consideration for distressed businesses and their lenders. For businesses in financial distress, achieving a return on capital shifts to the priority of asset protection and capital value preservation via a deliberate plan to mitigate downside exposures. In most situations where a business is dealing with an existential financial threat, the preference for the business is to remain a Going Concern (at least initially), whereby the business continues to operate as a re-postured version of its former self. In the context of bankruptcies and/or restructurings, the business that remains a Going Concern is referred to as the Debtor in Possession (DIP).
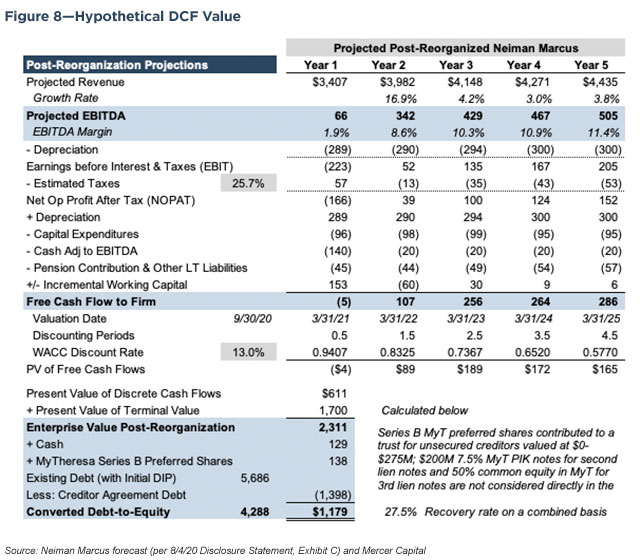
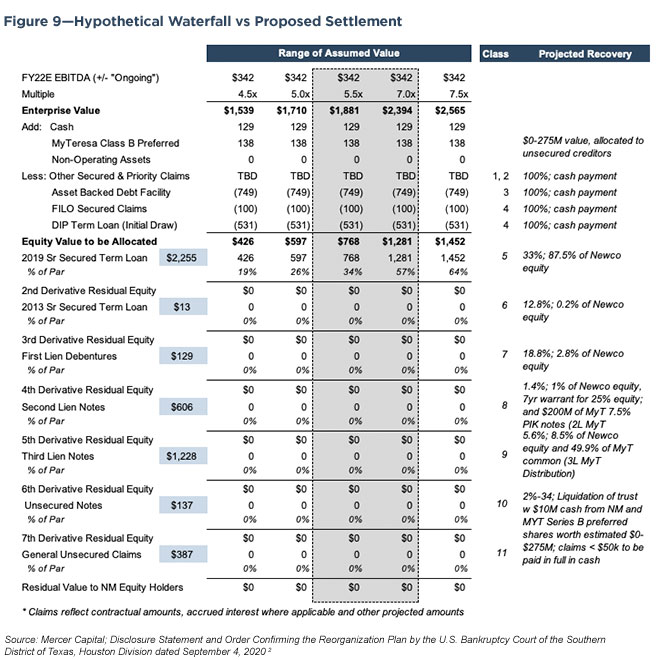
DIPs remain a Going Concern using the protection of Chapter 11 bankruptcy to achieve a fresh start where their financial obligations are restructured through modification and/or specialized refinancing. Chapter 11 involves a detailed plan of reorganization, which may be administered by a trustee and is ultimately governed under the specialized legal oversight of the courts. Reorganization under Chapter 11 is the preferred first step for most operating enterprises whose business assets are purpose?specific and for which the break-up value of the assets would be economically punitive to capital investors. Intuitive to the Going Concern premise are valuation methods and analyses that study potential business outcomes using detailed forecasts and the corresponding potential of the resulting cash flows to service the necessary financing to achieve the outcome. One valuation discipline among numerous possibilities is the establishment and testing of a value threshold at which the capital returns are deemed adequate to their respective providers (e.g. an IRR analysis) based on the risks incurred. If remaining a Going Concern delivers an acceptable rate of return under a plan of reorganization, then liquidation might be avoided or forestalled.
The alternative to remaining a Going Concern involves the process of liquidation. In bankruptcy terms, a business entity files for Chapter 7 and begins the cessation of business operations and seeks a sale of assets to re-pay creditors based the creditors’ respective position in the capital stack. The “liquidation” premise is generally a value-compromising proposition for the bankruptcy stakeholders with the economic consequences are scaled to whether the liquidation is achieved in an orderly process or a forced process.
Modern, global economies and increasingly technology inspired business models have resulted in a certain amount of disruption, the consequences of which often compromise the value of purpose-specific business assets in obsoleting or excess-capacity industries (e.g. coal in the face of growing energy alternatives and concerns for climate change). Assets that have productive capacity are typically sold in an orderly market and may achieve a value commensurate with the capital asset expenditures expectations of industry market participants. Real property assets and operating assets that can be successfully transitioned or re-purposed are often liquidated in an orderly fashion to maximize value. Specialized assets and/or assets with inferior productive capacity or which are positioned in unfavorable circumstances likely lack the ability to attract buyers due to the deficiencies and/or inefficiencies of relevant markets. Accordingly, the time value of money and the demands of the most senior creditors may suggest or dictate that a forced liquidation sooner is more favorable than a deferred outcome.
Most restructuring and bankruptcies involve a total rationalization of operating assets and business resources. For large integrated businesses, it often occurs that a combination of value premises applies to differing types of tangible and intangible assets based on the go-forward strategy of the business and the availability of markets in which to monetize assets. For example, an initial liquidation may occur with respect to certain business operations and properties to create the resources necessary to achieve debt restructuring or DIP financing. Accordingly, advisory engagements often take into consideration a wide range of options based on the timing of asset sales and the sustainability of continuing operations. The Premise of Value is a quiet but critical defining element for assessing the collective value proposition associated with a plan of reorganization.
Many bankruptcy advisory projects necessarily involve comparing the Going Concern value to Liquidation value. Each premise involves an inherently speculative set of underlying models and assumptions about the performance of the business and/or the timing and exit value achieved for business assets. And, each may be developed using a variety of scenarios with differing outcomes and event timing. Setting aside the qualitative aspects of decision making, the Premise of Value with the best outcome is typically the path of pursuit based on the necessity for an objective criterion required under the legalities of the bankruptcy process and the priority claims of creditors.
A fundamental understanding of the defining elements of value is critical to distressed businesses and their creditors. Valuation advisors are required to clearly detail the defining elements of value employed in the determination of asset values and enterprise valuations. The Premise of Value must be comprehended in the context of other defining elements of value. If you have a question concerning the design and valuation of varying plans of reorganization or bankruptcy strategies, please contact Mercer Capital’s Transaction Advisory Group.
Subdued M&A Activity in the First Half of 2020
U.S. M&A activity slowed sharply in the second quarter due to the economic shock resulting from the COVID-19 pandemic. Activity – especially involving lower-to-middle market businesses – is expected to remain muted for the duration of 2020 and throughout 2021 unless more effective therapeutics and/or vaccines are developed that facilitate a more bullish sentiment than currently prevails.
Although evidence is currently obscure, M&A markets appear to reflect wider bid-ask spreads among would-be sellers and buyers. Sellers are too fixated on what their business might have transacted for in 2019 while buyers expect to pay less as a result of declining performance and higher uncertainty regarding the magnitude and duration of the current economic malaise.
Numerous industries lack sufficiently motivated strategic buyers willing to overlook concerns for their existing businesses to say nothing of the integration of new business. On the other hand, certain financial buyers seem to have returned to the market looking to deploy capital at attractive valuations when and where acquisition financing is available at reasonable terms and pricing.
Would-be sellers face a dilemma: sell now for a seemingly compromised valuation; or wait for a recovery in market appetite that is not guaranteed to occur in the foreseeable future. Sellers are also faced with weighing the potential dilution of their future transaction proceeds if political regime/legislative change threatens the currently favorable tax environment. A modest consolation in the near-term for certain sellers may extend from the forgiveness of PPP loans under the CARES Act. As an aside from the current topical focus, sellers are advised to study the requirements and documentation for PPP forgiveness under change of control transaction events.
We believe that in the current environment, contingent payments (e.g., earnouts and/or clawbacks) and seller financing will be employed to a greater extent than in the past in order to bridge a widening bid ask gap in deal value. Contingent deal consideration is typically structured such that a portion of transaction consideration is contingent upon the buyer’s achievement of specified post-transaction performance thresholds. The current environment requires careful seller scrutiny of such terms.
When reasonably structured and negotiated, contingent consideration results in a symmetrical risk for buyers and sellers. While the economics can vary, earnouts often provide an incremental tranche of deal value that reconciles to that debated 0.5x to perhaps 2.0x turn that comprises the typical bid-ask spread (usually EBITDA based). For the buyer, contingent consideration acts as an insurance policy to insulate against downside future performance. For the seller contingent consideration can deliver deal consideration over and above that at the closing table, thus facilitating upfront liquidity while allowing for potential upside versus a straight all-cash closing. Sellers are advised to be careful about their unwillingness to entertain contingent consideration in the current environment because doing so can be a signal to the buyer of the seller’s concerns about near-term performance (i.e., actions speak louder than words). As always, every transaction is unique, requiring careful assessment of contingent consideration for purposes of productive negotiation.
In theory, sellers may have to provide more financing in the post-COVID environment in order to achieve acceptable terms and pricing. We use the qualifier “in theory” because the high yield and leverage loan markets that are an important source of acquisition financing improved sharply as the third quarter progressed with more capital being raised at tighter spreads than the second quarter.
An additional concern that has slowed M&A activity is execution. Conducting due diligence during a pandemic is inherently difficult and fraught with its own complications. It is easy to imagine how due diligence would have ground to a complete halt in an era before electronic data rooms and Zoom Video meetings. Nonetheless, travel prohibitions and social distancing protocols have stymied due diligence as most buyers require site visits and face-to-face meetings in order to consummate a purchase agreement. However, issuing a non-binding LOI remains quite doable, and some buyers are eager to secure the optionally and potential exclusivity obtained by an LOI submission.
M&A in most industries is pro-cyclical. Challenges notwithstanding, M&A activity should gradually improve if the economy continues to do so and as buyers and sellers adjust expectations to the current environment and business earnings “normalize” in 2021 or 2022.
Business Valuation: An Integrated Theory, 3rd Edition
A guide that demystifies modern valuation theory and shows how to apply fundamental valuation concepts
The revised and updated third edition of Business Valuation: An Integrated Theory explores the core concepts of the integrated theory of business valuation and adapts the theory to reflect how the market for private business actually works.
In this third edition of their book, the authors, two experts on the topic of business valuation, help readers translate valuation theory into everyday valuation practice. This important updated book:
- Includes an extended review of the core concepts of the integrated theory of business valuation and applies the theory on a total capital basis
- Explains “typical” valuation discounts (marketability and minority interest) and premiums (control premiums) in the context of financial theory, institutional reality, and the behavior of market participants
- Explores evolving valuation perspectives in the context of the integrated theory
The third edition of Business Valuation is the only book available regarding an integrated theory of business valuation, offering an essential, unprecedented resource for business professionals.
Testimonials
Mercer and Harms’ Business Valuation: An Integrated Theory, Third Edition provides valuation professionals, attorneys, other users of valuations, and students of valuation a resource for better understanding how the pieces of the valuation puzzle fit together. This book is written in an easy to follow style and is worthy of being added to your valuation library.
Roger J. Grabowski, FASA
Managing Director, Duff & Phelps
It has been 13 years since the second edition of this book came out. It was certainly worth the wait. All the core chapters have been updated with easy-to-understand explanations of valuation concepts. Mercer and Harms have also added new chapters on the Income Approach (Cash Flows), the Income Approach (Discount Rate), the Market Approach (Guideline Public Companies), the Market Approach (Guideline Transactions), and Restricted Stock Discounts and Pre-IPO studies. This well-written book presents a thoughtful approach to business valuation. The bottom line is that this is a valuable resource that tackles controversial topics head on.
James R. Hitchner, CPA/ABV/CFF, ASA
Managing Director, Financial Valuation Advisors
What Is Your Trust Company Worth Today?
In this September 23, 2020 webinar, Matt Crow and Taryn Burgess explain valuation considerations for independent trust companies and why common rules of thumb don’t always work.
During this time when the outlook for global markets, the economy, and one’s own health is uncertain, many trust company principals are working to nail down the unknowns associated with business ownership. Owners of independent trust cos are devoting more time to working on their buy-sell agreements in an effort to protect the working relationships with their partners and ensure they and their families are protected financially. While so much else is uncertain, the value of your independent trust company does not have to be.
This webinar is tailored to owners and principals of independent trust companies, but many of the topics are relevant for owners of all investment management firms.
Trucking Industry Explosions and Implosions
The trucking industry has recently been shaken by a series of large accident-related litigation verdicts, also known as nuclear verdicts. The definition of what constitutes a nuclear verdict can vary; however, the most common definition is verdicts in excess of $10 million. No matter how they are defined, nuclear verdicts are causing upheaval in the trucking industry. Trucking companies have historically only had to insure drivers for $1 million each, amplifying the effect of significantly larger verdicts.
- In 2017, RCX Solutions Inc. received a legal verdict of $23 million. In 2019, this verdict was reduced to $7.5 million by the U.S. Circuit Court of Appeals. Following the verdict, RCX was unable to renew financing and closed in March 2020.
- In May 2018, a jury awarded an $89.7 million award against Werner Enterprises.
- In July 2018, a jury penalized FTS International, an oil company that was shipping fracking sands through its in-house fleet, with a verdict of $101 million.
- In April 2019, a jury award $33.6 million against JHOC, Inc.
- In August 2019, a jury awarded a $280 million verdict against Schnitzer Southeast and Schnitzer Steel.
- In September 2019, a jury awarded a $26.6 million verdict against Country Wide RV Transport (CWRV) after an independent contractor driver fell asleep at the wheel. CWRV announced its intentions to shut down as of November 1, 2019.
- In February 2020, a federal jury in Georgia awarded a $21 million verdict against trucking company JW Harper Farms and its insurance company.
The American Transportation Research Institute (ATRI) conducted an analysis of over 400 cases from 2006 through 2019. ATRI issued its findings in its June 2020 publication “Understanding the Impact of Nuclear Verdicts on the Trucking Industry.” The table below summarizes the data analyzed by ATRI. While the majority of verdicts still fall under $2 million, the number of large verdicts has increased, and the size of those large verdicts has continued to grow.
According to ATRI’s analysis, nuclear verdicts have increased at a much faster rate than can be accounted for by inflation or increase in health care costs. The chart below (from ATRI’s June 2020 publication) shows the rapid increase in verdict size.
It is not a surprise that trucking companies are already responding to these verdicts. Many companies are beefing up safety measures, including installing in-cab cameras to watch drivers and keep an extra eye on the road. Others are conducting more thorough reviews of drivers and are paying closer attention to prior incidents.
Some of the biggest impact can be seen in insurance premiums in the industry. The average insurance premium increased 42% from 2010 to 2018, and several major underwriters have exited the trucking industry altogether. Premiums are only expected to go higher – possibly increasing as much as 20% or 30% in 2020. Higher premiums have changed the way some companies conduct business. Rather than operate their fleets directly, some carriers have leased their trailers to a larger firm, hoping to take advantage of the larger company’s insurance policy.
Overall, the increase in nuclear verdicts fuels uncertainty in the trucking industry, making it difficult for trucking companies to budget insurance and litigation expenses.
Originally published in the Value Focus: Transportation & Logistics, Second Quarter 2020.
Neiman Marcus: A Restructuring Case Study
Mercer Capital is a national valuation and financial/transaction advisory firm. The Neiman Marcus Chapter 11 bankruptcy filing raises multiple valuation questions:
-
Fraudulent conveyance (asset stripping) and solvency related to pre-filing asset distributions
-
Liquidation vs going concern value
-
Value of the company once it emerges from Chapter 11
-
Allocation of enterprise value to secured and unsecured creditors
-
Fresh start accounting
Neiman Marcus Group, Inc. (“Neiman Marcus” or “Company”) is a Dallas, Texas-based holding company that operates four retail brands: Neiman Marcus, Bergdorf Goodman, Last Call (clearance centers), and Horchow (home furnishings). Unlike other department store chains, such as JCPenney and Macys that cater to the mass market, Neiman Marcus’s target market is the top 2% of U.S. earners.
Among the notable developments over the last 15 years were two private equity transactions that burdened the Company with a significant debt load and one well-timed acquisition. The debt and acquisition figured prominently in the May 7, 2020 bankruptcy filing in which the company sought to reorganize under Chapter 11 with the backing of most creditors.
Iconic Luxury Retailer to Indebted Morass
History
The iconic Neiman Marcus department store was established in 1907 in Dallas. Over the ensuing decades, the Company prospered as oil wealth in Texas fueled demand for luxury goods. Neiman Marcus merged with Broadway-Hale Stores (later rechristened Carter Hawley Hale Stores, Inc.) in the late 1960s. Additional stores were opened outside of Texas in Atlanta, South Florida, and other wealthy enclaves around the U.S. except for New York where Bergdorf Goodman (acquired in the 1970s) operated two stores.
In 1987, Neiman Marcus along with Bergdorf Goodman was partially spun out as a public company with the remaining shares spun in 1999.
In 2005, the Company was acquired via a $5 billion LBO that was engineered by Texas Pacific Group and Warburg Pincus. Once the economy rebounded sufficiently from the Great Financial Crisis, the PE-owners reportedly sought to exit via an IPO in 2013. However, the IPO never occurred. Instead, the Company was acquired for $6 billion by Ares Management and the Canada Pension Plan Investment Board (“CPPIB”).
In 2014 Neiman Marcus acquired MyTheresa, a German luxury e-commerce retailer with annual revenues of $130 million, for $182 million of cash consideration. During 2018, the entity that held the shares of MyTheresa (MyT Holding Co.) was transferred via a series of dividends to the Neiman Marcus holding company directly controlled by Ares and CPPIB and thereby placed the interest out of the reach of Company creditors.
Neiman Marcus filed an S-1 in 2015 in anticipation of becoming a public company again; however, the registration statement was withdrawn due to weak investor demand.
Although Neiman Marcus’ common shares had not been publicly traded since 2005, the Company filed with the SEC because its debt was registered. During June 2019, the Company deregistered upon an exchange of new notes and preferred equity for the registered notes. S&P described the restructuring as a selective default because debt investors received less than promised with the original securities.
Review of Financials
Figure 1 below presents a recent summary of the company’s financial performance and position one year prior to the bankruptcy filing. Of note is the extremely high debt burden that equated to 12.4x earnings before interest taxes, depreciation, and amortization (“EBITDA”) for the last twelve months (“LTM”) ended April 27, 2019. Although definitions vary by industry, federal banking regulators consider a company to be “highly levered” if debt exceeds EBITDA by 6x.
Moody’s downgraded the Company’s corporate credit rating to B3 from B2 in October 2013 with the acquisition by Ares and CPPIB. Moody’s also established an initial rating of Caa2 for unsecured notes issued to partially finance the acquisition. By the time the notes were deregistered, Moody’s had reduced the corporate rating to Caa3 and the notes to Ca.
Moody’s defines Caa as obligations that “are judged to be of poor standing and are subject to very high credit risk,” and Ca as obligations that are “highly speculative and are likely in, or very near, default, with some prospect of recovery in principal and interest.”
Neiman Marcus has struggled with a high debt load since the first LBO in 2005, which has been magnified by the disruptive impact that online retailing has had on department stores. EBITDA declined from $665 million in FY2015 to $400 million in the LTM period ended April 27, 2019; the EBITDA margin declined by over a third from 13.1% to 8.5%, over the same time. By April 2019, debt equated to 12.4x LTM EBITDA and covered interest expense by 1.2x.
By way of reference, the debt/EBITDA and EBITDA/interest ratios for Ralph Lauren (NYSE: RL) for the fiscal year ended March 30, 2019, were 1.0x and 47.1x, while the respective ratios for Dillard’s (NYSE: DDS) were 1.2x and 9.9x for the fiscal year ended February 2, 2019.
At the time of bankruptcy, Neiman Marcus generated about one-third of its sales (about $1.5 billion) online. MyTheresa generated approximately $500 million of this up from $238 million in 1Q17 when certain subsidiaries that held MyTheresa were designated “unrestricted subsidiaries” by the Company. While MyTheresa’s sales increased, the legacy department store business declined as the Company struggled to connect with younger affluent customers who favored online start-up boutiques and had little inclination to shop in a department store.
As shown in the chart below, ecommerce sales as a portion of total retail sales have doubled over the last five years to about 12% in 2019. The move to work from home (“WFH”) and social distancing practices born of COVID-19 in early 2020 have accelerated the trend such that the pre-COVID-19 projection of e-commerce sales rising to 15% by 2020 will likely prove to be significantly conservative.
Bankruptcy Filing
Neiman Marcus filed on May 7, 2020 for chapter 11 bankruptcy protection. The COVID-19 induced shutdown of the economy was the final nail in the coffin, which forced major furloughs and the closing of its stores in accordance with various local shelter-in-place regulations. Other recent retail bankruptcies include Lord & Taylor, Men’s Warehouse, Ann Taylor, Brooks Brothers, Lucky Brands, J. Crew with many more expected to file.
The initial plan called for creditors to convert $4 billion of $5 billion of debt into equity. The plan does not provide for mass store closures or asset sales, although the Last Call clearance stores will close.
As noted, the bankruptcy filing follows a restructuring in June 2019 that entailed:
- An exchange of all but $137 million of $960 million of 8.0% cash pay and $656 million of 8.75%/9.50% PIK Toggle unsecured notes for $1.2 billion of (i) 8.0% and 8.75% third lien Company notes and (ii) $250 million of Series A preferred equity in MyT Holding Co., a US-based entity that holds the German corporate entity that operates MyTheresa;
- The issuance of $550 million of new second-lien 6% cash pay/8.0% PIK notes due 2024 with a limited senior secured claim of $200 million from MyT Holding Co. and other MyT affiliates;
- A partial paydown of the first-lien term loan facility at par with the proceeds of the second lien notes; and
- An exchange for the remaining $2.2 billion first-lien credit facility with a new facility and an extension of the maturity to October 2023.
The restructuring did not (apparently) materially impact the Company’s $900 million asset-based credit facility of which $455 million was drawn as of April 2019; or the first lien $125 million debentures due in 2028.
As shown in Figure 4, market participants assigned little value to the $1.2 billion of third lien notes that were trading for around 8% of par when the bankruptcy filing occurred and 6% of par in late August 2020.
The binding Restructuring Support Agreement (“RSA”), dated May 7, 2020, included commitments from holders of 99% of the Company’s term loans, 100% of the second line notes, 70% of the third line notes, and 78% of the residual unsecured debentures to equitize their debt. Also, certain creditors agreed to backstop $675 million in debtor-in-possession (“DIP”) financing and to provide $750 million of exit financing which would be used to refinance the DIP facility and provide incremental liquidity.
DIP financing is often critical to maintain operations during the bankruptcy process when the company has little cash on hand. DIP financing is typically secured by the assets of the company and can rank above the payment rights of existing secured lenders. DIPs often take the form of an asset-based loan, where the amount a company borrows is based on the liquidation value of the inventory, assuring that if the company is unable to restructure, the loan can be repaid from the liquidation of the retailer’s assets.
Bankruptcy Path: Chapter 7 vs. Chapter 11
Federal law governs the bankruptcy process. Broadly, a company will either reorganize under Chapter 11 or liquidate under Chapter 7.
A Chapter 7 filing typically is made when a business has an exceedingly large debt combined with underlying operations that have deteriorated such that a reorganized business has little value. Under Chapter 7, the company stops all operations. A U.S. bankruptcy court will appoint a trustee to oversee the liquidation of assets with the proceeds used to pay creditors after legal and administrative costs are covered. Unresolved debts are then “discharged”, and the corporate entity is dissolved.
Under Chapter 11, the business continues to operate, often with the same management and board who will exert some control over the process as “debtor in possession” operators. Once a Chapter 11 filing occurs, the debtor must obtain approval from the bankruptcy court for most decisions related to asset sales, financings, and the like.
Most public companies and substantive private ones such as Neiman Marcus file under Chapter 11. If successful, the company emerges with a manageable debt load and new owners. If unsuccessful, then creditors will move to have the petition dismissed or convert to Chapter 7 to liquidate.
Most Chapter 11 filings are voluntary, but sometimes creditors can force an involuntary filing. Normally, a debtor has four months after filing to propose a reorganization plan. Once the exclusivity period ends creditors can propose a competing plan.
Usually, the debtor continues to operate the business; however, sometimes the bankruptcy court will appoint a trustee to oversee the business if the court finds cause to do so related to fraud, perceived mismanagement and other forms of malfeasance.
The U.S. Trustee, the bankruptcy arm of the Justice Department, will appoint one or more committees to represent the interests of the creditors and stockholders in working with the company to develop a plan of reorganization. The trustee usually appoints the following:
- The “official committee of unsecured creditors”
- Other creditors committee representing a distinct class of creditors such as secured creditors or subordinated bond holders; and
- Stockholders committee.
Once an agreement is reached it must be confirmed by the court in accordance with the Bankruptcy Code before it can be implemented. Even if creditors (and sometimes stockholders) vote to reject the plan, the court can disregard the vote and confirm the plan if it believes the parties are treated fairly.
Neiman Marcus pursued a “prepackaged” or “prepack” Chapter 11 in which the company obtained support of over two-thirds of its creditors to reorganize before filing. Under the plan, the Company would eliminate about $4 billion of $5.5 billion of debt. The creditors also committed a $675 million DIP facility that will be replaced with a $750 million facility once the plan is confirmed by the court.
The Role of Valuation in Bankruptcy
Valuation issues are interwound in bankruptcy proceedings, especially in Chapter 11 filings when a company seeks to reorganize. Creditors and the debtor will hire legal and financial advisors to develop a reorganization plan that maximizes value and produces a reorganized company that has a reasonable likelihood of producing sufficient cash flows to cover its obligations.
There are typically three valuation considerations for companies restructuring through Chapter 11 Bankruptcy.
- Companies must prove that a Chapter 11 Restructuring is in the “best interest” of its stakeholders;
- A cash flow test must prove that post-reorganization the debtor will be able to fund obligations; and,
- “Fresh Start Accounting” must be adopted in which the balance sheet is restated to fair value.
Sometimes as is the case with Neiman Marcus there is a fourth valuation-related issue that deals with certain transactions that may render a company insolvent.
Fraudulent Conveyance
A side story to Neiman Marcus relates to the 2018 transaction in which the shares of MyTheresa were transferred in 2018 to bankruptcy-remote affiliates of PE owners Ares and CPPIB. Under U.S. bankruptcy law, transferring assets from an insolvent company is a fraudulent transaction.
During 2017, Neiman Marcus publicly declared the subsidiaries that held the shares were “unrestricted subsidiaries.” Once the distribution occurred in September 2018, creditors litigated the transaction. All but one (Marble Ridge) settled in 2019 as part of the previously described debt restructuring.
Since the bankruptcy filing occurred, the unsecured creditors commissioned a valuation expert to review the transaction to determine whether Neiman Marcus was solvent as of the declaration date, immediately prior to the distribution and after the distribution. As shown in Figure 5, the creditors’ expert derived a negative equity value on all dates. If the court accepted the position, then presumably Ares and CPPIB would be liable for fraudulent conveyance.
At the time the distribution occurred, Neiman Marcus put forth an enterprise valuation of $7 billion and relied upon the opinion of two national law firms that it was within its rights to execute the transaction. Since filing, the PE owners have commissioned one or more valuation experts whose opinion has not been disclosed.
On July 31, 2020, the committee of unsecured creditors and the Company reached a settlement related to the fraudulent conveyance claims arising from the MyTheresa transaction. Ares and CPPIB agreed to contribute 140 million MyTheresa Series B preferred shares, which represent 56% of the B class shares, to a trust for the benefit of the unsecured creditors. The Company also agreed to contribute $10 million cash to the trust. A range of value for the series B shares of $0 to $275 million was assigned in a revised disclosure statement filed with the bankruptcy court.
Marble Ridge, which served on the committee, did not view the settlement as sufficient as was the case in 2019 when it did not participate in the note exchange as part of the 2018 litigation settlement.
During August, it became known that Marble Ridge founder Dan Kamensky pressured investment bank Jeffrey’s not to make a bid for the shares that were to be placed in a trust because it planned to bid, too (reportedly 20 cents per share compared to 30 cents or higher by Jeffrey’s). The anti-competitive action was alleged to have cost creditors upwards of $50 million. Marble Ridge subsequently resigned from the creditors committee and announced plans to close the fund. Kamensky was arrested on September 7th and charged with securities fraud, extortion, wire fraud, extortion, and obstruction of justice, according to the U.S. Attorney’s Office for the Southern District of New York.
Best Interest Test
A best interest test must show that the reorganization value is higher than the liquidation value of the company, to ensure that the creditors in Chapter 11 receive at least as much under the restructuring plan as they would in a Chapter 7 liquidation.
In the case of Neiman Marcus, the liquidation vs. reorganization valuation analysis was a formality because most unsecured creditors and the Company agreed to a prepackaged plan subject to resolution of such items as the MyTheresa shares. Nonetheless, we summarize both for illustration purposes.
Liquidation Analysis
A rough calculation of Neiman Marcus’ liquidation value is included below, based on balance sheet data from April 2019 as these are the most current figures available.
Substantial value in a liquidation analysis depends upon what an investor would be willing to pay for the rights to the Neiman Marcus name as well as its customer lists and proprietary IP code. The recovery ratio applied to Neiman Marcus’ inventory is higher than expected recovery ratios across the broader apparel industry since much of Neiman’s inventory is designer goods. Nonetheless, the analysis implies creditors would face a significant haircut in a Chapter 7 liquidation scenario.
Reorganization (Going Concern) Analysis
The reorganization value represents the value of the company once it has emerged as a going concern from Chapter 11 bankruptcy. Typically, the analysis will develop a range of value based upon (i) Discounted Cash Flow (“DCF”) Method; (ii) Guideline Public Company Method; and (iii) Guideline Transaction Method.
Both guideline methods develop public company and M&A “comps” to derive representative multiples to apply to the subject company’s earnings and cash flow. Market participants tend to focus on enterprise value (market value of equity and debt net of cash) in relation to EBITDA. Secondary multiples include enterprise value in relation to EBIT, EBIT less ongoing Capex, and revenues.
As it relates to Neiman Marcus, we note that Lazard Freres & Co. (“Lazard”) as financial advisor focused on adjusted EBITDA for the LTM period ended February 1, 2020 and the projected 12 months ended February 1, 2022. In doing so, Lazard looked past 2020 and 2021 as excessively abnormal years due to the COVID19 induced recession. Our observation is that this treatment (for now) is largely consistent with how many market participants are treating various earning power measures in industries that were severely impacted by the downturn.
A DCF analysis for Neiman Marcus that assumes the Company emerges from bankruptcy in the fall of 2020 will incorporate the impact of the adverse economy as reflected in presumably subpar operating performance in the first year or two of the projections. More generally, the DCF method involves three key inputs: the forecast of expected future cash flows, terminal value, and discount rate.
- Forecast of Expected Future Cash Flows: Valuation practitioners typically develop cash flow forecasts for specific periods of time, ranging anywhere from three to ten years, or as many periods as necessary until a stable cash flow stream can be realized. Key elements of the forecast include projected revenue growth, gross margins, operating costs, and working capital and capital expenditure requirements. Data from other publicly traded companies within similar lines of business can serve as good reference points for the evaluation of each element in the forecast.
- Terminal Value: The terminal value represents all cash flow values outside of the discrete forecast period. This value is calculated through capitalizing cash-flow at the end of the forecast period, based on expectations of long-term cash flow growth rate and discount rate. Alternatively, a terminal value can be determined through the application of projected or current market multiples.
- Discount Rate: The discount rate is essential in estimating the present value of forecasted cash flows. A proper discount rate is developed from assumptions about costs of equity and debt capital, and capital structure of the new entity. For costs of equity capital, a build-up method is used with long-term risk-free rate, equity premia, and other industry/company-specific factors as inputs. Cost of debt capital and new capital structure can be based on benchmark rates or comparable corporations. The discount rate should reflect the financial risks that come with the projected cash flows of the restructured entity.
The sum of the present values of all forecasted cash flows indicates the enterprise value of the emerging company for a set of forecast assumptions. Reorganization value is the total sum of expected business enterprise value and proceeds from the sale or disposal of assets during the reorganization.
Cash Flow Test
The second valuation hurdle Neiman Marcus will have to jump is a cash flow test. The cash flow test determines the feasibility of the reorganization plan and the solvency of future operations. Since a discounted cash flow analysis is typically used to determine reorganization value, the projected cash flows from this analysis are compared to future interest and principal payments due.
Additionally, the cash flow test details the impact of cash flows on the balance sheet of the restructured entity, entailing modeling changes in the asset base and in the debt obligations of and equity interests in the company. Therefore, the DCF valuation and cash flow tests go together because the amount of debt that is converted to equity creates cash flow capacity to service the remaining debt. If the cash flow model suggests solvent operations for the foreseeable future, the reorganization plan is typically considered viable.
Fresh-Start Accounting
When emerging from bankruptcy in the case of going concern, fresh-start accounting could be required to allot a portion of the reorganization value to specific intangible assets. The fair value measurement of these assets requires the use of multi-period excess earnings method or other techniques of purchase price allocations.
Conclusion
Neiman Marcus plans to eliminate about $4 billion of over $5 billion of debt and $200 million of annual interest expense in a reorganization plan that was approved by U.S. bankruptcy judge David Jones in early September. The plan will transfer the bulk of ownership to the first lien creditors, including PIMCO, Davidson Kempner Capital Management and Sixth Street Partners. PIMCO will be the largest shareholder with three of seven board seats.
Other creditors will receive, in effect, a few pennies to upwards of one-third of what they were owed depending in part on the value of MyTheresa Class B preferred shares that were contributed to a trust for the benefit of unsecured creditors. Also, the Company’s term loan lenders, second lien and third lien note holders waived their right to assert deficiency claims and thereby eliminated upwards of $3.3 billion of additional claims in the general unsecured claims pool (now limited to $340 to $435 million).
Lazard estimated the value of the reorganized Company upon exit from bankruptcy to approximate $2.0 billion to $2.5 billion on an enterprise basis with the equity valued at $800 million to $1.3 billion.
Creditors and the Company negotiated a plan that has presumably maximized (or nearly so) value to each creditor class based upon the priority of their claims. We are not privy to the analysis each class produced and how their views of the analyses, relative negotiating strength and the like drove the settlement.
Ultimately, the performance of the reorganized Neiman Marcus will determine the eventual amount recovered by creditors to the extent shares are not sold immediately. Some creditors would be expected to sell the shares immediately, while others who have flexibility to hold equity interests and have a favorable view of the reorganized company’s prospects may wait to potentially realize a greater recovery.
In Figure 9 we have constructed a waterfall analysis which we compare with the actual settlement. We assume a range of enterprise values based upon multiples of projected FY22 EBITDA, or $342 million, and compare the residual equity after each claimant class is settled to provide perspective on the creditors’ recovery.
This waterfall implies that class 5 through 7 debt, which for our purposes here is more or less pari passu, should receive the bulk if not all of the equity given $2.4 billion of debt owed to the three classes. Because ~10% of the equity was allocated to subordinated creditors, the senior lenders may have been willing to cede some ownership in order to reach a settlement more quickly.
Per the settlement, ~90% of the equity was allocated to the 2019 senior secured term loan (~$2.3 billion; 87.5%), 2013 residual senior secured loan ($13 million) and first lien debentures ($129 million; 2.8%).
Recovery for the 2019 senior secured creditors was estimated in the Disclosure Statement to approximate 33% compared to about 19% for the first lien debentures.
Interests in MyTheresa also impacted projected recoveries for the junior and unsecured creditors, a byproduct of the litigation to settle the fraudulent conveyance claims related to the 2018 transaction.
The second lien noteholders ($606 million) would obtain (i) 1.0% equity interest; (ii) seven-year warrants to purchase up to 25% of the reorganized equity at an agreed upon strike price; (iii) participation rights in the exit loan and associated fees; and (iv) an economic interest in MyTheresa in the form of $200 million of 7.5% PIK notes.
The disclosure statement indicates the recovery equates to less than 2% of what is owed to the second lien note holders, which appears to exclude whatever value is attributable to the PIK notes because 1% of the Newco equity would equate to $800 thousand to $1.3 million of value based upon a range of equity value of $800 million to $1.3 billion.1
The third lien noteholders ($1.3 billion) would obtain (i) 8.5% equity interest; (ii) participation rights in the exit loan and associated fees; and (iii) a 50% economic and 49.9% voting interest in the common equity of MyTheresa.
The disclosure statement indicates the recovery to be 5.6% of the claim, which also appears to exclude the value of the MyTheresa common shares if the equity interest is equal to $68 million to $110 million based upon an aggregate equity value of $800 million to $1.3 billion.
The issuance of $200 million of PIK notes and transfer of 50% of the common equity interest in MyTheresa to the second and third lien noteholders appears to be a result of the 2019 debt restructuring and settlement of the 2018 litigation surrounding the 2018 transfer of MyTheresa to the parent company and out of the reach of creditors.
The final wrinkle in the disputed MyTheresa saga involved an agreement reached in late July 2020 in which Ares and CPPIB agreed to allocate 140 million (56%) MyTheresa Series B preferred shares to a trust established for unsecured creditors. Neiman Marcus as debtor also agreed to contribute $10 million cash to the trust.
At the time the settlement was announced in late July, the value attributed to the preferred shares was $162 million; however, the August 3 Disclosure Statement assigned a range of value of $0 to $275 million. Marble Ridge reportedly had planned to bid 20 cents per share to provide certain unsecured creditors (e.g. unpaid vendors) immediate liquidity before the fracas with Jeffrey’s occurred.
Neiman Marcus emerged from Chapter 11 by September 30, 2020 in a streamlined process via the prepackaged negotiations that will leave the Company with significantly less debt in its capital structure. As outlined in this article, valuation is an important factor in the bankruptcy process.
1 The issuance of $200 million of PIK notes and transfer of 50% of the common equity interest in MyTheresa to the second and third lien noteholders appears to be a result of the 2019 debt restructuring and settlement of the 2018 litigation surrounding the 2018 transfer of MyTheresa to the parent company and out of the reach of creditors.
2 The projected 1.4% recovery rate for the second lien notes apparently excludes the MyTheresa PIK notes, while the projected 5.6% recovery rate for the third lien notes likewise appears to exclude the 50% common equity interest in MyTheresa.
The Levels of Value
Business appraisers refer to different kinds of values for businesses and business interests in terms of “levels of value.” Since value is a function of expected cash flows, risk and growth, the different levels of value are defined by these factors as they relate to each level. Beginning in 1990, a three-level chart reflected the manner in which most appraisers looked at the value of businesses and interests in them. Currently, most appraisers think in terms of four levels of value, and these charts provide a conceptual overview of these levels. Business appraisers use certain valuation “premiums” and “discounts” to describe movement between the levels on the chart. The first four charts refer to the value of equity of businesses. The last chart translates the levels of value in terms of enterprise (total capital) value. The charts are taken or derived from Business Valuation: An Integrated Theory Third Edition by Z. Christopher Mercer, FASA, CFA, ABAR, and Travis W. Harms, CFA, CPA/ABV.
If you have questions pertaining to the valuation of businesses or business interests, feel free to contact us to discuss in confidence.
Click here to download the charts.
Mercer Capital’s Valuation Process Timeline
Mercer Capital’s valuation process consists of three stages: the engagement phase, the valuation phase, and the report phase. The timeline is typically 4-6 weeks.
Engagement Phase
- Initial call
When you call us, we discuss (1) your firm, (2) your situation, and (3) your needs. During our discussions, we determine the type and scope of services that your project will entail. - Provide engagement letter (immediately)
The engagement letter provides a descriptive project overview and sets forth the timetable and fee agreement. At this point, we also send you a preliminary information request.
Valuation Phase
- Initial research
We conduct a preliminary analysis of your company, including research and review of industry data and any information you provide. - Leadership interview (after initial research)
We visit with appropriate members of management to review your company’s background, financial position, and outlook, and respond to questions from management. - Analysis and report preparation
Following the leadership interview, the analysis is completed and the valuation report is prepared to explain and support our analysis.
Report Phase
- Draft provided for client review
Your review of the draft report is an important element in the process. We discuss the draft report with you to assure factual correctness and to clarify questions you have about the report. - Final report & discuss next steps
Upon final review, the valuation is issued. Any follow-up consulting, if needed, is begun.
Contact one of our professionals if you have questions or to discuss your needs in confidence at 1.800.769.0967.
Standard of Value in Bankruptcy
The determination of the appropriate “standard of value” when performing business valuations and other valuation related analyses for bankruptcy purposes is critical. While a standard of value is often specified, it is frequently the case that the specific standard of value is not well defined in either the Bankruptcy Code, applicable state statutes, or in judicial guidance. Further, the standard of value terminology used in valuations for bankruptcy purposes often differs from the terminology used for other (non-bankruptcy) purposes.
General Standards of Value
Traditional business valuations (those for purposes other than bankruptcy) are typically performed using one of the three basic standards of value: (1): fair market value, (2): fair value, or (3): investment value. While some might argue that a fourth standard of value – intrinsic value – is available to business appraisers and should be included among the typical, standards of value, use of this standard of value is rarely mandated by valuation guidance, statues, or law. Furthermore, intrinsic value (also referred to as fundamental value) is not as well defined as the other standards of value, and while mentioned in certain case law, such references rarely provide a specific definition of the standard. As such, intrinsic value is not addressed in this article.
Fair Market Value
The most recognized and accepted standard of value in relation to business and securities valuation in the U.S. is fair market value. Fair market value applies to nearly all federal and state income and corporate tax matters and is either the specified legal standard or guidepost of value for many other valuation purposes. Additionally, alternative standards of value are also frequently equated to their functional equivalents under fair market value. Although multiple definitions of fair market value exist, they are quite consistent and functionally almost identical.
The definition established for fair market value in tax regulations by Treasury Regulation Section 20.2031-1(b) is as follows:
The price at which the property would change hands between a willing buyer and a willing seller when the former is not under any compulsion to buy and the latter is not under any compulsion to sell, both parties having reasonable knowledge of relevant facts.
A second definition of fair market value is available from the International Glossary of Business Valuation Terms as:
[T]he price, expressed in terms of cash equivalents, at which property would change hands between a hypothetical willing and able buyer and a hypothetical willing and able seller, acting at arm’s length in an open and unrestricted market, when neither is under compulsion to buy or sell and when both have reasonable knowledge of the relevant facts.
Yet a third definition of fair market value is provided within Section 3(18) (B) of the Employee Retirement Income Security Act wherein adequate consideration in the case of an asset for which there is no generally recognized market (e.g., stock of a closely held corporation) is defined as the fair market value of the asset as determined in good faith by the trustee or named fiduciary pursuant to the terms of the plan and in accordance with the regulations promulgated by the Secretary of Labor. The term “fair market value” is defined in proposed section 2510.3-18(b) (2) (i) as follows:
The price at which an asset would change hands between a willing buyer and a willing seller when the former is not under any compulsion to buy and the latter is not under any compulsion to sell, and both parties are able, as well as willing, to trade and are well-informed about the asset and the market for that asset.
It is widely recognized that these definitions are in general agreement, particularly in regard to their common references to (i) willing buyers and sellers, (ii) lack of compulsion, and (iii) reasonable knowledge of relevant facts. While International Glossary of Business Valuation Terms definition includes reference to (i) the hypothetical nature of the parties to the exchange, (ii) the arm’s length nature of the exchange, and (iii) an open and unrestricted market, it is widely held that these differences in the definitions are immaterial in most situations. As such, while three commonly used definitions exist, fair market value is the most well and consistently understood of the standards of value.
Fair Value
The fair value standard of value is also commonly used by business appraisers. Unlike fair market value, however, fair value’s different definitions are intentionally fashioned for different purposes. Within one purpose (financial reporting), the application of fair value is quite consistent due to now well-established standards codifications issued by the Financial Accounting Standards Board (“FASB”). In the broader legal and financial environment, the definition and or application of fair value can vary significantly from one state to another.
Within the American Institute of Certified Public Accountants’ (AICPA) Statements on Standards for Valuation Services (SSVS), fair value is described as having two commonly used, albeit distinctly different definitions.
Financial Reporting
For financial reporting purposes, fair value is defined under the FASB’s Accounting Standards Codification (ASC) glossary as:
the price that would be received to sell an asset or paid to transfer a liability in an orderly transaction between market participants at the measurement date.
This definition is further discussed in ASC 820 as the price being based upon a hypothetical transaction for the subject asset or liability at the measurement date, considered from the perspective of a market participant. According to ASC 820, a market participant is: (i) an unrelated party, (ii) knowledgeable of the subject asset or liability, (iii) able to transact, and (iv) motivated but not compelled to transact.
This standard of value and the definition for this standard of value is universally used for financial accounting purposes within the U.S. Although quite similar to the definitions for fair market value in many respects, the definition of fair value for financial reporting purposes has distinct differences from the definitions for fair market value – particularly in the application of the market participant perspective.
State Legal Matters (Non-Bankruptcy)
In many states, fair value is the standard of value applicable by statute in regard to cases involving dissenting shareholder rights and is frequently used state minority oppression cases.[1] However, in these settings there may be no single definition or understanding of the fair value standard of value. Alternatively, or as an adjunct to ambiguous state statues, legal precedent may provide the primary guidance for defining fair value.
Investment Value
Investment value is much less commonly utilized by valuation practitioners than fair market value, or fair value. Unlike fair market value and fair value, investment value is rarely a required standard of value. It is most often used to support merger and acquisitions, or other business transaction related matters.
While there is more than one definition of investment value, they are generally considered to be materially similar in meaning, albeit in part due to the definitions’ intentional lack of specificity.
The International Glossary of Business Valuation Terms defines investment value as:
[T]he value to a particular investor based on individual investment requirements and expectations.
Note the intentional generalities and lack of constraints relative to the definitions of fair market value and the definition of fair value in regard to financial reporting matters.
Similarly, albeit somewhat longer, in real estate terminology investment value is defined as:
The specific value of an investment to a particular investor or class of investors based on individual investment requirement; distinguished from market value, which is impersonal and detached.[2]
These two definitions of investment value are generally considered to be equivalent.
Standards of Value in Bankruptcy
As with fair value, the legal terminology describing the applicable standard of value for bankruptcy is not clearly defined in the U. S. Bankruptcy Code, or in applicable state statutes.[3] Unlike standards of value outside of bankruptcy, standards of value within bankruptcy are numerous, lacking in clarity, and inconsistent. Among the standards of value for bankruptcy purposes referenced in the Forensic & Valuation Services Practice Aid – Providing Bankruptcy and Reorganization Services, 2nd Edition Volume 2 — Valuation in Bankruptcy (F&VSPA) are:[4]
- Fair valuation
- Reasonably equivalent value
- Indubitable equivalent
- Present fair salable value
- Fair consideration
The sources for these standards of value include the U.S. Bankruptcy Code, The Uniform Fraudulent Transfer Act (UFTA), and The Uniform Fraudulent Conveyance Act (UFCA). Guidance as to the definitions for these terms, or the application of the terms, are minimal, and often nonexistent, within the Code, the UFTA, or the UFCA. Guidance as available within the Code, the UFTA, or the UFCA is as follows:[5]
Fair Valuation
Bankruptcy Code — Fair Valuation
Section 101(32) of the U.S. Bankruptcy Code defines insolvency as a:
…financial condition such that the sum of such entity’s debt is greater than all of such property, at a fair valuation…
Fair valuation in this context is generally interpreted by bankruptcy case law, albeit not specifically defined, as fair market value.[6]
UFTA — Fair Valuation
Within the UFTA, Section 2(a) indicates, “A debtor is insolvent if the sum of the debtor’s debts is greater than all of the debtor’s assets, at a fair valuation.” The UFTA provides no definition of fair valuation, however, fair valuation is frequently analyzed similarly to fair market value when evaluating solvency.[7]
Reasonably Equivalent Value
Bankruptcy Code — Reasonably Equivalent Value
Section 548 of the U.S. Bankruptcy Code explains that a fraudulent transfer has occurred if a debtor has “received less than a reasonably equivalent value in exchange for such transfer or obligation.” No definition of reasonably equivalent value is provided, although the Code does define value to mean “property, or satisfaction or securing of a present or antecedent debt of the debtor, but does not include an unperformed promise to furnish support to the debtor or to a relative of the debtor.”[8]
The F&VSPA indicates that the courts have historically considered fair market value exchanged when evaluating reasonably equivalent value.[9] However, the U.S. Supreme Court has noted that, reasonably equivalent value is not always evaluated against a fair market value benchmark.[10]
UFTA — Reasonably Equivalent Value
When evaluating whether a transfer was fraudulent to present and future creditors the UFTA considers whether “a reasonably equivalent value [was] exchange[d] for the transfer or obligation.”[11] The fair market value of the assets or debt exchanged is commonly considered. However, as previously referenced in regard to the U.S. Supreme Court, reasonably equivalent value is not always evaluated against a fair market value benchmark.[12]
Indubitable Equivalent
Bankruptcy Code — Indubitable Equivalent
The U.S. Bankruptcy Code mandates that a Chapter 11 plan must be fair and equitable to all holders of secured claims. In circumstances where the debtor’s reorganization plan is accepted over the objections of a secured creditor, the court must ensure the plan provides that secured creditors receive the indubitable equivalent of their respective claims.[13]
Fair Saleable Value
UFCA — Present Fair Saleable Value
Section 2(1) of the UFCA includes a reference to the present fair saleable value of assets in considering insolvency. Some jurisdictions have interpreted present fair saleable value to be similar to fair market value, although other jurisdictions have taken a position whereby the present fair saleable value standard imposes a reduced marketing period.[14]
Fair Consideration
UFCA — Fair Consideration
UFCA’s Section 3 indicates that fair consideration is given for property or an obligation
- When in exchange for such property, or obligation, as a fair equivalent therefore, and in good faith, property is conveyed or an antecedent debt is satisfied, or
- When such property or obligation is received in good faith to secure a present advance or antecedent debt in amount not disproportionately small as compared with the value of the property or obligation obtained.
Therefore, fair consideration is characterized as a good faith transfer whereby the debtor receives reasonably equivalent value.[15] The fair market values exchanged are commonly used when evaluating fair consideration in states that have adopted the UFCA, as they are under the Bankruptcy Code.[16]
Summary
There is simply no clear standard of value that can be universally relied upon in the context of bankruptcy proceedings. Standard of value terminology, definitions, and guidance within the bankruptcy realm are significantly lacking in comparison to that available to business appraisers engaged in tax and financial reporting related matters. In the absence of clear standard of value definitions and guidance, precedent must often be relied upon. It is therefore crucial in bankruptcy endeavors that a business appraiser have knowledge of these standard of value considerations and work closely with experienced bankruptcy attorneys in order to apply the correct standard of value to best serve their client.
[1] Valuing a Business, 5th edition (Pratt, Reilly, Schweihs), p. 45
[2] The Appraisal of Real Estate, 11th edition (Chicago Appraisal Institute, 1996), p. 638.
[3] Forensic & Valuation Services Practice Aid – Providing Bankruptcy and Reorganization Services, 2nd Edition Volume 2 — Valuation in Bankruptcy
[4] Ibid.
[5] Ibid.
[6] See Andrew Johnson Properties, Inc., CCD Dec. ¶ 65, 254 (D.C. Tenn. 1974); Briden v. Foley, 776 F.2d 379, 382 (1st Cir. 1985)
[7] F&VSPA
[8] F&VSPA
[9] Barber v. Golden Seed Co., 129 F.3d 382, 387 (7th Cir. 1997)
[10] BFP v. Resolution Trust Corp., 511 U.S. 531, 548 (1994).
[11] UFTA Sections 4(a)(2) and 5(a).
[12] BFP v. Resolution Trust Corp., 511 U.S. 531, 548 (1994).
[13] USC 1129(b)(2)(A).
[14] F&VSPA
[15] HBE Leasing Corp. v. Frank, 48 F.3d 623, 633 (2d Cir. 1994).
[16] F&VSPA
2020 Mid-Year Core Deposit Intangibles Update
In our last update regarding core deposit trends published in October 2019, we described a decreasing trend in core deposit intangible asset values in light of falling interest rates. As a result, the interest-rate environment was not positive for core deposit valuations before COVID. Less than six months later, the World Health Organization declared the coronavirus outbreak a pandemic, and the world changed drastically. In response, the Fed cut rates to effectively zero, and the yield on the benchmark 10-year Treasury reached a record low. While many factors are pertinent to analyzing a deposit base, a significant driver of value is market interest rates. In a world of cut-rate alternative wholesale funding, core deposits have lost some of their luster.
M&A Activity
As shown in Figure 2, only ten whole-bank transactions were announced in the second quarter of 2020, representing the fewest deals announced during a quarter over the time period analyzed. For comparison, the first quarter of 2009 posted the second lowest figure with 19 announced deals. It seems unlikely that deal activity will fully recover in the near future. There are several issues hindering deal activity:
- Credit quality. Until there is more certainty surrounding credit quality, it will be difficult to analyze a target’s loan portfolio. According to S&P Global Market Intelligence, deferrals peaked at an average of approximately 14% of community banks’ overall loan portfolios. On one hand, borrower payments have continued for most loans, even for some borrowers who were granted pandemic-related deferrals. However, the Paycheck Protection Program (“PPP”) has expired and supplemental unemployment benefits are ending while unemployment remains high.
- Due diligence constraints. It remains functionally difficult to complete due diligence in an environment where travel may be unsafe, if not entirely prohibited.
- General uncertainty. It is unclear what the fall will bring – both from a pandemic perspective and from a policy perspective as it pertains to November elections. The future is very cloudy on what type of recovery to expect.
- Low demand for core deposits. Alternative cost of funding is low and banks are generally flush with liquidity at the moment. According to S&P Global Market Intelligence, the average loan to deposit ratio has fallen to a 29-year low, and the Federal Reserve’s H.8 indicates that deposit balances increased over 21% in the past four quarters. The bulk of the increase is attributable to transaction accounts rather than higher-cost time deposits. Consumer depositors are nervous about the next few months and are hesitant to tie up funds, and commercial depositors are hesitant to invest in new projects given the economic uncertainty.
On the other hand, there are a couple of factors that might cause some banks to resume M&A discussions more quickly.
- Margin compression. Net interest margin continues to compress nationwide, a trend that is expected to continue for the foreseeable future. Loan rates are dropping faster than deposit rates and pandemic-related charge-offs will begin to materialize soon. Deals can offer operational efficiencies that many banks will need.
It could be difficult for some banks to produce acceptable shareholder returns if margins fall as much as many expect. - Potential reversal of deposit influx. Many PPP recipients seem to be saving their funds in deposit accounts as a hedge against economic uncertainty. As these funds are deployed for payroll or other expenses, the savings trend could reverse. It is possible that banks will be hesitant to reduce deposit rates further due to fear of deposit outflows or in anticipation of better loan demand as the economy recovers.
Trends in CDI Values
Using data compiled by S&P Global Market Intelligence, we analyzed trends in core deposit intangible (CDI) assets recorded in whole bank acquisitions completed from 2000 through June 30, 2020. CDI values represent the value of the depository customer relationships obtained in a bank acquisition. CDI values are driven by many factors, including the “stickiness” of a customer base, the types of deposit
accounts assumed, and the cost of the acquired deposit base compared to alternative sources of funding. For our analysis of industry trends in CDI values, we relied on S&P Global Market Intelligence’s definition of core deposits.1 In analyzing core deposit intangible assets for individual acquisitions, however, a more detailed analysis of the deposit base would consider the relative stability of various account types. In general, CDI assets derive most of their value from lower-cost demand deposit accounts, while often significantly less (if not zero) value is ascribed to more rate-sensitive time deposits and public funds, or to non-retail funding sources such as listing service or brokered deposits which are excluded from core deposits when determining the value of a CDI.
Figure 3 summarizes the trend in CDI values since the start of the 2008 recession, compared with rates on 5-year FHLB advances. Over the post-recession period, CDI values have largely followed the general trend in interest rates—as alternative funding became more costly in 2017 and 2018, CDI values generally ticked up as well, relative to post-recession average levels. Throughout 2019, CDI values exhibited a declining trend in light of yield curve inversion and Fed cuts to the target federal funds rate during the back half of 2019. This trend was exacerbated in March 2020 when rates were effectively cut to zero.
The average CDI value declined 110 basis points from June 2019 to June 2020 while the five-year FHLB advance declined 157 basis points over the same period. The decline in CDI values has been somewhat slower than the drop in benchmark interest rates, in part, because deposit costs typically lag broader movements in market interest rates. For example, the average money market deposit rate and the average one-year CD rate declined 14 basis points and 43 basis points, respectively, over the same one-year period. In general, banks were slow to raise deposit rates in the period of contractionary monetary policy through 2018 and, as a result, rates remain below benchmark levels leaving banks less room to reduce rates further. For CDs, the lagging trend is even more pronounced. Now that rates are on the decline, banks have been stuck with CDs that cannot be repriced until their maturities even as benchmark rates fall. While time deposits typically are not considered “core deposits” in an acquisition and thus would not directly influence CDI values, they do significantly influence a bank’s overall cost of funds.
Average CDI values have fallen for the past six consecutive quarters. Since early 2008 CDI values have averaged 1.45% of deposits, meaningfully lower than long-term historical levels which averaged closer to 2.5-3.0% in the early 2000s.
Trends in Deposit Premiums Relative to CDI Asset Values
Core deposit intangible assets are related to, but not identical to, deposit premiums paid in acquisitions. While CDI assets are an intangible asset recorded in acquisitions to capture the value of the customer relationships the deposits represent, deposit premiums paid are a function of the purchase price of an acquisition. Deposit premiums in whole bank acquisitions are computed based on the excess of the purchase price over the target’s tangible book value, as a percentage of the core deposit base. While deposit premiums often capture the value to the acquirer assuming the established funding source of the core deposit base (that is, the value of the deposit franchise), the purchase price also reflects factors unrelated to the deposit base, such as the quality of the acquired loan portfolio, unique synergy opportunities anticipated by the acquirer, etc. Additional factors may influence the purchase price to an extent that the calculated deposit premium doesn’t necessarily bear a strong relationship to the value of the core deposit base to the acquirer. This influence is often less relevant in branch transactions where the deposit base is the primary driver of the transaction and the relationship between the purchase price and the deposit base is more direct. Figure 4 presents deposit premiums paid in whole bank acquisitions as compared to premiums paid in branch transactions.
As shown in Figure 5, deposit premiums paid in whole bank acquisitions have shown more volatility than CDI values. Despite improved deal values prior to the second half of 2019, deposit premiums in the range of 7% to 10% remain well below the pre-Great Recession levels when premiums for whole bank acquisitions averaged closer to 20%.
Deposit premiums paid in branch transactions have generally been less volatile than tangible book value premiums paid in whole bank acquisitions. Branch transaction deposit premiums averaged in the 4.5%-7.5% range during 2019, up from the 2.0-4.0% range observed in the financial crisis. Only five branch transactions were completed in the first half of 2020, but the range of their implied premiums is in line with 2019 levels. There have been several branch transactions announced since the onset of the pandemic; however, pricing information is not available for any of those transactions.
Accounting For CDI Assets
Based on the data for acquisitions for which core deposit intangible detail was reported, a majority of banks selected a ten-year amortization term for the CDI values booked. Less than 10% of transactions for which data was available selected amortization terms longer than ten years. Amortization methods were somewhat more varied, but an accelerated amortization method was selected in approximately half of these transactions.
For more information about Mercer Capital’s core deposit valuation services, please contact us.
Originally appeared in Mercer Capital’s Bank Watch, August 2020.
Valuation Considerations in Bankruptcy Proceedings
The outbreak of COVID-19 in the United States has caused a severe public health crisis and an unprecedented level of economic disruption. While some economic activity is beginning to come back, predictions for longer-term negative economic impacts have also become more prevalent.
The initial thoughts of a quick V-shaped economic recovery have been replaced in all but the most optimistic minds with a more nuanced consideration of how this situation will impact businesses within different industries and geographic areas over the next several years.
In some of the most hard-hit industries, we are already seeing what is expected to be a prolonged surge in corporate restructurings and bankruptcy filings.
The decision to file for bankruptcy does not necessarily signal the demise of the business. If executed properly, Chapter 11 reorganization affords a financially distressed or insolvent company an opportunity to restructure its liabilities and emerge from the proceedings as a viable going concern. Along with a bankruptcy filing (more typically before and/or in preparation for the filing), the company usually undertakes a strategic review of its operations, including opportunities to shed assets or even lines of business. During the reorganization proceeding, stakeholders, including creditors and equity holders, negotiate and litigate to establish economic interests in the emerging entity. The Chapter 11 reorganization process concludes when the bankruptcy court confirms a reorganization plan that both specifies a reorganization value and reflects the agreed upon strategic direction and capital structure of the emerging entity.
In addition to fulfilling technical requirements of the bankruptcy code and providing adequate disclosure, two characteristics of a reorganization plan are germane from a valuation perspective1 :
- The plan should demonstrate that the economic outcomes for any consenting stakeholders are superior under the Chapter 11 proceeding compared to a Chapter 7 proceeding, which provides for more direct relief through a liquidation of the business. This is generally referred to as the “best interests test.”
- The plan should demonstrate that, upon confirmation by the bankruptcy court, it will not likely result in liquidation or further reorganization of the business. This is generally referred to as the “cash flow test.”
Finally, upon emerging from bankruptcy, companies are required to apply “fresh start” accounting, under which all assets of the company, including identifiable intangible assets, are recorded on the balance sheet at fair value.
Best Interest Test
Within this context of a best interests test, valuation specialists can provide useful financial advice to:
- Establish the value of the business under a Chapter 7 liquidation premise.
- Measure the reorganization value of a business, which, absent liquidation, represents the economic “pie” from which stakeholder claims can be satisfied. A plan confirmed by a bankruptcy court should establish a reorganization value that exceeds the value of the company under a liquidation premise.
A Floor Value: Liquidation Value
If a company can no longer pay its debts and does not restructure, it will undergo Chapter 7 liquidation. The law generally mandates that Chapter 11 restructuring only be approved if it provides a company’s creditors with their highest level of expected repayment. The Chapter 11 restructuring plan must be in the best interest of the creditors (relative to Chapter 7 liquidation) in order for it to be approved. Given this understanding of the law, the first valuation step in successful Chapter 11 restructuring is assessing the alternative, liquidation value. This value will be a threshold that any reorganization plan must outperform in order to be accepted by the court.
The first valuation step in successful Chapter 11 restructuring is assessing the alternative, liquidation value
The value in liquidating a business is unfortunately not as simple as finding the fair market value, or even a book value for all the assets. The liquidation premise generally contemplates a sale of the company’s assets within a short period. Any valuation must account for the fact that inadequate time to place the assets in the open market means that the price obtained is usually lower than the fair market value.
Everyone has seen the “inventory liquidation sale” sign or the “going out of business” sign in the shop window. Experience tells us that the underlying “marketing period” assumptions made in a liquidation analysis can have a material impact on the valuation conclusion.
From a technical perspective, liquidation value can occur under three sub-sets: assemblage of assets, orderly liquidation, and forced liquidation. As implied, these are asset-based approaches to valuation that differ in their assumptions surrounding the marketing period and manner in which the assets are disposed. There are no strict guidelines in the bankruptcy process related to these three sub-sets; bankruptcy courts generally determine the applicable premise of value on a case by case basis.
The determination (and support) of the appropriate premise can be an important component to the best interests test.
In general, the discount from fair market value implied by the price obtainable under a liquidation premise is related to the liquidity of an asset. Accordingly, valuation analysts often segregate the assets of the petitioner company into several categories based upon the ease of disposal.
Liquidation value is estimated for each category by referencing available discount benchmarks. For example, no haircut would typically be applied to cash and equivalents while less liquid assets (such as accounts receivable or inventory) would likely incur potentially significant discounts. For some assets categories, the appropriate level of discount can be estimated by analyzing the prices commanded in the sale of comparable assets under a similarly distressed sale scenario.
Reorganization Value
Once an accurate liquidation value is established, the next step is determining whether the company can be reorganized in a way that provides more value to a company’s stakeholders than discounted asset sales. ASC 852 defines reorganization value as2:
The value attributable to the reconstituted entity, as well as the expected net realizable value of those assets that will be disposed of before reconstitution occurs. This value is viewed as the value of the entity before considering liabilities and approximates the amount a willing buyer would pay for the assets of the entity immediately after restructuring.
Typically the “value attributable to the reconstituted entity,” the new enterprise value for the restructured business, is the largest element of the total reorganization value. Unlike a liquidation, this enterprise value falls under what valuation professionals call a “going concern” value premise. This means that the business is valued based on the return that would be generated by the future operations of the emerging, restructured entity and not what one would be paid for selling individual assets.
To measure enterprise value … reorganization plans primarily use a type of income approach – the discounted cash-flow (DCF) method
The intangible elements of going concern value result from factors such as having a trained work force, a loyal customer base, an operational plant, and the necessary licenses, systems, and procedures in place. To measure enterprise value in this way, reorganization plans primarily use a type of income approach, the discounted cash-flow (DCF) method. The DCF method estimates the net present value of future cash-flows that the emerging entity is expected to generate. Implementing the discounted cash-flow methodology requires three basic elements:
- Forecast of Expected Future Cash Flows. Guidance from management can be critical in developing a supportable cash-flow forecast. Generally, valuation specialists develop cash flow forecasts for discrete periods that may range from three to ten years. Conceptually, one would forecast discrete cash flows for as many periods as necessary until a stabilized cash-flow stream can be anticipated. Due to the opportunity to make broad strategic changes as part of the reorganization process, cash flows from the emerging entity must be projected for the period when the company expects to execute its restructuring and transition plans. Major drivers of the cash flow forecast include projected revenue, gross margins, operating costs and capital expenditure requirements. The historical experience of the petitioner company, as well as information from publicly traded companies operating in similar lines of business can provide reference points to evaluate each element of the cash-flow forecast.
- Terminal Value. The terminal value captures the value of all cash flows after the discrete forecast period. Terminal value is determined by using assumptions about long-term cash flow growth rate and the discount rate to capitalize cash flow at the end of the forecast period. This means that the model takes the cash flow value for the last discrete year, and then grows it at a constant rate for perpetuity. In some cases the terminal value may be estimated by applying current or projected market multiples to the projected results in the last discrete year. An average EV/EBITDA of comparable companies, for instance, might be used to find a likely market value of the business at that date.
- Discount Rate. The discount rate is used to estimate the present value of the forecasted cash flows. Valuation analysts develop a suitable discount rate using assumptions about the costs of equity and debt capital, and the capital structure of the emerging entity. Costs of equity capital are usually estimated by utilizing a build-up method that uses the long-term risk-free rate, equity risk premia, and other industry or company-specific factors as inputs. The cost of debt capital and the likely capital structure may be based on benchmark rates on similar issues and the structures of comparable companies. Overall, the discount rate should reasonably reflect the operational and market risks associated with the expected cash-flows of the emerging entity.
The sum of the present values of all the forecasted cash flows, including discrete period cash flows and the terminal value, provides an indication of the business enterprise value of the emerging entity for a specific set of forecast assumptions.
The reorganization value is the sum of that expected business enterprise value of the emerging entity and proceeds from any sale or other disposal of assets during the reorganization.
Since the DCF-determined part of this value relies on so many forecast assumptions, different stakeholders may independently develop distinct estimates of the reorganization value to facilitate negotiations or litigation.
The eventual confirmed reorganization plan, however, reflects the terms agreed upon by the consenting stakeholders and specifies either a range of reorganization values or a single point estimate.
In conjunction with the reorganization plan, the courts also approve the amounts of allowed claims or interests for the stakeholders in the restructuring entity. From the perspective of the stakeholders, the reorganization value represents all of the resources available to meet the post-petition liabilities (liabilities from continued operations during restructuring) and allowed claims and interests called for in the confirmed reorganization plan.
If this agreed upon reorganization value exceeds the value to the stakeholders of the liquidation, then there is only one more valuation hurdle to be cleared: a cash flow test. This is an examination of whether the restructuring creates a company that will be viable for the long term—that is not likely to be back in bankruptcy court in a few years
Cash Flow Test
For a company that passes the best interest test, this second requirement represents the last valuation hurdle to successfully emerging from Chapter 11 restructuring. Within the context of a cash flow test, valuation specialists can demonstrate the viability of the emerging entity’s proposed capital structure, including debt amounts and terms given the stream of cash flows that can be reasonably expected from the business. The cash flow test essentially represents a test of the company’s current and projected future financial solvency.
Even if a company shows that the restructuring plan will benefit stakeholders relative to liquidation, the court will still reject the plan if it is likely to lead to liquidation or further restructuring in the foreseeable future. To satisfy the court, a cash flow test is used to analyze whether the restructured company would generate enough cash to consistently pay its debts. This cash flow test can be broken into three parts.
The cash flow test essentially represents a test of the company’s current and projected future financial solvency
The first step in conducting the cash flow test is to identify the cash flows that the restructured company will generate. These cash flows are available to service all the obligations of the emerging entity. A stream of cash flows is developed using the DCF method in order to determine the reorganization value. Thus, in practice, establishing the appropriate stream of cash flows for the cash flow test is often a straightforward matter of using these projected cash flows in the new model.
Once the fundamental cash flow projections are incorporated, analysts then model the negotiated or litigated terms attributable to the creditors of the emerging entity. This involves projecting interest and principal payments to the creditors, including any amounts due to providers of short term, working capital facilities. These are the payments for each period that the cash flow generated up to that point must be able to cover in order for the company to avoid another bankruptcy.
The cash flows of the company will not be used only to pay debts, and so the third and final step in the cash flow test is documenting the impact of the net cash flows on the entire balance sheet of the emerging entity. This entails modeling changes in the company’s asset base as portions of the expected cash flows are invested in working capital and capital equipment; and modeling changes in the debt obligations of and equity interests in the company as the remaining cash flows are disbursed to the capital providers.
A reorganization plan is generally considered viable if such a detailed cash-flow model indicates solvent operations for the foreseeable future. The answer, however, is typically not so simple as assessing a single cash flow forecast.
It is a rare occurrence when management’s base case forecast does not pass the cash flow test. The underpinnings of the entire reorganization plan are based on this forecast, so it is almost certain that the cash flow projections have been produced with an eye toward meeting this requirement.
Viability is proven not only by passing the cash flow test on a base case scenario but also maintaining financial viability under some set of reasonable projections in which the company (or industry, or general economy) underperforms the base level of expectations. This “stress-testing” of the company’s financial projection is a critical component of a meaningful cash flow test.
“Fresh Start” Accounting”
Companies emerging from Chapter 11 bankruptcy are required to re-state their balance sheets to conform to the reorganization value and plan.
- On the left side of the balance sheet, emerging companies need to allocate the reorganization value to the various tangible and identifiable intangible assets the post-bankruptcy company owns. To the extent the reorganization value exceeds the sum of the fair value of individual identifiable assets, the balance is recorded as goodwill.
- On the right side of the balance sheet, the claims of creditors are re-stated to conform to the terms of the reorganization plan.
Implementing “fresh start” accounting requires valuation expertise to develop reasonably accurate fair value measurements.
Conclusion
Although the Chapter 11 process can seem burdensome, a rigorous assessment of cash flows and a company’s capital structure can help the company as it develops a plan for years of future success.
We hope that this explanation of the key valuation-related steps of a Chapter 11 restructuring helps managers realize this potential. However, we also understand that executives going through a Chapter 11 restructuring process need to juggle an extraordinary set of additional responsibilities—evaluating alternate strategies, implementing new and difficult business plans, and negotiating with various stakeholders.
Given executives’ multitude of other responsibilities, they often decide that it is best to seek help from outside, third party specialists.
Valuation specialists can relieve some of the burden from executives by developing the valuation and financial analysis necessary to satisfy the requirements for a reorganization plan to be confirmed by a bankruptcy court
Valuation specialists can relieve some of the burden from executives by developing the valuation and financial analysis necessary to satisfy the requirements for a reorganization plan to be confirmed by a bankruptcy court. Specialists can also provide useful advice and perspective during the negotiation of the reorganization plan to help the company emerge with the best chance of success.
With years of experience advising companies on valuation related issues, Mercer Capital’s professionals are well positioned to help in both of these roles. For a confidential conversation about your company’s current financial position and how we might assist in your bankruptcy related analyses, please contact a Mercer Capital professional.
1Accounting Standards Codification Topic 852, Reorganizations (“ASC 852”). ASC 852-05-8.
2ASC 852-10-20.

