The following guest post is authored by Jay Wilson, Vice President at Mercer Capital. Jay’s practice includes valuation services for banks and financial technology companies. Follow him on Twitter @MercerFinTech.
Although successful bank acquisitions largely hinge on deal execution and realizing expense synergies, properly assessing and pricing credit represents a primary deal risk. Additionally, the acquirer’s pro forma capital ratios are always important, but even more so in a heightened bank regulatory environment and merger approval process. Against this backdrop, merger-related accounting issues for bank acquirers have become increasingly important in recent years and the most significant fair value mark typically relates to the determination of the fair value of the loan portfolio.
Fair value is guided by ASC 820 and defines value as the price received/paid by market participants in orderly transactions. It is a process that involves a number of assumptions about market conditions, loan portfolio segment cash flows inclusive of assumptions related to expected credit losses, appropriate discount rates, and the like. To properly evaluate a target’s loan portfolio, the portfolio should be evaluated on its own merits, but markets do provide perspective on where the cycle is and how this compares to historical levels.
We reviewed estimated fair value marks (i.e., estimated loan portfolio fair value/ most recent historical gross loan portfolio balance) for recently announced community bank deals to determine if any trends emerged. As detailed below, the fair value mark (i.e., the discount to the reported gross loan balance) in recent deals appears to increase as the level of problem assets increases. However, the range remains quite wide and rarely hits the trendline, which could partially reflect the unique nature of isolated community bank loan portfolios. Overall, the median mark observed was 3.30% while the median level of adjusted non-performing loans (as a percentage of loans) was 2.22%.
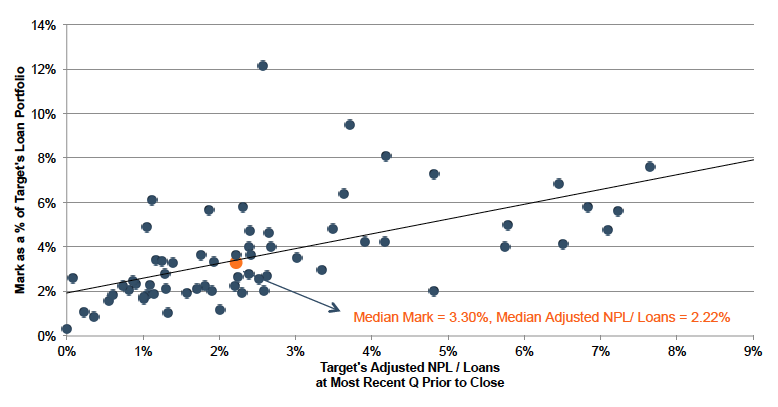
Sources: Mercer Capital research, company SEC filings, company investor presentations
The estimated fair value marks shown in the prior table were generally below those reported in deals during (2008-2010) and immediately after the financial crisis (2010-2012). This trend reflects a number of factors including:
- Stable to improving macro-economic trends. While contracting during the financial crisis, real GDP growth was relatively stable in 2013 and 2014 at approximately 2.20%. Real disposable income also increased 1.70% in 2014 after remaining relatively flat in 2013. Additionally, employment considerations have continued to improve in recent periods with the unemployment rate down to 5.7% in January of 2015 compared to 7.9% and 6.6% in January of 2013 and 2014, respectively.
- Higher real estate collateral values. While the 20-city S&P/Case-Shiller Home Price Index remains about 15% below its peak in mid-2006, it has increased about 25% since year-end 2011. Additionally, economic data from the Federal Reserve of St. Louis indicated that commercial real estate prices have been increasing year-over-year since year-end 2010 and were up 7.3% over the 12 months ended September 30, 2014.
- Reduced levels of noncurrent loans. As detailed below, credit migration continued to be positive and levels have declined to almost pre-financial crisis levels (third quarter 2014 levels approximated early 2008 levels).
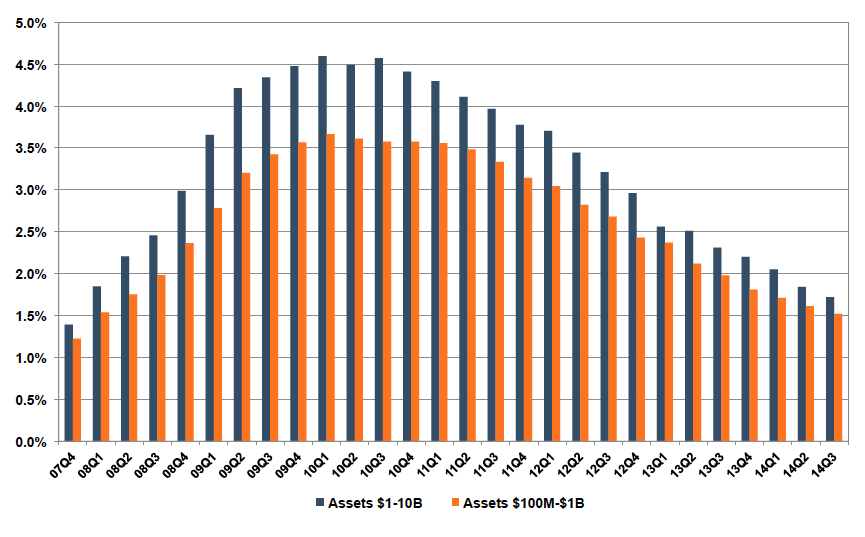
Source: FDIC
- Reduced Credit Spreads. Credit spreads provide perspective on a number of factors, including where the credit cycle has been and where it is headed, as well as potential portfolio issues at a target when there are no apparent issues. While credit spreads did increase in mid-2014, they have generally declined since the financial crisis as economic conditions as well as investor sentiment have improved. For example, BB credit spreads have declined from 5.0% in January of 2012 to 3.5% in January of 2015. All else equal, reduced credit spreads serve to lower the discount rate applied to the expected cash flows for a target’s loan portfolio, thereby increasing the fair value of the loan portfolio.
Mercer Capital has provided a number of valuations for potential acquirers to assist with ascertaining the fair value of acquired loan portfolio. In addition to loan portfolio valuation services, we also provide acquirers with valuations of other financial assets and liabilities acquired in a bank transaction, including depositor intangible assets, time deposits, and trust preferred securities. Feel free to give us a call or email to discuss any valuation issues in confidence as you plan for a potential acquisition.
Related Links
- Getting It Right: Loan Valuation and Credit Marks in Today’s M&A Market
- Bank Valuation: Financial Issues, Valuation Implications
Mercer Capital’s Financial Reporting Blog
Mercer Capital monitors the latest financial reporting news relevant to CFOs and financial managers. The Financial Reporting Blog is updated weekly. Follow us on Twitter at @MercerFairValue.