
Key Takeaways
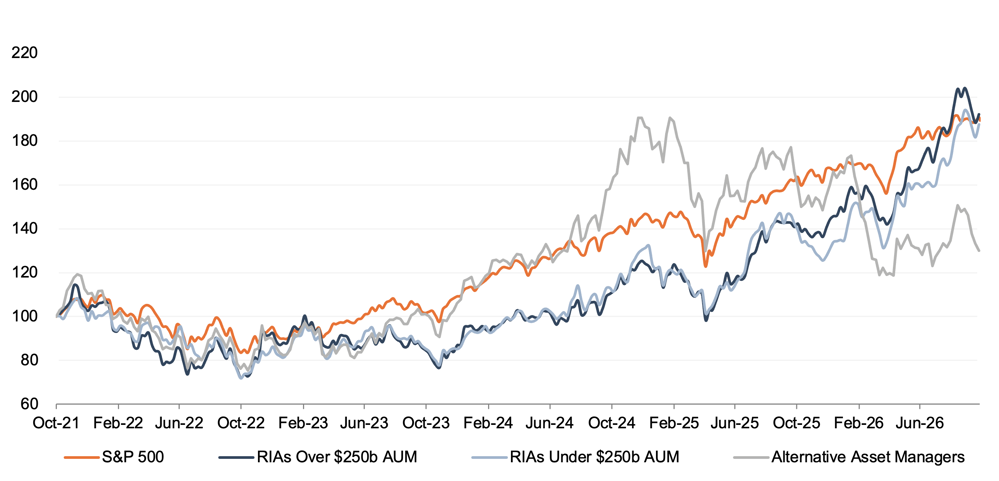
Publicly traded alternative asset managers gained 1.4% in the third quarter of 2026 but declined 17.9% over the trailing twelve months, significantly underperforming both the S&P 500 and traditional asset managers.
Valuation multiples for alternative asset managers have compressed substantially, with median EV/EBITDA declining from 16.4x to 10.7x year over year, despite double-digit growth in AUM and revenue and more modest EBITDA growth.
Divergent performance across alternative asset managers underscores the importance of evaluating firm-specific fundamentals, including recurring revenue, operating margins, client retention, and earnings sustainability, rather than relying solely on public-market valuation trends when assessing privately held RIAs.
Alternative Asset Managers Face a Reset in Public Market Valuations
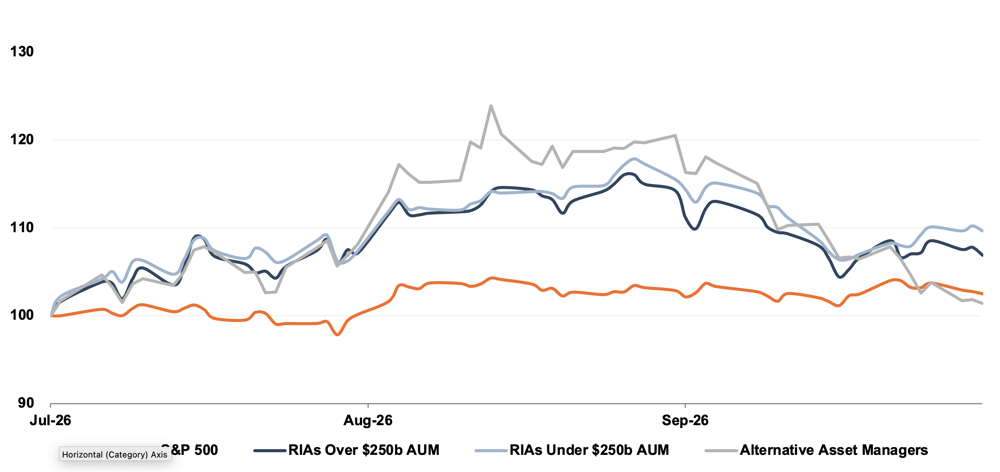
Alternative asset managers ended the third quarter slightly above their June 30 level, despite a sharp pullback from a late-summer high. For the quarter ended September 30, the group increased 1.4%, compared with 2.5% for the S&P 500, 6.9% for larger traditional managers, and 9.7% for smaller traditional managers.
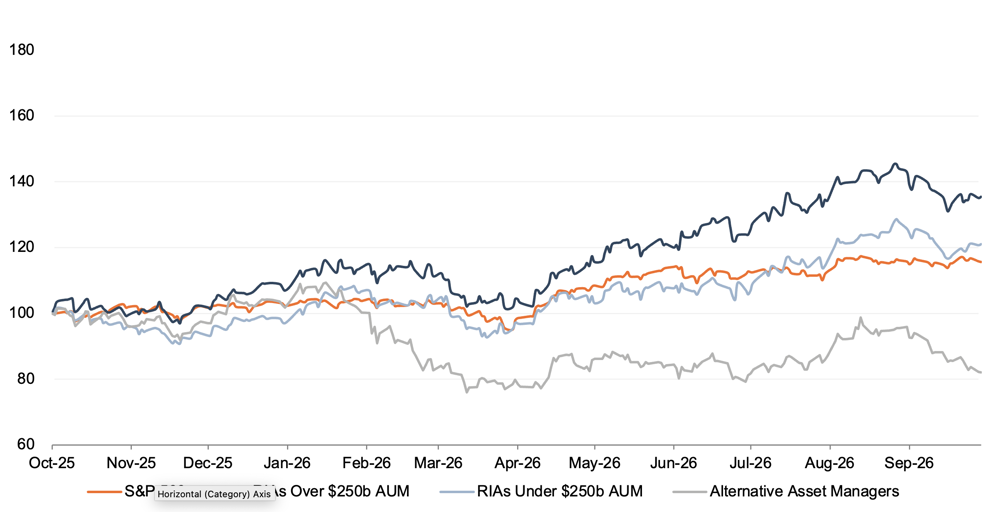
The trailing twelve-month comparison is more pronounced. Alternative asset managers declined 17.9% from September 30, 2025 through September 30, 2026, while the S&P 500 gained 15.6%. Larger and smaller traditional manager groups rose 35.5% and 21.1%, respectively. The modest Q3 gain did little to reverse the group’s substantial trailing-year underperformance. These figures are price returns for the market-update peer groups.
Valuation Multiples Have Reset
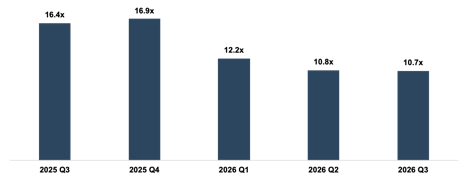
The group’s median enterprise value to LTM EBITDA multiple fell to 10.7x at September 30, 2026, from 16.4x a year earlier. The multiple was broadly stable in the third quarter, moving from 10.8x at June 30 to 10.7x at September 30. At the latest date, the alternative manager median was close to the 10.1x median for larger traditional managers and below the 16.4x median for smaller traditional managers.
Median LTM EV/EBITDA for Alternative Asset Managers
This repricing occurred alongside growth in the group’s operating measures. Year over year, alternative managers’ AUM increased 13.4% and revenue increased 14.6%, while EBITDA increased 2.9%. By comparison, larger traditional managers reported growth of 14.7% in AUM, 11.8% in revenue, and 13.1% in EBITDA. Smaller managers recorded AUM growth of 2.6% and revenue growth of 6.3%, while EBITDA declined 14.1%. The gap between alternative managers’ topline growth and EBITDA growth points to more limited earnings conversion during the period. The market update attributes the modest EBITDA increase in part to rising operating expenses; mix, compensation, and performance-related revenue can also affect individual firms differently.
The broader private equity environment provides additional context for these operating trends. Through the first three quarters of 2026, U.S. private equity capital invested increased about 18% year over year, while deal count declined about 13%. Disclosed exit value rose about 19%, but the number of exits fell about 34%. This pattern is consistent with capital and realizations being concentrated in fewer, larger transactions. The counts for the most recent quarter are preliminary and may increase as completed deals are added. These figures describe private equity activity and should not be read as a measure of every alternative asset manager. For context, see CohnReznick’s Q3 2026 private equity market outlook, based on PitchBook data.
Performance Varies Across Strategies and Managers
Alternative asset managers have different sources of revenue and exposure to market conditions. Management fees may provide a recurring base, while fundraising, asset values, realizations, and performance fees can affect results over time. The length of a fund’s investment period does not insulate its manager from slower fundraising or delayed exits, and the effect of those conditions depends on the firm’s strategy and fee mix.
Recent manager-level data also argues against treating the sector as a single business. KBRA described AUM and fee-paying AUM trends as generally constructive for its rated managers in the second quarter of 2026, but noted meaningful dispersion in fundraising, deployment, and investment performance. It also reported stronger fundraising in some infrastructure strategies and elevated redemption activity in certain evergreen and private-credit products. The review is a useful reminder that sector-wide share-price and multiple data can obscure very different company-level results. See KBRA’s September 2026 review of asset-manager results for the second quarter for additional detail.
Implications for Your RIA
Public alternative asset managers provide a useful read on investor sentiment, but their valuation multiples are not direct benchmarks for privately held wealth-management RIAs. Their strategies, revenue mix, balance-sheet exposures, and reliance on realizations can differ substantially from those of a traditional wealth manager.
The Q3 data suggest that public investors may be weighing EBITDA growth alongside AUM and revenue growth. For a privately held RIA, the relevant questions remain firm-specific: how much revenue is recurring, whether the firm is retaining and growing clients, how margins are changing, and how dependent results are on a small number of owners or relationships. Alternative manager share performance is context for the market, not a substitute for assessing those underlying economics.