We regularly encounter business owners contemplating the dilemma of ownership transition. After years (maybe even decades) of cultivating the business through hard work, determination, and perhaps a bit of luck, many prospective sellers believe now is a sensible time to exit.
Tax changes are looming, pandemic and post-pandemic winners see solutions to a myriad of operational challenges, and valuations remain favorable in most industries. However, a seller’s timing, the readiness of the business, and the readiness of the marketplace may not be aligned without careful seller preparation and real-time market awareness.
Little do most sellers realize that their preparation, their tolerance for post-deal involvement, their health and ability to remain active, and their needs for liquidity will influence the breadth and priorities of their options and will influence who the potential buyers might be and how they might target the business. Proactivity (or backfilling for the lack thereof) will also influence the design and costs of the process for effective M&A representation.
Under ideal circumstances, the planning process for an exit will begin well before the need for an actual ownership transfer arises. One of the first steps in planning for an eventual sale is to understand who the potential buyers might be and the different characteristics of these buyers.
In this article, we discuss some exit options and summarize some of the specifics of certain types of buyers and what that could mean for transaction structure and economic outcomes.
When done carefully, an internal transition can be desirable in order to protect both the existing employees and the culture of the business. Potential buyers in an internal transition generally include the next generation of the owner’s family or key employees of the company (or a mix thereof).
These transactions generally occur one of two ways: through a direct sale from the exiting owner to the next generation or through the establishment of an Employee Stock Ownership Plan (ESOP).
While these transactions may not yield the pricing or turnkey liquidity that selling to an outside buyer might, they can provide comfort to exiting owners regarding their legacy and the continuing prospects of the business as an independent going concern.
A key consideration in selling to family members or to employees is price. Equally important is the question of how the transaction is financed.
Internal transactions are often achieved by share redemptions in installments and/or through a leveraged buyout process. Often, the seller will provide financing using one of many potential structures.
Seller financing carries the risk of the buyer’s inability to pay, which often requires the seller to reinsert into active leadership. Many may view seller financing as acceptable, if not necessary or desirable, in order to control the terms and costs of the arrangements and to benefit from the interest payments and other terms of the financing.
As noted, a seller’s liquidity requirements and the underlying fundamental borrowing capacity of the business play a big part in determining how much third party capital can be employed. Many sellers want their buyers, family or otherwise, to have real skin in the game by way of at least partial external financing.
If the next generation of family members and/or employees are not well-situated to achieve a buyout as a concentrated ownership group, then the feasibility of a more formal collective buyer group may be a good alternative. Following is a brief overview of Employee Stock Ownership Plans, which can serve as an alternative to a concentrated internal transition.
ESOPs are a proven vehicle of ownership transfer. They can provide for either an incremental or a turnkey ownership transfer. They also facilitate the opportunity for legacy owners to continue contributing to the stability and success of the business while allowing employees to reap the rewards and benefits of capital ownership.
Assessing the feasibility of an ESOP requires the advisory support of experienced financial and legal professionals who help ensure that best practices are implemented and that compliance awareness governs the transaction. To that end, owners contemplating an ESOP need to be keenly aware of the importance of following a well-designed process that satisfies the requirements of the Department of Labor and adheres to governing rules and regulations.
As a qualified retirement plan subject to regulations set forth by ERISA (Employee Retirement Income Security Act), ESOPs are regulated using strict guidelines for process, fairness, and administration. Accordingly, the entire life cycle of a contemplated ESOP needs to be studied in a process generally referred to as an ESOP Feasibility Study. Valuation, financing, plan design, plan administration, future repurchase obligations, and many other concerns must be assessed before venturing down the ESOP path.
In function, the establishment of an ESOP includes the creation of an ESOP trust, which, using one of many possible transaction structures, becomes the ultimate owner of some or all of the stock of the sponsoring ESOP company. ESOPs are unique in being the only qualified retirement plans allowed to use debt to purchase the shares of the employer corporation.
Once an ESOP is in place, the qualifying employee participants are allocated interests in the trust annually according to the Plan’s design. As employees cycle through their employment tenure, they trigger milestone events that allow for the effective sale of their accumulated ownership positions, providing a nest egg for retirement.
During their tenure of employment, the employee’s account is mostly concentrated in company stock, the valuation of which determines the amount they receive when nearing and eventually reaching retirement age. The stock accumulated during active employment is converted to cash and the plan shares are either redeemed or recycled to perpetuate the ESOP.
There are certain tax-related and transaction design features in an ESOP transaction that can benefit sellers in numerous different ways. Sellers in ESOP installations must understand the necessary complexities and nuances of a well-run ESOP transaction. Sellers lacking the patience and gumption for an ESOP process or those who require turnkey liquidity in their ownership exit should likely consider an alternative liquidity strategy.
In general, the ability to sell your business to an external party yields the highest proceeds. If you have succeeded in creating a sustainable business model with favorable prospects for growth, your business assets may generate interest from both strategic and financial buyers.
A strategic buyer is usually a complementary or competitive industry player within your markets or looking to enter your markets.
Strategic buyers can be generally characterized as either vertical or horizontal in nature. Such buyers are interested in the natural economies of scale that result from an expanded market area (cost and operational leverage in our terminology) and/or from specific synergies that create the opportunity for market and financial accretion (think 1 + 1 = 3).
There is a good chance that a potential strategic buyer for your business is someone or some group you already know. Such buyers don’t require the full ground-up familiarization process because they are already in tune with the risk and growth profiles of the business model. Accordingly, owners interested in a turnkey, walk-away sale of their business are often compelled toward a strategic buyer since strategic buyers can quickly integrate the seller’s business into their own.
The moving parts of transaction consideration paid by strategic buyers can cover a broad spectrum. We see simple, nearly 100% cash deals, as well as deals that include various forms of contingent consideration and employment/non-compete agreements.
Most sellers in strategic deals are not inclined to work for their buyers other than in a purely consultative role that helps deliver the full tangible and intangible value the buyer is paying for. In many cases, strategic buyers want a clean and relatively abrupt break from prior ownership in order to hasten the integration processes and cultural shift that come with a change in control.
Additionally and/or alternatively, strategic deals may include highly tailored earn-outs that are designed with hurdles based on industry-specific metrics. In general, earn-outs are often designed to close gaps in the bid/ask spread that occur in the negotiation process. These features allow sellers more consideration if post-transaction performance meets or beats the defined hurdles and vice versa. Sellers must be aware of the sophisticated means by which larger strategic buyers can creatively engineer the outcomes of contingent consideration.
In certain industries strategic buyers may structure consideration as part cash and part or all stock. Sellers in the financial sector are often selling equity ownership as opposed to the asset sales that dominate most non-financial sectors. In such deals, sellers who take equity in the merged entity must be cognizant of their own valuation and that of the buyer. The science of the exchange rate and the post-closing true-ups that may apply are areas in which sellers should seek skilled professional advisory guidance.
Financial buyers are primarily interested in the returns achieved from their investment activities. These returns are achieved by the conventions of 1) traditional opportunistic investment and 2) by means of sophisticated front-end and back-end financial engineering with respect to the original financing and the subsequent re-financings that often occur.
Most traditional buy-out financial investors are looking to satisfy the specific investment criteria of their underlying fund investors, who have signed on for a targeted duration of investment that, by nature, requires the financial investor to achieve a secondary exit of the business within three to seven years after the original acquisition (the house flipping analogy is a clear but oversimplified one). Financial investors may have significant expertise acquiring companies in certain industries or may act as generalists willing to acquire different types of businesses across different industries.
In general, there are three types of financial buyers:
Despite their financial expertise, financial buyers usually do not have the capacity or knowledge to assume the management of the day-to-day operations of all of their business investments. As such, the seller’s management team at the time of a sale will likely remain involved with the Company for the foreseeable future. A sale to a financial investor can be a viable solution for ownership groups in which one owner wants to cash out and completely exit the business while other owners remain involved (rollover) with the business.
With respect to work force and employee stability, financial investors will ultimately seek maximum efficiency, but they often begin the process by making sure they secure the services of both frontline and managerial employees. In many cases, the desired growth of such investors can bolster the employment security of good employees while screening out those that resist change and impede progress.
The value of the assembled workforce is becoming a more meaningful asset to prospective buyers in the marketplace, whether they be strategic or financial in nature. Further, larger acquirers often can present employees with a more comprehensive benefit package and enhanced upward mobility in job responsibility and compensation. All this said, financial investors will ultimately seek to optimize their returns with relentless efficiency.
Lastly, as the financial buyer universe has matured over the past 20+ years, we have witnessed directly that many strategic consolidators are platform businesses with private equity sponsorship, which blurs or even eliminates the notion of a strictly strategic or financial buyer in many industries.
An outside buyer might approach you with an offer that you were not expecting, you and your partners might decide to put the business on the market and seek offers, or you and your partners might opt for an internal sale. Whatever the case may be, most owners only get to sell their business once, so you need to be sure you have experienced, trustworthy advisors in your corner.
Mercer Capital provides transaction advisory services to a broad range of public and private companies and financial institutions. We have worked on hundreds of consummated and potential transactions since Mercer Capital was founded in 1982. We have significant experience advising shareholders, boards of directors, management, and other fiduciaries of middle-market public and private companies in a wide range of industries.
Rather than pushing solely for the execution of any transaction, Mercer Capital positions itself as an advisor to inform sellers about their options and to encourage market-based decision making that aligns with the personal priorities of each client.
Our independent advice withstands scrutiny from shareholders, bondholders, the SEC, IRS, and other interested parties to a transaction. Our dedicated and responsive team stands ready to help you manage the transaction process.
A truck driver’s lifestyle is typically portrayed as being lackluster due to exhausting work hours and countless days away from home. As a result of the work environment for a driver, prospects debating entering the labor force in this career field ponder whether driving would be an enjoyable lifestyle. Due to the notion that the younger generation typically finds a career path in trucking unappealing, the demographics of this industry lean towards older males with 27% of truck drivers being over the age of 55 and the median age being 46.
Once the COVID-19 pandemic hit the United States in 2020, the demand for truck drivers increased sharply as many consumers turned towards online shopping. Even though trucking services were in high demand, the trucking industry struggled to grow its workforce during this time period.
Many eligible drivers elected to enter early retirement rather than waiting to return to work at the conclusion of the pandemic. Additionally, many prospects in the job market feel that they can achieve better working conditions and benefits along with similar wages working somewhere besides the transportation industry. Driver turnover is another factor that contributes to the abundance of available positions. Historically, truck drivers have a yearly turnover rate of 87%. During the 4th quarter of 2020, truck driver turnover reached 92%. High turnover rates coupled with mediocre working conditions have directly contributed to the current driver shortage that the United States is facing today. We last looked at this driver shortage in December 2018 – the situation has not changed and driver hiring and retention remains a concern for many trucking companies.
Logistics companies have been forced to raise wages for their current drivers. Many have seen wage increases of up to 50% since 2018 due to lack of available drivers throughout the U.S. Leah Shaver, CEO of the National Transportation Institute told Transport Topics that the ongoing duration of driver shortage is leaving companies with no choice but to raise pay. “For the last few weeks, it seems every couple of hours, some fleet is increasing pay,” she said. “The fleets are telling us because capacity is so tight, they could do four times the amount of work, if only they had enough drivers.” It harkens back to basic supply and demand – increasing wages for truck drivers is an approach that many transportation companies have instituted in order to fill vacant driver positions.
Hiking wages for drivers has had a serious economic impact on the economy. Elevated wages for drivers have forced retailers to increase their prices. Retailers reason that they must raise their prices as a result of the increased shipping costs so that they can maintain their current profit margins. As a result, the consumer price index has been steadily on the rise every month in 2021. The CPI surged 4.2% in April, 2021, causing it to reach a 13 year high surpassing pre-Recession levels. For the 12 months ending March 31, 2021, the CPI increased 2.6% overall, with food prices seeing a rise of 3.5% and energy prices skyrocketing 13.2%.
This is a three-part series where we focus on key areas to assist family lawyers and divorcing parties.
Form 1040 is used by taxpayers to file an annual income tax return. It calculates the total taxable income of the taxpayer(s) and determines the amount that should be paid or refunded. There are five filing statuses – single, married filing jointly, married filing separately, head of household, and qualified widow(er) with dependent children.
Form 1040 provides a general understanding of a taxpayer’s financial status and can be a guide to finding additional information about one’s finances. It can serve as a starting point to get a picture of an individual’s (or couple’s) income(s), assets and liabilities, and lifestyle. Form 1040 is supplemented with additional schedules and documentation which lend detail and insight into one’s lifestyle and financial matters. Ultimately, for divorce purposes, multiple years of tax returns should be reviewed and can be a source of inputs for the marital estate subject to division, as well as data for further financial analyses like income determination and lifestyle analysis/pay and need analysis.
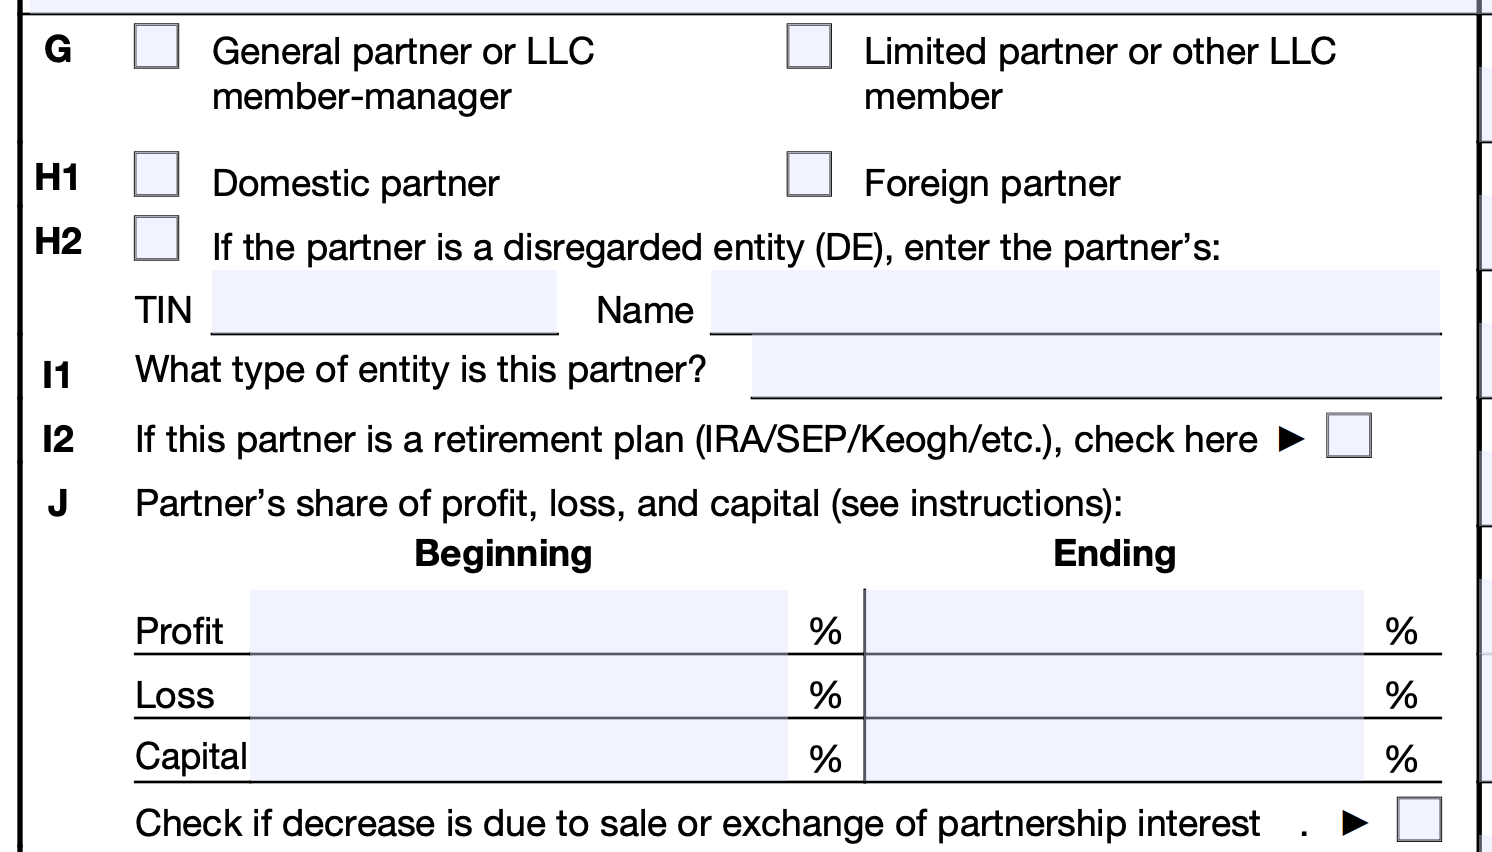
Below is a snapshot from Form 1040:
Line 1: Wages, Salaries, and Tips – Line 1 details wages, salaries, and tips. This amount should match the income reported in Box 1 of the Form W-2. The amount on Line 1 is not gross income. It is likely that there are pre-tax deductions, such as contributions to a 401(k) account. You should refer to the underlying W-2(s) for more information about these deductions as well as gross income.
Line 2 & Line 3: Interest and Dividends – An entry in Line 2 indicates interest income, while an entry in Line 3 indicates dividend income. Both point to ownership of assets and documentation of these assets should be requested. Furthermore, income earned from interest and dividends can be considered as a source of income when calculating spousal and child support. Details about interest and dividend income can be found on Schedule B, Form 1099-INT, and Form 1099-DIV
Line 4: IRA Distributions – An entry in Line 4 shows distribution from an individual retirement account, signaling that the taxpayer has an IRA account and documentation of these assets should be requested. A withdrawal from a retirement account may also point to possible dissipation of marital assets, if not readily identifiable or available by account documentation. Details about retirement distributions are on Form 1099-R.
Line 5: Pensions and Annuities – An entry in Line 5 indicates existence of pensions and annuities, which may be wholly or partially marital property. These must be carefully considered for property division as well as sources of income when calculating spousal and child support.
Line 6: Social Security Benefits – Like pensions, Social Security benefits should be considered as sources of income when calculating spousal and child support. Details can be found on Form SSA-1099, which is a form provided to the taxpayer who receives these benefits. Estimates of an individual’s future monthly payments can be extracted from the Social Security Administration website.
Line 7: Capital Gains or Losses – Line 7 indicates capital gains or losses, which means that an asset (or multiple assets) was sold and some sort of monies were made or lost on the transaction. Not only does this information indicate ownership of assets, it can also be important in tracing analyses as well as other forensic analyses when reviewing several years of tax returns. Details can be found in Schedule D and Form 8949.
Line 8: Other Income – An entry in Line 8 should be reviewed further as it often indicates income from gambling winnings or other unusual sources (for example, prizes, jury duty pay, or the taxable portion of disaster relief payments). Information about the sources of other income can be found in Form 1099-MISC (miscellaneous income) or Form W-2G (which is a form that records gambling winnings). However, these incomes are typically not recurring in nature, and are not always reported which may require scrutiny and potential forensic analyses.
Line 9: Total Income –This line is the summation of above lines and yields total income of the taxpayer and can give you information about how the taxpayer earns their income. This number may be used when determining spousal or child support as it does not include any adjustments.
Line 11: Adjusted Gross Income – Adjusted Gross Income (AGI) is the amount used to determine one’s taxable income. The AGI is total income less adjustments. A few common adjustments are deductions for educator expenses, health savings account deductions, and student loan interest deductions. Many of these adjustments are optional, and excessive use could potentially be used to skew spousal or child support amounts. Therefore, gross income (line 9) is often considered over AGI when determining spousal or child support amounts. More information on the adjustments claimed can be found on Schedule 1.
Line 13: Qualified Business Income (QBI) Deduction – If the taxpayer is taking this deduction, it indicates that they own a business, which should lead to requests for related business documents. The QBI deduction is for pass-through businesses, therefore, a Schedule C or Schedule K-1 should also be included with the tax return. Examples of pass-through businesses are sole proprietorships, LLCs, partnerships, and S-Corporations.
Line 37: Amount You Owe Now – Line 37 indicates the incremental amount owed based on the total tax liability less any federal tax withholding, estimated payments, and credits. Reviewing the amount owed or amount to be refunded over several years can potentially uncover intentional over or under payment. However, business owners or self-employed individuals who pay quarterly taxes may have fluctuating incomes from year to year. It is important to understand that quarterly tax payment estimates are based on prior year realized income levels, which may or may not be the reason for over or under payment. A financial expert can accurately assess these types of scenarios.
Knowing how to navigate key areas of Form 1040 can be quite useful in divorce proceedings. Information within the tax return can provide support for marital assets and liabilities, determination of spousal and child support, and potential further analyses. Reviewing multiple years of tax returns is typical as multi-year overviews may reveal trends, provide helpful information, and may even indicate the need for potential forensic investigations.
While we do not provide tax advice, Mercer Capital is a national business valuation and financial advisory firm and we provide expertise in the areas of financial, valuation, and forensic services.
It is imperative for estate planners to engage valuation analysts that perform the proper procedures and follow best practices when performing valuations for gift and estate planning purposes. It is necessary to have a well-supported valuation because these reports are scrutinized by the IRS and may end up going to court. The recent decision by the U.S. Tax Court in Estate of Michael J. Jackson v. Commissioner provides several lessons and reminders for valuation analysts, and those that engage valuation analysts, to keep in mind when performing valuations for gift and estate planning purposes.
Michael Jackson, the “King of Pop,” passed away on June 25, 2009. His Estate (the “Estate”) filed its 2009 Form 706, United States Estate (and Generation-Skipping Transfer) Tax Return, listing the value of Jackson’s assets. After auditing the Estate’s tax return, the Commissioner of the Internal Revenue Service (the “Commissioner”) issued a notice of deficiency that concluded that the Estate had underpaid Jackson’s estate tax by a little more than $500 million. Because the valuation of some assets were considered to be so far off, the Commissioner also levied penalties totaling nearly $200 million on the Estate. The IRS and the Estate settled the values of several assets outside of court. The case involved three contested assets of Michael Jackson’s estate:
We discuss the key topics that the Tax Court ruled on and addressed that inform valuation analysts in the preparation of quality valuation reports.
It is important that valuation analysts only rely on information that was known or knowable at the valuation date.
In the decision, the Tax Court rejects the analysis of experts on several occasions for using information that was “unforeseeable at the time of Jackson’s death.” The Tax Court goes on to state that “foreseeability can’t be subject to hindsight.”
It can be difficult to distinguish and depend on only the information known or knowable at the valuation date especially when a significant amount of time has passed between the current date and the valuation date. Therefore, a careful examination of all sources of information is necessary to be sure that it can be relied upon in the analysis.
As can be seen from the Tax Court’s opinion, valuation analysts and experts can undermine their credibility by relying on information that was not known or knowable at the valuation date.
The Tax Court, in this specific case, did not accept the tax affecting of S Corporations: “The Estate’s own experts used inconsistent tax rates. They failed to explain persuasively the assumption that a C corporation would be the buyer of the assets at issue. They failed to persuasively explain why many of the new pass-through entities that have arisen recently wouldn’t be suitable purchasers. And they were met with expert testimony from the Commissioner’s side that was, at least on this very particular point, persuasive in light of our precedent. This all leads us to find that tax affecting is inappropriate on the specific facts of this case.” The Tax Court did, however, leave room for the possibility of tax affecting being appropriate by stating, “we do not hold that tax affecting is never called for.”
At Mercer Capital, we tax affect the earnings of S corporations and other pass-through entities. Given that this issue continues to be a point of contention, it is imperative that valuation analysts provide a thorough analysis and clear explanation for why tax affecting is appropriate for S corporations and other tax pass-through entities.
In the valuation of NHT II, the Court found it more reasonable to use the projections of Sony/ATV in the development of a forecast used in the income approach rather than relying on historical financial performance to inform the projection. The Tax Court based its decision on the fact that “the music-publishing industry was (and has remained) in a state of considerable uncertainty created by a long series of seismic technological changes. We think that projections of future cashflow, if made by businessmen with an incentive to get it right, are more likely to reflect reasonable estimates of the short-to-medium-term effects of these wild changes in the industry that even experts, much less judges, are unlikely to intuit correctly.”
This decision makes it clear that valuation analysts need to fully understand the industry in which the company operates and develop a forecast that is most reasonable given the information available as of the valuation date.
In cases where analysts have access to a projection developed by management, valuation analysts should have a clear, well-reasoned rationale for not relying on the forecast should they decide not to use it in the analysis. However, valuation analysts should not blindly accept management’s forecasts as truth but should perform proper due diligence to assess the reasonability of the forecast and clearly articulate any deviations from management’s forecast.
A few other topics of note are addressed throughout the decision that can help valuation analysts provide reliable valuation analyses.
On more than one occasion, the Tax Court sided with the expert that provided a compelling explanation for the use of a certain assumption rather than arbitrarily using an assumption without explanation. The Tax Court also sided with one expert simply because they provided a clear citation for their source when another expert did not. The Tax Court also called out the inconsistency of an expert in their report and testimony. These topics addressed by the Tax Court demonstrate that consistently explaining and citing the sources of assumptions and key elements of the valuation analysis help to produce a supportable valuation
analysis.
Finally, the expert for the Commissioner seriously damaged their credibility in the eyes of the Tax Court when the expert was caught in a couple lies during the trial. The Tax Court found that the expert “did undermine his own credibility in being so parsimonious with the truth about these things he didn’t even benefit from being untruthful about, as well as not answering questions directly throughout his testimony. This affects our fact finding throughout.”
The table below presents the valuation conclusions of the Estate, Commissioner, and the Tax Court at trial. This decision has shown that it is critical for valuation analysts to present quality valuation reports that are clear, supported, and follow accepted best practices.
At Mercer Capital, estate planners can be confident that we follow the proper procedures, standards, and best practices when performing our valuations for gift and estate planning. Mercer Capital has substantial experience providing valuations for gift and estate planning as well as expert witness testimony in support of our reports. Please do not hesitate to contact one of our professionals to discuss how Mercer Capital may be able to help your estate planning needs.
Recently, the Biden Administration announced elements of its tax agenda in the American Families Plan. The Biden Administration aims to make some significant changes to current tax law.
These changes are highlighted by the following:
Another substantial proposal includes the elimination of the step-up in basis. The potential elimination of the step-up in basis presents an estate planning opportunity to high-networth individuals and family business owners or should at least spur them to contemplate revisiting their estate plans.
The step-up in basis refers to the current tax environment that allows individuals to transfer appreciated assets at death to their heirs at the current market value without heirs having to pay capital gains taxes on the unrealized capital appreciation of those assets that occurred during the individual’s life. In other words, heirs currently benefit from a “step-up” in tax basis of inherited assets to the market value on the day of death, and no taxes are paid on unrealized capital appreciation of the assets.
The Biden Administration is proposing to eliminate this step-up in basis. This means that the heir would be responsible for the taxes on the unrealized capital appreciation of the assets being transferred as if the assets had been sold. This would result in a large tax burden on the heir especially when considering that the Biden Administration is also aiming to increase the top capital gains tax rate to 39.6%. Specifically, the proposal would end the step-up in basis for capital gains What Does the Step-Up in Basis Tax Proposal Mean for High Net Worth Individuals and Family Businesses? in excess of $1 million (or $2.5 million for couples when combined with existing real estate exemptions). So, the first $1 million of unrealized capital gains would be exempt from taxes and only the excess would be taxed. However, the proposal does state that “the reform will be designed with protections so that family-owned businesses and farms will not have to pay taxes when given to heirs who continue to run the business.” These protections and exemptions seem to provide some relief for family businesses, but the details of the protections have yet to be specified.
These proposals are certainly not set in stone and may change as the proposals are debated and legislature eventually makes its way through Congress. However, the Biden Administration’s current tax proposals could have a significant impact on the estate planning environment.
The potential elimination of the step-up in basis is yet another reason for high-net-worth individuals and family business owners to make estate plans or revisit their current estate planning techniques. When considered alongside other Biden Administration proposals such as an increase in the capital gains tax and the fact that the increased lifetime gift and estate tax exclusion limits are set to sunset in 2025, now is a great time to have a conversation about planning. Contact a professional at Mercer Capital to discuss your specific situation in confidence.
M&A activity in North America (and globally) is rebounding in 2021 after falling to less than $2.0 trillion of deal value in 2020 for just the second time since 2015 according to PitchBook; however, deal activity has accelerated in 2021 and is expected to easily top 2020 assuming no major market disruption due to a confluence of multiple factors.
The rally in equities, like low borrowing rates, has reduced the cost to finance acquisitions because the majority of stocks experienced multiple expansion rather than material growth in EPS. It is easier for a buyer to issue shares to finance an acquisition if the shares trade at rich valuation than issuing “cheap” shares.
As of June 3, 2021, the S&P 500’s P/E based upon trailing earnings (as reported) was 44.9x compared to the long-term average since 1871 of 16x. Obviously trailing earnings were depressed by the impact of COVID-19 on 2020 earnings, but forward multiples are elevated, too. Based upon consensus estimates for 12 months ended March 31, 2022, the S&P 500 is trading for 21x earnings.
High multiple stocks can be viewed as strong acquisition currencies for acquisitive companies because fewer shares have to be issued to achieve a targeted dollar value. As such, it is no surprise that the extended rally in equities has supported deal activity this year. However, high multiple stocks may represent an under-appreciated risk to sellers who receive the shares as consideration. Accepting the buyer’s stock raises a number of questions, most which fall into the genre of: what are the investment merits of the buyer’s shares? The answer may not be as obvious as it seems, even when the buyer’s shares are actively traded.
Our experience is that some if not most members of a board weighing an acquisition proposal do not have the background to thoroughly evaluate the buyer’s shares. Even when financial advisors are involved there still may not be a thorough vetting of the buyer’s shares because there is too much focus on “price” instead of, or in addition to, “value.”
A fairness opinion is more than a three or four page letter that opines as to the fairness from a financial point of a contemplated transaction; it should be backed by a robust analysis of all of the relevant factors considered in rendering the opinion, including an evaluation of the shares to be issued to the selling company’s shareholders. The intent is not to express an opinion about where the shares may trade in the future, but rather to evaluate the investment merits of the shares before and after a transaction is consummated.
Key questions to ask about the buyer’s shares include the following:
The list does not encompass every question that should be asked as part of the fairness analysis, but it does illustrate that a liquid market for a buyer’s shares does not necessarily answer questions about value, growth potential and risk profile. We at Mercer Capital have extensive experience in valuing and evaluating the shares (and debt) of financial and non-financial service companies garnered from over three decades of business.
In the December 2020 BankWatch, we provided our M&A outlook for 2021 and touched on themes that we believed would drive deal activity for the year. Our view was that the need to reduce costs in the face of revenue pressure would create urgency for banks to engage in M&A and lead to increased deal activity, given that credit quality remained stable and the economy avoided a double-dip recession.
Specifically, we noted that these drivers may cause mergers of equals (“MOEs”) to see more interest. Indeed, four of the largest bank deals in 2020 were structured as MOEs or quasi-MOEs (low premium transactions), and we believed the trend would only gain more traction as economic clarity emerged.
Thus far in 2021, against the backdrop of economic reopening, stable asset quality, and favorable bank stock performance, deal activity in the industry has picked up, and MOEs remain a hot topic. S&P Global Market Intelligence reported 53 U.S. bank deals year-to date through April 30, compared to 43 during the same period in 2020. The pace increased notably in April as 19 deals were announced in the month, including two large MOEs. BancorpSouth (BXS) announced a merger with Cadence (CADE) on April 12, and Webster (WBS) announced a deal with Sterling Bancorp (STL) one week later on April 19.
Bank MOEs are not a new concept, but they have occurred more frequently over the past several years, with the most notable being the BB&T – SunTrust combination to form Truist Financial (TFC). The BB&T-SunTrust combination has been reasonably well received, while it is perhaps early to judge some of the more recent deals. These types of transactions certainly have their merits and can appear strategically and financially compelling. However, MOEs involve a number of risks that should not be overlooked. For management teams considering an MOE, it is important to assess both the benefits and potential risks of such a deal.
Perhaps the most apparent benefit is the opportunity to reduce costs and improve operational efficiency. This is especially valuable in the current environment as revenue growth opportunities are limited. Reported estimates for cost savings in recent MOEs have been on the order of 10% to 15% of the combined expense base. These savings are often achieved by consolidating back office and administrative functions and/or right-sizing the branch network. With the increased adoption of digital banking, branch networks have become less central to banks’ business models and can be a drag on efficiency. MOEs provide management teams an opportunity to re-evaluate their banks’ physical distribution systems and reap the benefits of optimizing the branch network.
The savings from efficiencies and branch consolidation can be invested in upgrading the bank’s technological capabilities. Almost all recent merger press releases include some type of statement indicating management’s intent to invest in the pro forma bank’s digital capabilities. While the specifics of such investments are often not disclosed, it is clear that management teams view the ability to invest in technology as a key piece of the rationale for merging. By gaining scale, banks can dedicate the necessary resources to develop sophisticated financial technology solutions.
With a challenging loan growth outlook, many banks are considering entering new markets with favorable demographic characteristics. Unlike a de novo strategy or a series of small acquisitions, an MOE provides an opportunity to quickly establish a sizeable presence in a desired market. In merging with Cadence, BancorpSouth will in a single transaction more than double its deposit base in Texas where it previously had been acquiring smaller banks, with three sub-$500 million asset bank acquisitions since 2018. As banks look to position themselves for growth, MOEs are a potentially attractive option to gain meaningful exposure to new markets.
A merger offers opportunities to diversify the revenue stream by either gaining new lending expertise or entering a new fee income line of business. The more retail-focused First Citizens Bancshares will significantly diversify its lending profile when it completes its combination with the commercial-oriented CIT Group, announced in October of last year. Similarly, IberiaBank diversified its revenue stream by combining with First Horizon which has a sizeable fixed income operation. As revenue growth remains challenging, management teams should consider if a transaction might better position their bank for the current environment.
While an MOE can offer benefits on a larger scale, it also presents risks on a larger scale. The risks detailed below largely apply to all mergers and are amplified in the case of an MOE.
Culture is often the arbiter between success and failure for an MOE. Each of the subsequent risks detailed in this section could be considered a derivative of culture. If two banks with conflicting management philosophies combine, the result is predictable. The 1994 (admittedly before my time) combination of Society Corporation and KeyCorp was considered a struggle for several years as Society was a centralized, commercial-lending powerhouse while KeyCorp was a decentralized, retail-focused operation. Potential merger partners need to honestly assess cultural similarities and differences and evaluate the proposed post-merger management structure before moving forward.
It is also important that merging banks be on the same page regarding post-merger ambitions. If one views the merger as “fattening itself up” for a future acquirer while the other desires to remain independent, they will likely diverge in their approach to other strategic decisions. When executives or board members frequently clash, the pro forma entity will struggle.
There is usually some level of employee fallout with an acquisition, but if enough key employees leave or are poached by competitors, the bank’s post-merger performance will suffer. This is an especially important consideration when acquiring a bank in a new market or with a unique lending niche. If employees with strong ties to the communities in a new market leave for a competitor, it will be difficult to gain traction in that market. Likewise, a new lending specialty or business line can fail if those with the knowledge and experience to run it do not stick around for long.
Acquiring a bank of the same or similar size requires a tremendous amount of effort. Loan and deposit systems must be consolidated, customers from the acquired bank must be onboarded to the new bank’s platforms, and branding must be updated across the franchise. If the acquirer’s management team has little experience with acquisitions, successfully integrating with a large partner may prove difficult. When considering an MOE, the acquiring bank must assess what tasks will be necessary to combine the operations of the two organizations and achieve the projected cost savings. Management teams must consider whether their organization has the expertise to do that or, if not, what external resources would be needed.
Credit quality issues from an acquired loan portfolio can come back to bite a bank years after the acquisition. Merger partners need to be sure they have performed thorough due diligence on each bank’s loan portfolio and are comfortable with the risk profile. While recent credit quality concerns in the industry have not materialized and greater economic clarity has emerged, would-be acquirers need not be lulled to sleep by the current credit backdrop. The past year has shown that the future is unpredictable, and that forecasts are not always correct.
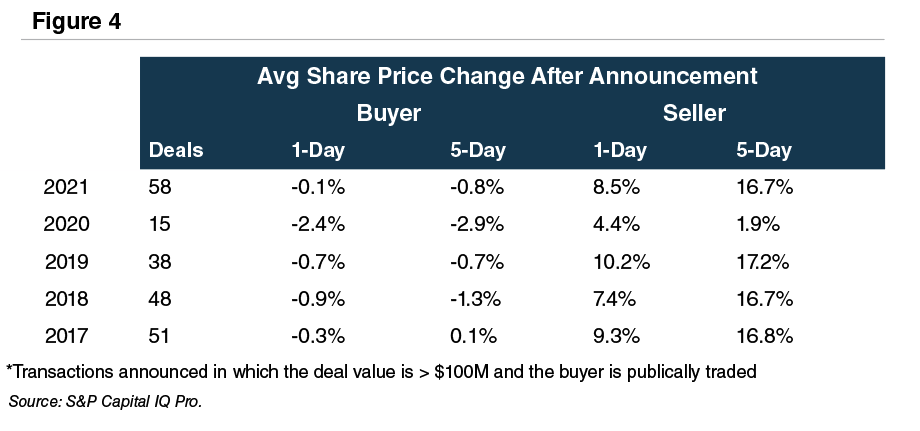
In recent MOEs and low premium transactions, acquirers’ shares have faced an adverse reaction from investors with declines of 5% to 7% in the days following announcement. First Citizens is an exception as its shares were up 34% five days after announcing its acquisition of CIT, which largely reflects the favorable price paid (44% of tangible book value). While it is not uncommon for buyers’ shares to decline following the announcement of an acquisition, these drops could reflect the market’s concerns around the heightened execution and integration risk of an MOE. It is early to judge whether the deals will create value in the long run or if the market’s initial reaction was justified.
We believe M&A will continue at a strong pace in the coming months as the economy continues to reopen and banks dust off previously shelved pre-Covid deals. We also expect MOEs will continue to garner more interest due to the aforementioned benefits. Management teams may be more willing to negotiate now than before on price, management roles, board composition, branding, etc. A balanced consideration of the benefits and risks of an MOE is imperative for making the optimal decision. Mercer Capital has significant experience in advising banks as buyers and sellers in transactions, including MOEs.
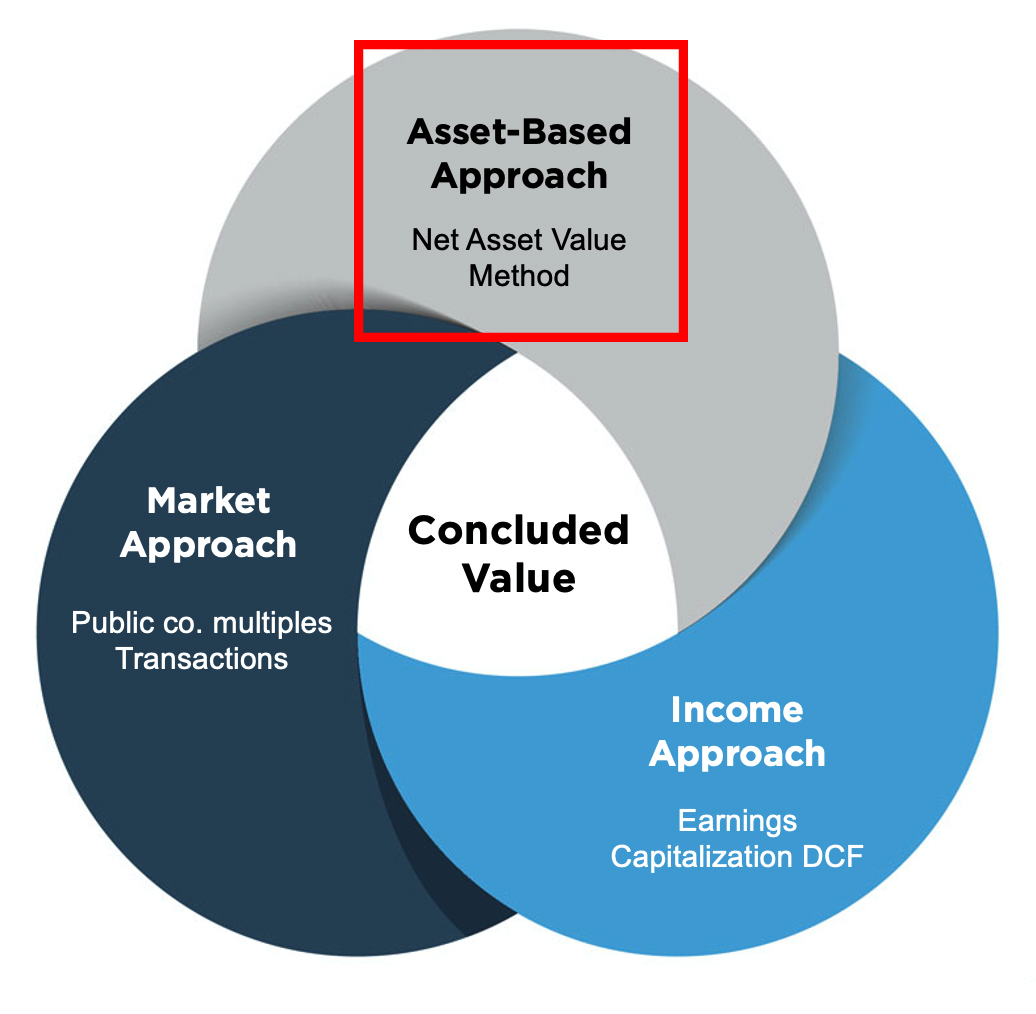
A thoughtful business valuation will likely rely on multiple approaches to derive an indication of value. While each approach should be considered, the approach(es) ultimately relied upon will depend on the unique facts and circumstances of each situation. This article presents a broad overview of the market approach, which is one of the three (the other two being asset and income) approaches utilized in business valuations.
The market approach is a general way of determining a value indication by comparing the subject company or ownership interest to similar businesses, business ownership interests, securities, or intangible assets that have been sold. Within each of the three approaches, there are varying methodologies. Within the market approach, there are two primary methods: the guideline public company method (based on valuation multiples derived from publicly traded companies in similar industries), and the guideline transactions method (based on valuation multiples derived primarily from merger & acquisition transactions involving companies similar to the subject company). Historical transactions in the stock of a company being valued can also be considered under the guideline transactions method.
The guideline public company method develops an indication of value based on consideration of publicly traded companies that provide a reasonable basis for comparison to the subject company. The valuation professional will typically conduct a search to identify a group of guideline public companies based on subject company’s industry, and review operating, financial, geographical, industry, and/or market characteristics to ensure that they are reasonable for inclusion.
Analysts express the relationship between the value of a company and a corresponding performance metric in the form of a valuation multiple, as shown in the following equation.
Applied to the subject company, the equation becomes:
The valuation professional must select the most relevant valuation multiples based on a number of factors, including the subject company’s size, profitability, growth prospects, industry, and capital structure. Common valuation multiples include EV (enterprise value) to sales, EV to EBITDA (earnings before interest, taxes, depreciation, and amortization), and Price to Earnings (P/E).1 Additionally, the valuation professional may deem it appropriate to adjust valuation multiples for size, risk, growth, and/or other attributes of the subject company relative to the guideline public companies from which the multiples were derived.2
The guideline public company method relies on objective, empirical data that can be used to draw inferences about a subject company’s value. And given that public company stocks trade daily, there won’t be a meaningful gap between the relevant valuation date and the data used in the analysis.
However, the method also has drawbacks. Depending on the subject company’s industry, there may be not sufficiently comparable publicly traded companies. Public companies are typically much larger than a private subject company. Public companies will also often have more product and/or geographic diversification. No two companies are identical, so operational, financial, and market factors must be assessed by the valuation professional. Also, two valuation professionals may deem different companies as comparable or not comparable.
While some commonalities may appear obvious, the guideline public company method requires considerable research and diligence. Access to databases that consolidate public company information like Bloomberg, Capital IQ, and TagniFi is helpful, as well.
The valuation professional also needs to understand the general economic environment and how it impacts the subject company and its industry. In a volatile year (such was the one we have experienced with COVID), earnings metrics may approach (or go below) zero, yielding multiples that are sky-high or negative, rendering this method, and potentially the entire market approach, unreliable and inappropriate for use.
A guideline public company group can sometimes provide useful valuation benchmarks. However, it is ultimately left to the analyst to determine if this method is appropriate given the facts and circumstances of subject companies. If deemed appropriate, then the analyst must develop valuation multiples for a subject company based upon a thorough review of a selected guideline group relative to the subject company.
The guideline transactions method is similar to the guideline public company method. However, instead of deriving values from public company stock prices, values are derived from transaction consideration in mergers & acquisitions. It is even sometimes referred to as the M&A method.
Unlike public company stock prices, which can be viewed on a daily basis, guideline transactions occur at a single point in time. As such, market conditions may have changed between the guideline transaction date and the subject company valuation date. Timing is one important consideration. Reliability and accuracy of data is another.
The data for market transactions is typically sourced from various databases, with varying databases for public or private deals. While the providers of private deals attempt to ensure that data is accurate, the underlying information they source is typically self-reported, or sometimes provided by business brokers or investment bankers, instead of being derived from audited and publicly available financial statements for public companies. Additionally, transactions involving comparable companies may in fact take place, but details regarding transaction consideration and/or the target company’s earnings or performance metrics may not be disclosed, making it impossible to use these transactions for valuation inferences.
Market transactions can also have complexities not present in the guideline public company method (which is based on a public company’s common stock price). A market transaction may be structured with an earnout, in which the seller will receive additional consideration at a later date if the acquired company achieves certain financial or operating milestones. A transaction could include a lucrative employment agreement for the primary shareholder, which may influence how much the shareholder is willing to accept for the overall business. Additionally, the seller may provide attractive financing, influencing how much the buyer is willing to pay.
Without knowing all the details of guideline transactions, it is difficult to quantify the impact of these items on transaction consideration, and is often unclear, especially regarding earnouts, how transaction databases incorporate these items.
Additionally, a strategic buyer could have specific motivations to acquire a company due to various synergistic or strategic benefits. Data from strategic transactions are not generally useful in fair market value determinations, which typically do not include strategic benefits.
However, the guideline transactions method has its merits. While guideline public companies are typically much larger in size than private companies, market transactions take place across the size spectrum. Data can be filtered based on the size of the subject company. If the data set is large enough, further filters can be applied based on the subject company’s geographic location and other attributes. This results in companies likely being more directly comparable to the subject company relative to the larger guideline public companies. Ultimately, it is up to the valuation professional to determine the appropriateness of using the guideline transactions method.
Transactions in the stock of a subject company can be used as a subset of the guideline transactions method to develop value indications. With public companies, the best indication of value for shares of a company’s stock, e.g., Microsoft, is the current trading price for its shares.
While private companies, by their very nature, do not have an active trading market for their stock, there are certain circumstances where the guideline transactions method can be applied. However, an important requirement for the application of the guideline transactions method is that the transaction was “arm’s length,” meaning that it took place between independent parties acting in their own self-interests. Transfers among family members or grants to employees are not necessarily representative of fair market value. Timing is also important. How much time has passed since the transaction? In what condition is the business and industry at the valuation date relative to the time of said transaction?
Sometimes we value startup companies, which come with additional considerations. If the company has recently been raising capital, the terms of recent investments can be used to imply a value for an interest. However, the valuation professional must take care to understand any differences between the interest acquired in the transactions and the interest that is being valued. Venture capital investments will often be in the form of preferred stock, which may have attributes that make the shares more valuable than the corresponding shares of common stock (e.g., liquidation preferences, anti-dilution provisions, etc.). Because of the complex nature of pricing preferences in venture capital and private equity transactions, a skilled valuation professional should be involved.
The market approach can be one of the most straightforward and compelling ways to derive the value of a subject company. However, each method within the market approach has its own merits and drawbacks, and thus a competent valuation expert is needed to ensure that the methods are applied in a thoughtful and appropriate manner given the unique facts and circumstances regarding the subject company.
________________________
1 The appropriate value for the numerator is based on whether the metric in the denominator is reflective of all capital providers (in which case enterprise value or total capital value is appropriate), or just equity holders (in which case just the equity value should be included in the numerator). Mercer Capital’s Chairman, Chris Mercer, discusses the distinction between enterprise and equity multiples in more detail here.
2 This is often referred to as a “fundamental adjustment.” A detailed discussion of the fundamental adjustment is outside the scope of this article, though Mercer Capital has a primer on the topic here.
The medical device manufacturing industry produces equipment designed to diagnose and treat patients within global healthcare systems. Medical devices range from simple tongue depressors and bandages, to complex programmable pacemakers and sophisticated imaging systems. Major product categories include surgical implants and instruments, medical supplies, electro-medical equipment, in-vitro diagnostic equipment and reagents, irradiation apparatuses, and dental goods.
The following outlines five structural factors and trends that influence demand and supply of medical devices and related procedures.
The aging population, driven by declining fertility rates and increasing life expectancy, represents a major demand driver for medical devices. The U.S. elderly population (persons aged 65 and above) totaled 49 million in 2016 (15% of the population). The U.S. Census Bureau estimates that the elderly will roughly double by 2060 to 95 million, representing 23% of the total population.
The elderly account for nearly one third of total healthcare consumption. Personal healthcare spending for the population segment was approximately $19,000 per person in 2014, five times the spending per child (about $3,700) and almost triple the spending per working-age person (about $7,200).
According to United Nations projections, the global elderly population will rise from approximately 608 million (8.2% of world population) in 2015 to 1.8 billion (17.8% of world population) in 2060. Europe’s elderly are projected to reach approximately 29% of the population by 2060, making it the world’s oldest region. While Latin America and Asia are currently relatively young, these regions are expected to undergo drastic transformations over the next several decades, with the elderly population expected to expand from approximately 8% in 2015 to more than 21% of the total population by 2060.
Demographic shifts underlie the expected growth in total U.S. healthcare expenditure from $3.8 trillion in 2019 to $6.2 trillion in 2028, an average annual growth rate of 5.4%. While this projected average annual growth rate is more modest than that of 7.0% observed from 1990 through 2007, it is more rapid than the observed rate of 3.9% between 2009 and 2018. Projected growth in annual spending for Medicare (7.6%) and Medicaid (5.5%) is expected to contribute substantially to the increase in national health expenditure over the coming decade. Healthcare spending as a percentage of GDP is expected to expand from 17.7% in 2018 to 19.7% by 2028.
Since inception, Medicare has accounted for an increasing proportion of total U.S. healthcare expenditures. Medicare currently provides healthcare benefits for an estimated 60 million elderly and disabled people, constituting approximately 15% of the federal budget in 2018 and is expected to rise to 18% by 2028. Medicare represents the largest portion of total healthcare costs, constituting 20% of total health spending in 2017. Medicare also accounts for 25% of hospital spending, 30% of retail prescription drugs sales, and 23% of physician services.
Due to the growing influence of Medicare in aggregate healthcare consumption, legislative developments can have a potentially outsized effect on the demand and pricing for medical products and services. Net mandatory benefit outlays (gross outlays less offsetting receipts) to Medicare totaled $644 billion in 2019, and are expected to reach $1.4 trillion by 2030.
The Patient Protection and Affordable Care Act (“ACA”) of 2010 incorporated changes that are expected to constrain annual growth in Medicare spending over the next several decades, including reductions in Medicare payments to plans and providers, increased revenues, and new delivery system reforms that aim to improve efficiency and quality of patient care and reduce costs. While political debate centered around altering the ACA has been a continuous fixture in American politics since its passing, it is unlikely that material reform to the ACA might occur in the near future under the Biden Administration. On a per person basis, Medicare spending is projected to grow at 5.1% annually between 2018 and 2028, compared to 1.7% average annualized growth realized between 2010 and 2018.
As part of ACA legislation, a 2.3% excise tax was imposed on certain medical devices for sales by manufacturers, producers, or importers. The tax was made effective on December 31, 2012 but met resistance from industry participants and policy makers. In late 2015, Congress passed legislation promulgating a two-year moratorium on the tax beginning January 2016. In January 2018, the moratorium suspending the medical device excise tax was extended through 2019. In December 2019, the medical device excise tax was repealed.
The primary customers of medical device companies are physicians (and/or product approval committees at their hospitals), who select the appropriate equipment for consumers (patients). In most developed economies, the consumers themselves are one (or more) step removed from interactions with manufacturers, and therefore pricing of medical devices. Device manufacturers ultimately receive payments from insurers, who usually reimburse healthcare providers for routine procedures (rather than for specific components like the devices used). Accordingly, medical device purchasing decisions tend to be largely disconnected from price.
Third-party payors (both private and government programs) are keen to reevaluate their payment policies to constrain rising healthcare costs. Several elements of the ACA are expected to limit reimbursement growth for hospitals, which form the largest market for medical devices. Lower reimbursement growth will likely persuade hospitals to scrutinize medical purchases by adopting i) higher standards to evaluate the benefits of new procedures and devices, and ii) a more disciplined price bargaining stance.
The transition of the healthcare delivery paradigm from fee-for-service (“FFS”) to value models is expected to lead to fewer hospital admissions and procedures, given the focus on cost-cutting and efficiency. In 2015, the Department of Health and Human Services (“HHS”) announced goals to have 85% and 90% of all Medicare payments tied to quality or value by 2016 and 2018, respectively, and 30% and 50% of total Medicare payments tied to alternative payment models (“APM”) by the end of 2016 and 2018, respectively. A report issued by the Health Care Payment Learning & Action Network (“LAN”), a public-private partnership launched in March 2015 by HHS, found that 35.8% of payments were tied to Category 3 and 4 APMs in 2018, compared to 32.8% in 2017.
Some expressed concern that the shift toward value-based care would encounter difficulties with the Trump Administration. In November 2017, the CMS partially canceled bundled payment programs for certain joint replacement and cardiac rehabilitation procedures. However, indications are that the CMS supports valuebased care and wants pilot programs to accelerate. In 2020, CMS released guidance for states on how to advance value-based care (“VBC”) across their healthcare systems, emphasizing Medicaid populations, and to share pathways for adoption of such approaches. Ultimately, lower reimbursement rates and reduced procedure volume will likely limit pricing gains for medical devices and equipment.
The medical device industry faces similar reimbursement issues globally, as the EU and other jurisdictions face similar increasing healthcare costs. A number of countries have instituted price ceilings on certain medical procedures, which could deflate the reimbursement rates of third-party payors, forcing down product prices. Industry participants are required to report manufacturing costs and medical device reimbursement rates are set potentially below those figures in certain major markets like Germany, France, Japan, Taiwan, Korea, China and Brazil. Whether third-party payors consider certain devices medically reasonable or necessary for operations presents a hurdle that device makers and manufacturers must overcome in bringing their devices to market.
Historically, much of the growth for medical technology companies has been predicated on continual product innovations that make devices easier for doctors to use and improve health outcomes for the patients. Successful product development usually requires significant R&D outlays and a measure of luck. If viable, new devices can elevate average selling prices, market penetration, and market share.
Government regulations curb competition in two ways to foster an environment where firms may realize an acceptable level of returns on their R&D investments. First, firms that are first to the market with a new product can benefit from patents and intellectual property protection giving them a competitive advantage for a finite period. Second, regulations govern medical device design and development, preclinical and clinical testing, premarket clearance or approval, registration and listing, manufacturing, labeling, storage, advertising and promotions, sales and distribution, export and import, and post market surveillance.
In the U.S., the FDA generally oversees the implementation of the second set of regulations. Some relatively simple devices deemed to pose low risk are exempt from the FDA’s clearance requirement and can be marketed in the U.S. without prior authorization. For the remaining devices, commercial distribution requires marketing authorization from the FDA, which comes in primarily two flavors.
Click here to enlarge the image
Pursuant to the Medical Device User Fee Modernization Act (“MDUFA”), the FDA collects user fees for the review of devices for marketing clearance or approval. The current iteration of the Medical Device User Fee Act (MDUFA IV) came into effect in October 2017. Under MDUFA IV, the FDA is authorized to collect almost $1 billion in user fees, an increase of more than $320 million over MDUFA III, between 2017 and 2022. Intended to begin in 2020, negotiations for MDUFA V were delayed due to the COVID-19 pandemic.
The European Union (“EU”), along with countries such as Japan, Canada, and Australia all operate strict regulatory regimes similar to that of the FDA, and international consensus is moving towards more stringent regulations. Stricter regulations for new devices may slow release dates and may negatively affect companies within the industry.
Medical device manufacturers face a single regulatory body across the EU. In order for a medical device to be allowed on the market, it must meet the requirements set by the EU Medical Devices Directive. Devices must receive a Conformité Européenne (“CE”) Mark certificate before they are allowed to be sold in that market. This CE marking verifies that a device meets all regulatory requirements, including EU safety standards. A set of different directives apply to different types of devices, potentially increasing the complexity and cost of compliance.
Emerging economies are claiming a growing share of global healthcare consumption, including medical devices and related procedures, owing to relative economic prosperity, growing medical awareness, and increasing (and increasingly aging) populations. According to the WHO, middle income countries, such as Russia, China, Turkey, and Peru, among others, are rapidly converging towards outsized levels of spending as their income scales. When countries grow richer, the demand for health care increases along with people’s expectation for government financed healthcare. Middle income country share, the fastest growing economic sector, increased from 15% to 19% of global spending between 2000 and 2017. As global health expenditure continues to increase, sales to countries outside the U.S. represent a potential avenue for growth for domestic medical device companies. According to the World Bank, all regions (except Sub-Saharan Africa and South Asia) have seen an increase in healthcare spending as a percentage of total output over the last two decades.
Global medical devices sales are estimated to increase 5.4% annually from 2018 to 2025, reaching nearly $612.7 billion according to data from Fortune Business Insights. While the Americas are projected to remain the world’s largest medical device market, the Asia/Pacific and Western Europe markets are expected to expand at a quicker pace over the next several years.
Demographic shifts underlie the long-term market opportunity for medical device manufacturers. While efforts to control costs on the part of the government insurer in the U.S. may limit future pricing growth for incumbent products, a growing global market provides domestic device manufacturers with an opportunity to broaden and diversify their geographic revenue base. Developing new products and procedures is risky and usually more resource intensive compared to some other growth sectors of the economy. However, barriers to entry in the form of existing regulations provide a measure of relief from competition, especially for newly developed products.
The COVID-19 pandemic disrupted the healthcare sector, causing demand for optional procedures and in person visits to fall as medical resources were allotted for COVID-19 relief. At the onset of the pandemic, local governments implemented stay-at-home orders which restricted in-person visits to healthcare providers which resulted in decreased diagnoses and postponed procedures. As the pandemic went on, patients avoided nonessential medical care out of fear of contracting or spreading the virus.
In October of 2020, a McKinsey survey found that 40% of individuals reported having canceled upcoming appointments, and an additional 15% reported needing care but had not scheduled or received care. As a result, demand for industry products fell, with the exception of respiratory ventilators, breath monitors, and other devices used in the treatment of COVID-19. Simultaneously, the pandemic also decreased production capacity and fulfillment as manufacturers and transportations companies were forced to send employees home for social distancing measures. As of December 2020, IBISWorld projected medical device industry revenue to fall by 5.7% year-over-year for 2020 before rebounding in 2021 upon mass vaccinations.
Barring another recession or material reduction in bank stock valuations in the public markets, M&A activity should improve as 2021 progresses.
However, some boards that would like to sell may have a hard time accepting a lower price versus what was obtainable a couple of years ago.
One way to bridge the bid-ask gap is to consider transactions with more rather than less consideration consisting of the buyer’s common shares. Cash deals “cash-out” shareholders who then reinvest after-tax proceeds. Stock deals allow the target’s shareholders to remain invested in a sector that still trades cheap to longer-term valuations.
This session, presented as part of the 2021 Acquire or Be Acquired Conference sponsored by Bank Director, addresses these issues.
By mid-2020, traditional brick and mortar retailers, including well-known brands such as J.C. Penny, J. Crew, and Pier One, were christening what many believed to be the first wave of post COVID-19 bankruptcies. At the time, our view was that companies impacted by the COVID-19 pandemic might look for relief via M&A while opportunistic buyers might look to take advantage of lower valuations in the market. While some industries have fared worse than others, the unprecedented fiscal aid pumped into the economy seems to have warded off a wave of bankruptcies in the middle and upper market, or at least prevented a surge at the scale many were predicting. M&A deal volume recovered in the second half of 2020 after coming to a near halt in the initial months of the pandemic. Deal volume, while increasing, does generally remain below levels seen in 2018 and 2019. All the while, capital has flooded the market, with a good amount of it ending up parked in banks, resulting in bank deposits increasing over 20% in 2020.
While nothing is for certain, it appears that the worst of the economic risks tied to the pandemic could be behind us. Estimates range widely, from as early as July 2021 to as late as 2022, but the U.S. now has a path to reaching herd immunity through the administration of multiple vaccines. As it stands in March 2021, over a quarter of the U.S. population has received at least one dose of a vaccine. The public markets have viewed the rollout favorably, and while one explanation for the market’s strong 2020 performance might be summed up by a blend of a low-risk free rate amidst asset inflation, it is undeniable that valuations in the public markets are pricing in some level of a continued post-pandemic recovery.
As the public health crisis continues to improve, one would expect deal volume to increase in tandem. Prior to the pandemic, many market observers had concluded that small to middle market M&A activity was poised for an uptick, as a generation of baby boomers was expected to retire and in turn monetize their stake of private company ownership. That generational trend remains in-tact post COVID. The Biden administrations’ efforts to increase the capital gains tax rate may also accelerate some M&A activity in the immediate short-term, as sellers seek to position transactions to be taxed at current tax rates.
While the middle market M&A environment has not witnessed the downward shift in values that one might have expected following the economic shutdown of the early pandemic period; neither has it seen the run-up in values that was exhibited in the public markets throughout the second half of 2020 and into early 2021. If the public markets provide a meaningful measure for general economic expectations, then how long until these higher expectations are priced into middle market M&A values? At a minimum, the downside pandemic-related risks that were initially so prevalent appear to have diminished. As with most things in this environment, risks are very industry specific and there are many industries that have exhibited (and will likely continue to exhibit) dramatic negative shifts in valuations. Overall, however, transaction multiples appear to have declined only a small amount from pre-pandemic levels.
As my colleague Jeff Davis concluded in a recent piece for this blog, the availability of debt financing for most family businesses in 2021 should be favorable, likely with a low cost of credit and lenient terms by historical standards. Jeff noted some exceptions, such as hotels, retail CRE, restaurants, and tourism-related businesses, but on the whole banks are eager to invest. Loans in the commercial banking system declined for the first time in a decade in 2020 and for only the second time in 28 years while deposits remain historically high. In the current low-rate environment, revenue pressures are high for banks as cash and bonds yield little to nothing. Without a competitive alternative, banks and investors flush with capital are under pressure to compete for lending opportunities to produce a return while loan demand is weak as the U.S. market rounds what many believe to be the very beginnings of a new economic cycle.
For family business directors, 2021 should be an opportune time to consider making an acquisition. General indications on valuation suggest that the private company M&A market has not been priced-up at anywhere near what has been seen in the public markets. While this difference may be caused by a public market over-valuation issue that is “corrected” in the short-term, it suggests that there could be positive momentum in private company valuations as the economy continues to move through subsequent stages of the post-pandemic recovery. A good M&A deal can be made even better with favorable financing, which should be available to many borrowers in the current environment.
We can’t predict the future, but those who take a buyer’s view of the M&A market now might be rewarded with enhanced returns. With pent up demand and a high availability of capital, we anticipate a rise in M&A activity over the next year with the best valuations and financing deals likely favoring the early bidders.
In recent years, credit unions have been increasingly active as acquirers in whole bank and branch transactions. This session focuses on the top considerations for credit unions when assessing and valuing bank and branch franchises in the current environment.
For bankers, this session should enhance your knowledge regarding how credit unions identify potential targets, assess potential opportunities and risks of a bank or branch acquisition, and ultimately determine a valuation range for target banks and branches.
This session, presented as part of the 2021 Acquire or Be Acquired Conference sponsored by Bank Director, addresses these issues.
The discount rate is the key factor in business valuation that converts future dollars into present value as of the valuation date. For a layperson, the discount rate utilized in a business valuation may appear to be subjective and pulled out of a hat. However, the discount rate is a crucial component of the valuation formula and must be assessed for the specific company at hand.
Using any method under the income approach, the valuation formula comes down to three things:
In valuations that “feel” too high or too low, one of the potential culprits may be an aggressive discount rate, either on the high or low end. There are several generally accepted methodologies to build up discount rates employed by valuation analysts. In this article, we will examine the various components of a discount rate. Then, we will relate the discount rate to rates of return of other investments that should provide a commonsense road map for what is reasonable and what is not.
Companies with larger cash flows are likely to be more valuable, as are those with cash flows that are growing at a faster rate. Each of these statements makes perfect sense. Now, if the future cash flows are less certain, they are deemed to be riskier, which reduces the value of the business. The discount rate “discounts” future cash flows to a present value. As we have all heard, “a dollar today is better than a dollar tomorrow.” Measuring the present value of future earnings allows us to develop a value for a business today.
The discount rate goes by many names including “equity discount rate,” “return on investment,” “cost of capital,” and “rate of return.” For companies that use debt, the appropriate way to discount cashflows may be the weighted average cost of capital, or “WACC.” Thinking about a discount rate as a rate of return is likely the most intuitive approach.
Returns to an equity investor come after all other parties have been paid. Debt capital providers are paid before equity capital providers, typically at a fixed or floating interest rate (for example, a company’s line of credit could be 4.0% fixed rate or vary, such as 1% over the prime rate). After generating revenue, paying expenses and taxes, and reinvesting funds needed in the business, any remaining cash flow is shared by the equity investors. Because equity investors come last, they require the highest rate of return in order to provide equity capital to a business. Intuitively, this explains why the cost of equity, or “discount rate,” is higher than the cost of debt, or interest rate.
Before we delve into what is reasonable and what is not, one must first understand the components of a discount rate as these help the attorney understand how an appraiser estimates this rate. We describe the development of an equity discount rate with a description of each component below.
Risk-Free Rate: As alluded to previously, we would all prefer a dollar today over a dollar tomorrow, which both removes the uncertainty of receipt and quells any potential concerns about lost purchasing power from rising prices. To build up the discount rate, we begin with a base rate called the “risk-free rate,” which compensates for the time value of money. An example of a risk-free rate is the 20-Year Treasury Bond yield as of the valuation date. If an appraisal uses an alternative figure that is materially different than the prevailing rate, the assumption would likely require justification.
Equity Risk Premium: Next, to capture generic market risk for the equity market, appraisers employ an “equity risk premium,” frequently in the range of 4.0% to 7.0%, which captures what an investor would expect for an investment in the equity market over a less risky investment like the bond market. Again, something out of this range would likely require justification. [1]
Beta: The equity risk premium is then multiplied by a selected beta. The beta statistic measures a company’s exposure to market risks, with a beta of 1.0 indicating typical market risk. Low beta companies or industries are less correlated with market risk, while high beta companies are more exposed to market risk. For example: auto dealers and airlines tend to ebb and flow with the economy, doing well when the market is good and declining when economic activity contracts, meaning they tend to have betas of 1.0 or higher. In contrast, grocery stores tend to have a beta below 1.0. When the economy contracts, consumers increase their consumption at grocery stores instead of restaurants to save money. Consumers also need toilet paper regardless of the economic environment, and companies that sell such durable goods (like grocery stores) tend to be lower beta companies.
To this point, we have built up the equity discount rate under the Capital Asset Pricing Model (“CAPM”) for a diversified equity market investment.[2] The risk-free rate plus the equity risk premium (assuming a beta of 1.0) gives a rate of return of approximately 7.0% to 8.0%. This should sound familiar because money managers and retirement planners frequently say equity investors should anticipate investment returns on the order of 7.0%, or something in this range. While Mercer Capital makes no such investment advice, this is a reasonable consideration for large, diversified equity portfolios in the context of building up a discount rate for a smaller private company. However, in recognition of the greater risks inherent in privately held smaller companies, business valuation analysts frequently consider two other sources of risk premia: size and specific company.
Size Premium: Smaller companies tend to be subject to greater issues with concentration and diversification. Smaller companies also tend to have less access to capital, which tends to raise the cost of capital. To compensate for the higher level of risks as compared to the broad larger equity market, appraisers frequently add a premium of approximately 3.0% to 5.0% (or more, for very small businesses) to the discount rate when valuing smaller companies. To get an idea of reasonableness, we can consider the following example. A company valued at over $200 million may seem large, but it is actually relatively small when compared to most publicly traded companies. As such, a size premium would still apply, albeit on the lower end. Valuation analysts source these size premiums from data which provides empirical evidence in support of risks associated with smaller size. This data is updated annually, and providers such as Duff & Phelps are frequently cited.
Specific Company Risk Premium: The final component of a discount rate is the specific company risk premium. This represents the “risk profile” specific to the individual subject company above and beyond the factors above – i.e., what is the required return an investor requires to invest in said company over any other investment?
To illustrate with an example, a soon-to-retire CEO of a small business maintains all client relationships. In assessing the potential risk(s) to the business, we would inquire about and assess the risk of clients leaving when the CEO retires. In addition to the risk of losing clients, there are other risks associated with the departure of a key executive. Valuation analysts refer to these risks as “key person risk,” or “key person dependency.” We would also assess depth of other management and succession planning. A few additional examples, but certainly not all, of company specific risk are shown below:
When determining a specific company risk premium, some analysts may choose to assess a company through a SWOT analysis – strengths, weakness, opportunities, and threats of the company – relative to past performance, performance of its peers, the industry, and the broader economy. Put simply, what is the risk profile of the business? If there are risks (or lack thereof) that are specific to said company, how much higher or lower does the discount rate have to be for an investor to be willing to invest in this company instead of an alternative company or investment?
The specific company risk premium is frequently an area where experts may differ due to selection of varying levels of risk for a company. While understanding what “feels” reasonable here takes nuance and experience, a valuation analyst should provide the attributes which support the selected risk premium.
Following our equity build-up example in Figure 1, adding a size premium of 5.0%, and specific company of 4.0% to an equity market return of 7.75% leads to a discount rate of 16.75%. For a smaller, riskier company, this could be higher; however, for a larger, less risky company with consistent history of strong earnings, this could be lower. An equity discount rate range of 12% to 20%, give or take, is likely to be considered reasonable in a business valuation. This is about in line with the long-term anticipated returns quoted to private equity investors, which makes sense, because a business valuation is an equity interest in a privately held company. Again, while many of the specific terms utilized in the build-up of a discount rate may be new to attorneys, rates of return quoted in that context are more familiar to many.
A business appraisal with a discount rate below 10% likely deserves more scrutiny, but it may be reasonable if the company is sufficiently large, diversified, well-capitalized, less exposed to market risk, has a strong management team and succession plan, and generates consistent cash flow and/or growth.
On the other end of the spectrum, a company with a discount rate in excess of 25% may be undervalued, and such a discount rate similarly deserves justification. However, there could be numerous reasons why this is ultimately reasonable given specific facts and circumstances. Early stage/start-up companies without sufficient history of earnings and performance would likely have a high discount rate. While there could be certain instances where a discount rate above 25% may be reasonable, a proper appraisal will enumerate in detail why such a large discount rate is warranted.
In financial situations that may be scrutinized by courts and other potential adversaries, an expert’s financial, economic, and accounting experience and skills are invaluable. These complex analyses are best performed by a competent financial expert who will be able to define and quantify the financial aspects of a case and effectively communicate the conclusion.
[1] Mercer Capital regularly reviews a spectrum of studies on the equity risk premium and also conducts its own study. Most of these studies suggest that the appropriate large capitalization equity risk premium lies in the range of 4.0% to 7.0%.
[2] W.F. Sharpe, “Capital Asset Prices: A Theory of Market Equilibrium Under Conditions of Risk,” Journal of Finance, Vol. 19 (1964): pp. 425-442.
Travis W. Harms, CFA, CPA/ABV, presented the session “Should You Diversify Your Family Business” at Transitions Spring Conference 2021 on March 24, 2021. This conference was sponsored by Family Business Magazine.
Diversification — such as entry into new lines of business, new geographies, or new markets — can protect your family enterprise from economic downturns. In this presentation, he provides an overview of what is involved in diversifying a family business and the best way to calculate whether it’s the right move for the business.
Karolina Calhoun, CPA/ABV/CFF, presented the session “What Attorneys Should Know About Valuations of Closely Held Businesses” at the Tennessee Trial Lawyers Association’s “Memphis Family Law Seminar 2021” on March 18, 2021.
The valuation of a business is a complex process, requiring specialized professionals who apply the same finance & economic fundamentals used by public companies to evaluate and price private companies. This presentation delves into the processes and methodologies used in a valuation and provides examples of scenarios that may invoke the need for valuation services.
2020 was a tough year for most of us. Schools and churches closed, sports were cancelled, and many lost their jobs. There were a select few, however, that thrived during 2020. Jeff Bezos and Elon Musk saw a meteoric rise in their personal net worth over the past 12 months. Mortgage bankers are another group showered with unexpected riches last year (and apparently this year).
As shown in Figure 1, long-term U.S. Treasury and mortgage rates have been in a long-term secular decline for about four decades. Last year, long-term rates fell to all-time lows because of the COVID induced recession after having declined modestly in 2019 following too much Fed tightening in 2018. The surprise was not an uptick in refinancing activity, but that it was accompanied by a strong purchase market too. Housing was and still is hot; maybe too hot.
Overlaid on the record volume (the Mortgage Bankers of America estimates $3.6 trillion of mortgages were originated in 2020 compared to $2.3 trillion in 2019 and $1.7 trillion in 2017 and 2018) was historically high gain on sale (“GOS”) margins. The industry was capacity constrained after cutting staff in 2018 when rates were then rising.
Private equity and other owners of mortgage companies set their eyes on the public markets after many companies attempted to sell in 2018 with mixed success at best. During the second half of 2020, Rocket Mortgage ($RKT) and Guild Mortgage ($GHLD) made an initial public offering and began trading while seven other nonbank mortgage companies have either filed for an IPO or announced plans to do so. Also, United Wholesale Mortgage ($UWMC) went public by merging with a SPAC.
The inability of several (or more) mortgage companies to undergo an IPO at a price that was acceptable to the sellers has an important message. The industry was accorded a low valuation by Wall Street on presumably peak earnings even though many mortgage companies will produce an ROE that easily exceeds 30%. The assumption is that earnings will decline because rates will rise and/or more capacity will reduce GOS margins.
While it is likely 2020 will represent a cyclical peak, no one knows how steep (or gentle) the descent will be and how deep the trough will be. Mortgage companies may produce 20% or better ROEs for several years. One may question the multiple to place on 2020 earnings, but book value could double in three or four years if conditions remain reasonably favorable.
Community and regional banks with mortgage operations have benefitted from the mortgage boom, too. Although various bank indices were negative for the year, it could have been much worse given investor fears surrounding credit losses and permanent impairment to net interest margins given the collapse in rates. In a sense, outsized mortgage banking revenues funded reserve builds for many banks and masked revenue weakness attributable to falling NIMs.
The average NIM for banks in the U.S. with assets between $300 million and $1 billion as of September 30, 2020 is shown in Figure 2. The NIM fell 45bps from 3Q19 to 3Q20 due to multiple moving pieces but primarily reflected an increase in liquid assets because deposits flooded into the banking system and because the reduction in the yield on loans and securities was greater than the reduction in the cost of funds.
Unless the Fed is able (and willing) to raise short-term policy rates in the next year or two, we suspect loan yields will grind lower as lenders compete heavily for assets with a coupon (i.e., loans) because liquidity yields nothing and bonds yield very little. Deposit costs will not offset because rates are or soon will be near a floor. Fee income and expense management are more critical than ever for banks to maintain acceptable profitability. When analyzing the same group of banks (assets $300M – $1B), banks with higher GOS revenues as a percentage of total revenue tended to be more profitable. As shown in Figure 3, median profitability was ~15% greater in the trailing twelve months for banks more engaged in mortgage activity than those that were not.
Selling long-term fixed-rate mortgages for most banks is a given because the duration of the asset is too long, especially when rates are low. The decision is more nuanced for 15-year mortgages with an average life of perhaps 6-7 years. With loan demand weak and banks extremely liquid, most banks will retain all ARM production and perhaps some 15-year paper as an alternative to investing in MBS because yields on originated paper are much better.
As for 30-year mortgages, net production profits for 3Q20 increased above 200bps according to the MBA for the first time since the MBA began tracking the data in 2008. Originating and selling long-term fixed rate mortgages has been exceptionally profitable in 2020.
Mortgage banking in the form of originations is a highly cyclical business (vs servicing); however, it is a counter-cyclical business that tends to do well when the economy is struggling and therefore core bank profitability is under pressure. We have long been observers of the mortgage banking conundrum of “what is the earnings multiple?” It is a tougher question for an independent mortgage company compared to a bank where the earnings are part of a larger organization. Even when outsized mortgage banking earnings may weigh on a bank’s overall P/E, mortgage earnings can be highly accretive to capital.
In the February issue of Bank Watch, we will explore how to value a mortgage company either as a stand-alone or as a subsidiary or part of a bank to understand in more detail the true valuation impacts of mortgage revenue.
Originally appeared in Mercer Capital’s Bank Watch, January 2021.
The January Bank Watch provided an overview of the mortgage industry and its importance in boosting bank earnings in the current low-rate environment. As we discussed, mortgage volume is inversely correlated to interest rates and more volatile than net interest income. In this article, we discuss key considerations in valuing a mortgage company/subsidiary, including how the public markets price them.
Similar to typical bank valuations, there are three approaches to consider when determining the value of a mortgage company/subsidiary: the asset approach, the market approach, and the income approach. However, since the composition of both the balance sheet and income statement differ from banks, several nuances arise.
Asset based valuation methods include those methods that write up (or down) or otherwise adjust the various tangible and/or intangible assets of an enterprise. For a mortgage company, these assets may include mortgage servicing rights (“MSR”). The fair value of the MSR book is the net present value of servicing revenue minus related expenses, giving consideration to prepayment speeds, float, and servicing advances. MSR fair value tends to move opposite to origination volume. For example, MSR values tend to increase in periods marked by low origination activity. Other key items to consider include any non-MSR intangible assets, proprietary technology, funding, relationships with originators and referral sources, and the existence of any excess equity.
methods include a variety of methods that compare the subject with transactions involving similar investments, including publicly traded guideline companies and sales involving controlling interests in public or private guideline companies. Historically, publicly traded pure-play mortgage companies were a rare breed; however, the COVID-19 mortgage boom has produced several IPOs, and others may follow. There are many publicly traded banks that derive significant revenues from mortgage operations, especially in this low-rate environment.
The basic method utilized under the market approach is the guideline public company or guideline transactions method. The most commonly used version of the guideline company method develops a price/earnings (P/E) ratio with which to capitalize net income. If the public company group is sufficiently homogeneous with respect to the companies selected and their financial performance, an average or median P/E ratio may be calculated as representative of the group. Other activity-based valuation metrics for the mortgage industry include EBITDA, revenues, or originations.
Another relevant indicator includes price/tangible book value as investors tend to treat tangible book value as a proxy for the institution’s earnings capabilities. The key to this method lies in finding comparable companies with a similar revenue mix (high fee income) and profitability.
When examining the public markets, there are generally two types of companies that can be useful in gathering financial and valuation data: banks emphasizing mortgage activities and non-bank mortgage companies.
Figure 1 details the first step in identifying a group of banks with significant mortgage operations. First, financial data from the most recently available quarter (4Q20) regarding banks with assets between $1 billion and $20 billion were identified. Once that broad group of banks is identified, it is then important to segment the group further to identify those with significant gain on loan sales as a proportion of revenue and particularly those with higher than typical mortgage revenues/originations as opposed to SBA or PPP loan originations.
Non-bank mortgage companies found favor with the public markets in 2020 as beneficiaries of the sharp reduction in mortgage rates. In 2021 investor sentiment has faltered due to the impact of rising long-term rates on consensus earning estimates. Several companies undertook IPOs, while another company went public via merging with a SPAC. This expanded the group of non-bank mortgage companies from which to derive valuation multiples and benchmarking information. Figure 2 includes total return data for non-bank mortgage companies.
Notable transactions include the following: Rocket Mortgage (NYSE: RKT) raised $1.8 billion via an IPO at an approximate $36 billion valuation in August; Guild Holdings (NASDAQ: GHLD) raised ~$98 million in a November IPO; United Wholesale Mortgage (NYSE: UWM) went public in the largest SPAC deal in history (~$16 billion) that closed in 2021; and Loan Depot (NYSE: LDI) went public during February by raising $54 million.
Other pending IPOs based upon public S-1 filings include Caliber Home Loans and Better.com. Amerihome Mortgage Company had filed a registration statement but apparently obtained better pricing through an acquisition by Western Alliance Bancorp (NYSE: WAL) during February that was valued at ~ $1.0 billion at announcement, or about 1.4x the company’s tangible book value.
While this activity is positive for mortgage companies, the IPOs were downsized in terms of the number of shares sold with pricing below the initial target range or at the low end of the range as investors hedged how far and how fast earnings could fall in a rising rate environment.
For guideline M&A transactions, the data is often limited as there may only be a handful of transactions in a given year and even fewer with reported deal values and pricing multiples. However, meaningful data can sometimes be derived from announced transactions with transparent pricing and valuation metrics.
After deriving the “core” earnings estimate for the mortgage company as well as reasonable valuation multiples, other key valuation elements to consider include: any excess equity, mortgage servicing rights, unique technology solutions that differentiate the company, origination mix (refi vs. purchase; retail vs. correspondent or wholesale), geographic footprint of originations/ locations, and risk profile of the balance sheet and originations (for example, agency vs. non-agency loans).
Valuation methods under the income approach include those methods that provide for the direct capitalization of earnings estimates, as well as valuation methods calling for the forecasting of future benefits (earnings or cash flows) and then discounting those benefits to the present at an appropriate discount rate. For banks, the discounted cash flow (“DCF”) method can be a useful indication of value due to the availability and reliability of bank forecast/capital plans. However, due to the volatile and unpredictable nature of mortgage earnings, this method faces challenges when applied to a mortgage company. In certain situations, the DCF method may not be utilized due to uncertainties regarding the earnings outlook. In others, the DCF method may be applied with the subject company’s level of mortgage origination activity tied to a forecast for overall industry originations and historical gain on sale margins.
Given the potentially limited comparable company data and the difficulty associated with developing a long-term forecast for a DCF analysis, the single period income capitalization method may be useful.
This method involves determining an ongoing level of earnings for the company, usually by estimating an ongoing level of mortgage origination activity and a pretax margin and capitalizing it with a “cap rate”. The cap rate is a function of a perpetual earnings growth rate and a discount rate that is correlated with the entity’s risk. Whereas we would likely use recent earnings in the market approach, in the income capitalization method it makes sense to normalize earnings using a longer-term average, which considers origination and margin levels over an entire mortgage operating cycle.
Mortgage earnings and margins are cyclical. Due to the volatile nature of mortgage earnings, a higher discount rate is normally used. Therefore, a mortgage company’s earnings typically receive a lower multiple than a bank’s more stable earnings.
A mortgage subsidiary can be a beneficial tool for community banks to increase earnings and diversify revenue. This strategy, while clearly beneficial now, can be utilized throughout the business cycle. As rates fall and net interest income faces pressure, gains on the sale of loans should increase (and vice versa) to create counter-cyclical revenues. As we’ve discussed, the inherently volatile income from a mortgage subsidiary is not usually treated equally to net interest income in the public markets. Although, when it comes to price/tangible book value multiples, profitability is critical whether it is driven by mortgage activity or not. There are many factors to consider in valuing a mortgage company.
If you are considering this line of business to diversify your bank or desire a valuation of a mortgage operation, feel free to reach out for further discussion.
Originally appeared in Mercer Capital’s Bank Watch, February 2021.
This article discusses important concepts of personal goodwill in divorce litigation engagements. The discussion relates directly to several divorce litigation cases involving owners of automobile dealerships. These real life examples display the depth of analysis that is critical to identifying the presence of personal goodwill and then estimating or allocating the associated value with the personal goodwill. The issues discussed here pertain specifically to considerations utilized in auto dealer valuations, but the overall concepts can be applied to most service-based industries.
It is important that the appraiser understands the industry and performs a thorough analysis of all relevant industry factors. It is also important to determine how each state treats personal goodwill. Some states consider personal goodwill to be a separate asset, and some do not make a specific distinction for it and include it in the marital assets.
Personal goodwill was an issue in several of our recent litigated divorce engagements. It is more prevalent in certain industries than others and varies from matter to matter. However, although there are several accepted methodologies to determine personal goodwill, there is not a textbook that discusses where it exists and where it doesn’t. Before any attempts to measure and quantify it, an important question to ask is “Does it exist?” Often with ambiguous concepts like personal goodwill, the adage “you know it when you see it” is most appropriate.
In this article, we examine personal and enterprise goodwill using a specific fact pattern unique to the auto dealership industry. Beyond this illustrative example, the analyses can be applied in other industries, but must be considered carefully for the unique facts and circumstances of each matter.
Personal goodwill is value stemming from an individual’s personal service to a business and is an asset that tends to be owned by the individual, not the business itself. Personal goodwill is part of the larger bucket of an intangible asset known as goodwill. The other portion of goodwill, referred to as enterprise or business goodwill, relates to the intangible asset involved and owned by the business itself.1
Commercial and family law litigation cases aren’t typically governed by case law resulting from Tax Court matters and can differ by jurisdiction, but Tax Court decisions offer more insight into defining the conditions and questions that should be asked in an evaluation of personal goodwill. One seminal Tax Court case on personal goodwill is Martin Ice Cream vs. Commissioner.2 Among the Court’s discussions and questions to review were the following:
Another angle with which to evaluate the presence of personal goodwill, specifically to professional practices, is provided in Lopez v. Lopez.3 Lopez suggests several factors that should be considered in the valuation of professional (personal) goodwill as:
Many states identify and distinguish between personal goodwill and enterprise goodwill. Further, numerous states do NOT consider the personal goodwill of a business to be a marital asset for family law cases. For example, a business could have a value of $1 million, but a certain portion of the value is attributable and allocated to personal goodwill. In this example, the value of the business would be reduced for personal goodwill for family law cases and the marital value of the business would be considered at something less than the $1 million value.
In litigation matters, we always try to avoid the absolutes: always and never. The concept of personal goodwill is easier identified and more prevalent in service industries such as law practices, accounting firms, and smaller physician practices. Does that mean it doesn’t apply to more traditional retail and manufacturing industries? In each case, the fundamental question that should be first answered is “Is this an industry or company where personal goodwill could be present?”
For the auto dealer industry, the principal product, outside of the service department, is a tangible product – new and used vehicles. In order for personal goodwill to be present in this industry, the owner/dealer principal would have to exhibit a unique set of skills that specifically translates to the heightened performance of their business.
We are all familiar with regional dealerships possessing the name of the owner/dealer principal in the name of the business. However, just having the name on a business doesn’t signify the presence of personal goodwill. An examination of the customer base would be needed to justify personal goodwill. It would be more difficult to argue that customers are purchasing vehicles from a particular dealership only for the name on the door, rather than the more obvious factors of brands offered, availability of inventory, convenience, etc. An extreme example might be having a recognized celebrity as the name/face of the dealership, but even then, it would be debated how materially that affects sales and success.
Auto dealers attempt to track performance and customer satisfaction through surveys, which could provide an avenue to determine this value (if, for example, factors that influenced the decision to buy listed Joe Dealer as being their primary motivation) though this is still unlikely and would be subject to debate.
Another consideration of the impact of a dealer’s name on the success/value of the business would be how actively involved the owner/dealer principal is and how directly have they been involved with the customer in the selling process. Simply put, there should be higher bars to clear than just having the name in the dealership for personal goodwill to be present. In more obvious examples of personal goodwill in professional practices, the customer usually interacts directly with the owner/professional such as with the attorney or doctor in our previous examples. How often does the customer of an auto dealership come into contact or deal directly with the owner/dealer principal, or do they generally engage with the salespeople, service manager, or the general manger?
Another factor that often helps identify the existence of personal goodwill is the presence of an employment agreement and/or non-compete agreement. The prevailing thought is that an owner of a business without these items would theoretically be able to exit the business and open a similar business and compete directly with the prior business. Neither of these items typically exist with an owner of an auto dealership. However, owners of auto dealerships must be approved as dealer principals by the manufacturer.
The transferability of a dealer principal relationship is not guaranteed, and certainly an existing dealer principal would not be able to obtain an additional franchise to directly compete with an existing franchise location of the same manufacturer for obvious area of responsibility (AOR) constraints. So, does the fact that most dealer principals don’t have an employment or non-compete agreement signify that personal goodwill must be present? Not necessarily. Again it relates back to the central questions of whether an owner/dealer principal is directly involved in the business, has a unique set of skills that contributed to a heightened success of the business, and does that owner/dealer principal have a direct impact on attracting customers to their particular dealership that could not be replicated by another individual.
Personal goodwill in an auto dealership, and in any industry, can become a contested item in a litigation case because it can reduce the enterprise value consideration, reduced by the amount allocated to personal goodwill. As much as the allocation, quantification, and methodology used to determine the amount of personal goodwill will come into question, several central questions should be examined and answered before simply jumping to the conclusion that personal goodwill exists.
Instead of arguing whether the value of an auto dealership should be reduced by some percentage, the real debate should center around the examination of whether personal goodwill exists in the first place. The difference in reports from valuation for experts in litigation matters generally falls within the examination and support of the assumptions (that lead to differences in conclusions). If present, personal goodwill for an auto dealership, or any company in any industry for that matter, must exist beyond just having the owner’s name in the title of the business.
Every year the American Transportation Research Institute (“ATRI”) publishes its report, Critical Issues in the Trucking Industry. A key piece of this annual report is a survey of key risk factors in the industry. While some of the risks of 2020 were not anticipated at the beginning of the year, some of the industry’s largest risk factors remain major concerns.
Driver shortages and driver compensation continue to be at the forefront of peoples’ minds. This year marks the fourth year that driver shortages have topped the list and over a quarter of survey participants marked it as one of their three largest concerns. While parts of the industry have been hit hard by COVID-19 (for example, automobile shippers or marine port logistics companies), freight demand continues to grow. The pool of available drivers – already pruned by rules changes and more stringent drug testing – shrunk further as COVID limited company’s abilities to hire and train more drivers. The American Trucking Association (“ATA”) estimated that the driver shortfall at over 60,000 drivers.
Driver compensation ranked as the second largest concern, up from the third largest in 2019. Driver compensation and driver shortages are closely linked – in order to encourage driver retention, companies are reconsidering base pay and benefits.
Truck parking first appeared on the top ten list in 2012. With just over 20% of respondents listing it as one of their top three concerns, truck parking availability reached its highest position yet. Once again, the COVID-19 pandemic underlies part of the issue – many states closed rest areas during the early stages of the pandemic. Lack of truck parking was a greater concern among owner-operators and independent contractors than among company drivers.
Compliance, safety, and accountability have been a top five concern for seven of the last ten years and has ranked in the top ten since 2010. The FMCSA has updated standards during its ten-year history, but transparency, details, and legal classifications continue to cause uncertainty and unrest in the industry.
The cost and availability of insurance ranked as the fifth highest concern. In a 2019 report, ATRI estimated that insurance costs per mile increased 12% between 2017 and 2018 and 5.6% on a compound annual basis since 2013. The impact of large court verdicts, increased vehicle values, and higher levels of traffic have all driven insurance prices up.
COVID-19 ranked 13th in the survey, although the impacts of the pandemic bleed through into other industry concerns. ATRI found that the COVID-19 pandemic tended to impact smaller carriers and owner-operators on a larger scale than bigger companies.
ATRI ultimately discusses the ten highest-ranked concerns in its report. The transportation and logistics industry continues to evolve as new risks and concerns rise in importance.
In this case, the parties raised the matter to appeals for two issues: 1) whether the trial court erred in awarding Wife alimony in futuro of $7,500 per month, and 2) whether Wife is entitled to attorney’s fees.
The parties divorced after a 13 year marriage in which the family was initially solely supported by Wife’s $40,000 annual income. However, at the time of divorce, Husband was earning approximately $850,000 per year and Wife was not employed but was a full-time student (due to frequent moves but also a mutual decision). The trial court found that long-term alimony was appropriate given Wife’s contribution to Husband’s earning capacity, her inability to achieve his earning capacity despite her efforts at education, and the parties’ relatively high standard of living during the marriage.
At the beginning of the marriage, the husband was a full-time medical student earning no income. Across the husband’s education and career, the parties moved from Georgia to Kentucky to Florida to Ohio, and finally to Jackson, Tennessee. During separation, Wife enrolled in a college to obtain a Bachelor’s Degree in Accounting and hoped to eventually enroll in a Master’s Degree program. Wife was a full-time student at the time of trial.
Husband testified that he planned to move to Florida and his base pay upon moving to Florida after the divorce would be approximately $450,000. Husband admitted, however, that this figure did not account for the bonuses that Husband had historically received and had caused his income to increase substantially. Wife’s sole income at the time of the divorce amounted to approximately $2,000 per year in dividends.
Each of the parties created a budget of estimated forward expenses. During proceedings, each party claimed that the other was controlling the parties’ finances, refusing to permit the other to fund basic expenses. With regard to expenses, Husband claimed as an expense $10,000 per month for savings in the event that he is sued for malpractice and his insurance does not cover the entire award, costs for his parents’ health insurance, considerable maintenance on his car, and large charitable contributions. With regard to Wife’s expenses, Husband contended that they were inflated over historical actual expenses. Husband testified that expenses incurred by Wife following the separation were for extravagant gifts to family that were not representative of the parties’ lifestyle throughout the marriage.
Demonstrating the marital estate and standard of living, the parties had accumulated a level of wealth during the marriage, including two cars, several retirement accounts, and savings accounts. Husband paid off the mortgage of their Jackson, Tennessee home during the pendency of the divorce. As such, the parties had no debt at the time of the divorce and considerable assets. During the marriage, the parties also took several vacations, both in the United States and outside the country.
The trial court made the following statement on the earnings capacity of each party:
Husband’s gross earning capacity is currently about $850,000 per year. His net income based on his effective tax rate for 2016 would be in the range of about $550,000. Husband owes no debt, and will have significant assets from the property division. Wife’s current income is zero essentially, but when she finishes school, if she is able to obtain employment in her field, and achieve a CPA designation, her gross income should be in the range of $55,000 according to testimony. If she pursues a Master’s Degree and achieves it, her earning capacity could increase to $85,000 per year. Thus, there is a significant difference between the Husband’s and Wife’s earning capacity. Their obligations are about the same.
The appellate court made the following conclusion on earnings capacity:
..the evidence does not clearly and convincingly show that Wife did not significantly contribute to Husband’s career and resulting earning capacity. Rather, the evidence supports the trial court’s finding that Wife made tangible and intangible contributions to the Husband’s increased earning capacity.
Considering the factors for spousal support unique to this matter, the trial court found that the alimony in futuro of $7,500 per month alimony was appropriate given: 1) Wife’s contribution to husband’s earning capacity, 2) Wife’s inability to achieve Husband’s earning capacity despite her efforts at education, and 3) the parties’ relatively high standard of living during the marriage. Discerning no reversible error, the appellate court affirmed the trial court in all respects. Also, given the considerable property awarded to Wife in the divorce, the appellate court declined to award attorney’s fees incurred on appeal in this case.
A financial expert witness can significantly assist in the court’s determination of divorcing parties’ ability and need to pay in its determinations for spousal support. The analysis is a complex matter and calls for the expertise and analysis of a financial expert. Refer to our piece, “What Is a Lifestyle Analysis and Why Is it Important?” for more information about the process, analysis, and support that can be provided by a financial expert.
Upon emerging from Chapter 11 bankruptcy, companies are required to apply the provisions of Accounting Standards Codification 852, Reorganizations. Under this treatment, referred to as “fresh start” accounting, companies exiting Chapter 11 are required to re-state assets and liabilities at fair value, as if the company were being acquired at a price equal to the reorganization value. As a result, two principal valuation-related questions are relevant for companies in bankruptcy:
When valuing identifiable intangible assets, we use valuation methods under the cost, income, and market approaches.
The cost approach seeks to measure the future benefits of ownership by quantifying the amount of money that would be required to replace the future service capability of the subject intangible asset. The assumption underlying the cost approach is that the cost to purchase or develop new property is commensurate with the economic value of the service that the property can provide during its life. The cost approach does not directly consider the economic benefits that can be achieved or the time period over which they might continue. It is an inherent assumption with this approach that economic benefits exist and are of sufficient amount and duration to justify the developmental expenditures.
Methods under the cost approach are frequently used to measure the fair value of assembled workforce, proprietary software, and other technology-related assets.
The market approach provides an indication of value by comparing the price at which similar property has been exchanged between willing buyers and sellers. When the market approach is used, an indication of value of a specific intangible asset can be gained from looking at the prices paid for comparable property.
Since there is rarely an active market for identifiable intangible assets apart from broader business combination transactions, valuation methods under the market approach are not commonly used to value identifiable intangible assets.
However, available market data, such as observed royalty rates in licensing transactions, is an important input in valuation methods under the income approach such as the relief-from-royalty method. Other market-derived data helps to inform estimates of the cost of capital and other valuation inputs, as well.
The income approach focuses on the capacity of the subject intangible asset to produce future economic benefits. The underlying theory is that the value of the subject property can be measured as the present worth of the net economic benefits to be received over the life of the intangible asset.
Using valuation methods under the income approach, we estimate future benefits expected to result from the subject asset and an appropriate rate at which to discount these expected benefits to the present. The most common valuation methods under the income approach are the relief from royalty method and multi-period excess earnings method, or MPEEM.
We often apply the MPEEM to measure the fair value of customer relationship and technology intangibles.
The valuation techniques for identifiable intangible assets are rooted in the fundamental elements of business valuation, cash flow and risk, under the cost, market, and income approaches. However, when valuing identifiable intangible assets, we use valuation methods adapted to the unique attributes of those assets.
Maybe not for the best of reasons, the stars have aligned for bank investors who have significant interests in banks to undertake robust estate planning this year.
Bank stock valuations are depressed as a result of the recession that developed from the COVID-19 policy responses, including a return to a zero interest rate policy (“ZIRP”) that is now known as the effective lower bound (“ELB”). The result is severe compression in net interest margins (“NIMs”), while the extent of credit losses will not be known until 2021 or perhaps even 2022.
As shown in Figure 1, bank stocks have produced a negative total return that ranges from -27% for the twelve months ended September 25, 2020 for the SNL Large Cap Bank Index to -36% for the SNL Mid Cap Bank Index. At the other extreme are tech stocks. The NASDAQ Composite has produced a one-year total return of 35%–a 70% spread between the two sectors.
Valuations for banks are depressed and are comparable to lows observed on March 24, 2020 when market panic and forced selling by levered investors peaked and March 9, 2009 when investors feared a possible nationalization of the large banks. Price-to-tangible book value (“P/TBV”) multiples are presented in Figure 2, while price-to-earnings (“P/E”) ratios based upon the last 12-month (“LTM”) earnings are presented in Figure 3. (Note—while P/TBV multiples are little changed from March 24, 2020, P/E ratios have increased because reserve building and reduced NIMs have reduced LTM earnings).
No one knows the future, but assuming reversion to the mean eventually occurs bank stocks could rally as earnings improve once credit costs decline even if NIMs remain depressed, resulting in higher earnings and multiple expansion. Relative to ten-year average multiples based upon daily observations, banks are 30-40% cheap to their post-Great Financial Crisis trading history.
In effect, current gifting and other estate planning could lock in significant tax benefits assuming a Japan and Europe scenario does not develop in the U.S. where banks are “re-rated” and underperform for decades.
A second reason to consider significant estate planning transactions this year is the potential change in Washington if 2021 sees a Biden Administration backstopped with a Democrat-controlled Senate and House.
Vice President Biden’s proposed estate tax changes include the elimination of basis step-up, significant reductions to the unified credit (the amount of wealth that passes tax-free from estate to beneficiary) and gift tax exemption, and increasing current capital gains tax rates to ordinary income levels for high earning households. The cumulative effect of these changes is a substantial increase in high net worth clients’ estate tax liabilities if Biden’s current proposals become law.
Basis step-up is a subtle but important feature of tax law. Unusual among industrialized nations, in the United States the assets in an estate pass to heirs at a tax value established at death (or at an alternate valuation date). Even though no tax is collected on the first $11.6 million per person, the tax basis for the heir is “stepped-up” to the new value established at death. Other countries handle this issue differently, and Biden favors eliminating the step-up in tax basis. Further, he prefers taxing the embedded capital gain at death. Canada, for example, does this – treating a bequest as any other transfer and assessing capital gains taxes to the estate of the decedent.
Fortunately, there are several things bank shareholders can do now to minimize exposure to these potential tax law changes. Taking advantage of the current high-level of gift tax exemptions ($11.58 million per individual or $23.16 million per married couple) could save millions in taxes if Biden’s proposed lower exemption of $3.5 million per individual becomes law.
Other options include the formation of trusts or asset holding entities to transfer wealth to the next generation in a tax-efficient manner. Proper estate planning can mitigate the adverse effects of higher taxes on wealth transfers, but the window to do so may be closing if we have a regime change later this year.
Further, the demand (and associated cost) for estate planning services may go up significantly in November, so you need to apprise your clients of these potential changes before it’s too late.
In the 1990s, the unified credit (the amount of wealth that passes tax-free from estate to beneficiary) was only $650 thousand, or $1.3 million for a married couple. The unified credit was not indexed for inflation, and the threshold for owing taxes was so low that many families we now consider “mass-affluent” engaged in sophisticated estate tax planning techniques to minimize their liability.
Then in 2000, George W. Bush was elected President, and estate taxes were to be phased out. Over the past decade, the law has changed several times, but mostly to the benefit of wealthier estates. That $650 thousand exemption from estate taxes is now $11.6 million. A married couple would need a net worth of almost $25 million before owing any estate tax, such that now only a sliver of bank stock investors require heavy duty tax planning.
That may all be about to change.
Vice President Biden has more than gestured that he plans to increase estate taxes by lowering the unified credit, raising rates, and potentially eliminating the step-up in basis that has long been a feature of tax law in the United States.
Talk is cheap. But investors take heed; now may be the time to execute rather than plan.
Originally appeared in Mercer Capital’s Bank Watch, September 2020.
Bank stocks rallied in the first few weeks of November 2020 as the market’s Thanksgiving dinner came early, and it digested several issues including positive news on the COVID-19 vaccine candidates. While significant uncertainty still exists on credit conditions, COVID-19, and the economic outlook, bank valuations and earnings expectations also benefitted from the yield curve steepening as evidenced by the 10-year Treasury moving up from ~50 bps in early August to ~85 bps in mid-November.
Despite the recent rise in bank stock pricing, bank stock valuations are still depressed relative to pre-COVID levels as a result of the recession that developed from the pandemic and ensuing policy responses. A primary headwind for banks is the potential compression in net interest margins (“NIMs”) following a return to a zero interest rate policy (“ZIRP”) that is now known as the effective lower bound (“ELB”). Additionally, credit risk remains heightened for the sector compared to pre-pandemic levels as the extent of credit losses resulting from the pandemic and economic slowdown will not be known until 2021 or perhaps even 2022.
Amidst this backdrop, many banks and their directors are evaluating strategic options and ways to create value for shareholders. While the Federal Reserve has prohibited the largest U.S. banks from share repurchases, the current environment has prompted many community banks to announce share buyback plans. According to S&P Global Market Intelligence, more than forty U.S. community banks announced buyback plans in the third quarter and the trend has continued in the fourth quarter with another 36 buyback announcements, including new plans, extensions of existing plans, and reinstatements of previously suspended plans, in October. In our view, there are four primary reasons that many community and regional banks are announcing or expanding share repurchase programs in the current environment.
Since the onset of the COVID-19 pandemic, the banking sector has underperformed the broader market due to concerns on credit quality and a prolonged low-interest rate environment. Despite the November rally, bank stocks are still trading at lower multiples than observed in recent years. Furthermore, many banks are finding themselves with excess liquidity in light of weaker loan demand and growing deposits.
In a depressed price environment, share repurchases can be a favorable use of capital, particularly when pricing is at a discount to book value and is accretive to book value per share. As shown in the chart below, the average P/TBV multiple has declined for all of the SNL market capitalization bank indices since the beginning of 2020. The decline has been most pronounced for the Micro Cap index, with the average P/TBV multiple for banks with a total market capitalization of less than $250 million falling from 133% to 102%.
Capital gains tax rates are low relative to historical levels and the potential for higher capital gains tax rates has risen under President-elect Biden. As part of his tax plan, Biden has proposed increasing the top tax rate for capital gains for the highest earners from 23.8% to 39.6% (akin to ordinary income levels), which would be the largest increase in capital gains rates in history. While the ability for Biden’s tax plan to become reality is uncertain, many community banks have an aging shareholder base with long-term capital gains and it is an issue worth watching and planning for as poor planning can leave significant tax consequences for the shareholder or his or her heirs. A share repurchase program can provide liquidity to shareholders who may be apt to take advantage of the current capital gains rates that are low by historical standards and lower than the rates proposed by President-elect Biden.
Despite the unique issues brought about by the pandemic and the uncertain economic outlook, many community banks are well capitalized and have “excess” capital at the bank level and perhaps even an unleveraged holding company. We have written previously about the idea of robust stress testing and capital planning given the economic environment but note that a recent survey indicated that most bankers believe capital levels are sufficient to weather the economic downturn. Our research also indicates that rates on subordinated debt issuances issued in September of 2020 averaged ~5% compared to ~6% average for 2018 and 2019. These lower borrowing costs and ample capital for many banks in combination with lower share prices enhance the potential internal rate of return for share repurchases when compared to other strategic alternative uses of capital.
Board members and management teams face the strategic decision of allocating capital in a way that creates value for shareholders. Potential options include growing the balance sheet organically or through acquisition (perhaps a whole bank or branch), payment of dividends, or a stock repurchase program. While M&A has been a constant theme, activity has slowed during the COVID-19 pandemic and Bank Director’s 2021 Bank M&A Survey noted that only ~33% say their institution is likely to purchase a bank by the end of 2021, which was down from the prior year’s survey (at ~44%). Key challenges to M&A in the current environment include conducting due diligence and evaluating a seller’s loan portfolio in light of COVID-19 impacts and economic uncertainty.
Organic loan growth expectations have also been muted for many banks in light of the economic slowdown resulting from COVID-19. With organic and acquisitive balance sheet growth appearing less attractive for many banks in the current environment, dividends and share repurchases have climbed up the strategic option list for many banks. A share repurchase program can have the added benefit of enhancing liquidity and marketability of illiquid shares, which potentially enhances the valuation of a minority interest in the bank’s stock.
If your bank’s board does implement a share repurchase program, it is critical for the board to set the purchase price based upon a reasonable valuation of the shares. While ~5,000 banks exist, the industry is very diverse and differences exist in financial performance, risk appetite, growth trajectory, and future performance/outlook in light of the shifting landscape. Valuations should understand the common issues faced by all banks – such as the interest rate environment, credit risk, or technological trends – but also the entity-specific factors bearing on financial performance, risk, and growth that lead to the differentiation in value observed in both the public and M&A markets.
At Mercer Capital, valuations are more than a mere quantitative exercise. Integrating a bank’s growth prospects and risk characteristics into a valuation analysis requires understanding the bank’s history, business plans, market opportunities, response to emerging technological issues, staff experience, and the like.
For those banks considering a share repurchase program, Mercer Capital has the experience to provide an independent valuation of the stock that can serve to assist the Board in setting the purchase price for the share repurchase program.
Originally appeared in Mercer Capital’s Bank Watch, November 2020.
Estate and tax planning matters are an important component of the overall financial plan for many RIA clients. The current tax policy and market environment create unique estate planning opportunities that may not last if economic conditions normalize or if Biden wins in November. This webinar addresses the available opportunities that RIA principals and advisors should be aware of in the current environment.
Original air date: October 28, 2020