Navigating Tax Returns: Tips and Key Focus Areas for Family Law Attorneys and Divorcing Individuals/Business Owners – Part II
Part II of III- Schedule A (Form 1040) Itemized Deductions
This is the second of the three-part series where we focus on the key areas of tax returns to assist family lawyers and divorcing parties. Part II concentrates on Schedule A (Form 1040) Itemized Deductions. Part I discussed Form 1040 and can be found here.
Schedule A (Form 1040) Itemized Deductions is an attachment to Form 1040 for taxpayers who choose to itemize their tax-deductible expenses rather than take the standard deduction.
Why Would Schedule A (Form 1040) Itemized Deductions Be Important In Divorce Proceedings?
Schedule A provides information regarding marital property – assets and debts – and may reveal information about the taxpayer’s lifestyle and financial position. Reviewing the detailed information can potentially lead to further investigation such as uncovering dissipation of assets, discovering hidden assets, or providing an overview of true historical spending.
Taxpayers have the option on Line 12 of Form 1040 to elect the standard deduction or the itemized deductions from Schedule A. At the time of publication of this article, the standard deduction ranges from $12,400-$24,800 depending on the selected filing status of the taxpayer(s). Both deductions reduce the amount of Taxable Income on Line 15 on Form 1040. If the taxpayer’s qualified itemized deductions are greater than their standard deduction, the taxpayer typically forgoes the standard deduction and files Schedule A with Form 1040. For divorce purposes, reviewing the taxpayer’s elections over a historical period may also provide further insight into the financial snapshot of the estate over time.
Key Areas of Focus for Family Law Attorneys and Divorcing Parties
Lines 5b and 5c: State & Local Real Estate Taxes, State & Local Property Taxes – Entries on Lines 5b and/or 5c show taxes paid on property. Line 5b focuses on state and local taxes paid on real estate owned by the taxpayer(s) that were not used for business, while Line 5c concentrates on state and local personal property taxes paid on a yearly basis based on the value of the asset alone.
If these lines are filled, it should lead to further questioning about what these properties are and if they are marital property. The amount of tax paid could also give insight into the taxpayer’s assets. Greater state and local real estate taxes entered on Line 5b usually indicate more expensive real estate. Similarly, a larger entry in Line 5c representing taxes on personal property indicate high-priced assets, such as an expensive car.

Line 8: Home Mortgage Interest – A home mortgage represents any loan that is secured by the taxpayer’s main home or second home. A “home” can be a house, condominium, mobile home, boat, or similar property as long as it provides the basic living accommodations. The rules for deducting interest vary, depending on whether the loan proceeds are used for business, personal, or investment activities. The deduction for home mortgage interest depends on factors such as the date of the mortgage, the amount of the mortgage, and how the mortgage proceeds are used.
An entry in Lines 8a-e indicates the taxpayer(s) has a home mortgage loan and documentation of the loan should be requested. This line is an indication of property ownership, and therefore, a potential marital asset (or separate asset if that scenario is applicable). Form 1098, the Mortgage Interest Statement, will provide more detailed information.

Line 14: Gifts to Charity – A charitable contribution is a donation or gift made voluntarily to, or for the use of, a qualified organization without expecting to receive anything of equal value. Qualified organizations include but are not limited to nonprofit groups that are religious, charitable, or educational.
Sometimes we see charitable giving allocated as a line item in a divorcing individual’s future budget. While this may not necessarily be an expense necessary for traditional living expenses, if, historically, the parties donated significant monies, this can be captured on historical charitable donation deductions and ought to be evaluated on a case-by-case basis. As a tip, sometimes these gifts may be captured elsewhere than a personal tax return, such as a trust’s estate tax return.

Line 16: Other Itemized Deductions – Only certain expenses qualify to be deducted as other itemized deductions including gambling losses, casualty and theft losses, among others. If there is an entry in Line 16, more detailed information on these deductions may be necessary.
A common “other itemized deduction” is for gambling losses, which may lead to further questioning and could potentially be dissipation of marital assets. Another example is the federal estate tax on income in respect of a decedent. Income in respect of a decedent (IRD) is income that was owed to a decedent at the time he or she died. Examples of IRD include retirement plan assets, IRA distributions, unpaid interest, dividends, and salary, to name only a few.
Along with other estate assets, IRD is eventually distributed to the beneficiaries. While most assets of the estate are transferred free of income tax, IRD assets are generally taxed at the beneficiaries’ ordinary income tax rates. However, if a decedent’s estate has paid federal estate taxes on the IRD assets, the beneficiary may be eligible for an IRD tax deduction based on the amount of estate tax paid. This is an example of a potential separate asset, however, the IRD could also be a marital asset depending on the beneficiary designation and/or potential commingling of assets.
Items included within other itemized deductions should typically be reviewed and potentially further investigated as they may represent assets, liabilities, and/or sources of income, whether marital or separate.

Conclusion
Understanding how to navigate key areas of Schedule A (Form 1040) can be very helpful in divorce proceedings. Information within Schedule A can provide support for marital assets and liabilities, sources of income and potential further analyses. Reviewing multiple years of tax returns and accompanying supplemental schedules may provide helpful information on trends and/or changes and could indicate the need for potential forensic investigations.
Mercer Capital is a national business valuation and financial advisory firm. While we do not provide tax advice, we have expertise in the areas of financial, valuation, and forensic services.
Value Drivers in Flux
Last July I gave a presentation to the third-year students attending the Consumer Bankers Association’s Executive Banking School. The presentation, which can be found here, touched on three big valuation themes for bank investors: estimate revisions, earning power and long-term growth.
Although Wall Street is overly focused on the quarterly earnings process, investors care because of what quarterly results imply about earnings (or cash flow) estimates for the next year and more generally about a company’s earning power. Earning beats that are based upon fundamentals of faster revenue growth and/or positive operating leverage usually will result in rising estimates and an increase in the share price. The opposite is true, too.
For U.S. banks that have largely finished reporting third quarter results, questions about all three—especially earning power—are in flux more than usual. Industry profitability has always been cyclical, but what is normal depends. Since the early 1980s, there have been fewer recessions that have resulted in long periods of low credit costs. Monetary policy has been radical since 2008. What’s normal was also distorted in 2020 and 2021 by PPP income that padded earnings but will evaporate in 2023.
Most banks beat consensus EPS estimates, largely due to negligible credit costs if not negative loan loss provisions as COVID-19 related reserve builds that occurred in 2020 proved to be too much; however, there was no new news with the earnings release as it relates to credit.
Investors concluded with the release of third and fourth quarter 2020 results that credit losses would not be outsized. Overlaid was confirmation from the corporate bond market as spreads on high yield bonds, CLOs and other structured products began to narrow in the second quarter of 2020 as banks were still building reserves.
As of October 28, 2020, the NASDAQ Bank Index has risen 78% over the past year and 39% year-to-date.
Much of that gain occurred during November (October 2020 was a strong month, too) through May as investors initially priced-in reserve releases to come; and then NIMs that might not fall as far as feared as the yield on the 10-year UST doubled to 1.75% by late March. Bank stocks underperformed the market during the summer as the 10-year UST yield fell. Since late September banks rallied again as investors began to price rate hikes by the Fed beginning in 2022 rather than 2023.
No one knows for sure; the future is always uncertain. For banks, two key variables have an outsized influence on earnings other than credit costs: loan demand and rates. In other industries the variables are called volume and price. If both rise, most banks will see a pronounced increase in earnings as revenues rise and presumably operating leverage improves. Street estimates for 2022 and 2023 will rise, and investors’ view of earning power will too.
We do not know what the future will be either. Loan demand and excess liquidity have been counter cyclical forces in the banking industry since banks came into being. The question is not if but how strong loan demand will be when the cycle turns. Interest rates used to be cyclical, too, until governments became so indebted that “normal” rates apparently cannot be tolerated.
Nonetheless, at Mercer Capital we have decades of experience of evaluating earnings, earning power, multiples and other value drivers. Please give us a call if we can assist your institution.
Meet the Team – Karolina Calhoun, CPA/ABV/CFF
In each “Meet the Team” segment, we highlight a different professional on our Family Law team. The experience and expertise of our professionals allow us to bring a full suite of valuation and forensics services to our clients. We hope you enjoy getting to know us a bit better.

Tell us a little about your career and what influenced your “return” to Mercer Capital.
Karolina Calhoun: During my college experience at Rhodes College, I interned at Mercer Capital, Morgan Keegan (now known as Raymond James) in investment banking and then another internship in wealth management, and ALSAC/St. Jude Children’s Research Hospital. I also interned internationally with Ernst and Young (EY) in Warsaw, Poland, which is where I was born and have many family members that still live there.
After graduating from Rhodes College, I completed my Master of Accountancy and CPA accreditation. I started working for EY in their Audit and Assurances department. During my 3+ years at EY, I had the opportunity to work with Fortune 500 clients, as well as other sized companies in diverse industries such as chemical and agriculture, logistics, medical devices, healthcare, and wealth management and investment management. At the time that I came back to Mercer Capital, I was ready to take my public accounting knowledge and experience and pivot to finance-related client work.
How does your Big 4 public accounting background assist you and your clients in a litigation matter?
Karolina Calhoun: The knowledge of accounting and financial reporting is important. It helps me quickly understand the financial statements of businesses, personal financial statements, and tax returns, among other financial documents. My auditing experience was investigative in a sense, so I have a good idea of what to look for and other red flags. Additionally, from a client perspective, individuals and attorneys tend to trust a CPA’s professional expertise in litigation cases, especially in specialized areas like valuation and forensics. My additional credentials, the ABV and CFF, further bolster the expertise I can offer clients.
You’re involved with the AICPA Forensics & Valuation Services Section. Can you tell us more about this organization and your involvement?
Karolina Calhoun: I am so thankful for the national and global opportunities/positions I hold now with the American Institute of Certified Public Accountants (AICPA). I am serving as the Valuation Chair of the AICPA Forensic and Valuation Services (FVS) Conference and I also serve on the CFF Exam Task Force. My committee and task force positions have provided me the opportunities to be involved with thought leaders across the globe and assist our evolving profession. During my tenure so far, I have met and collaborated with many colleagues from all over the United States and beyond North America.
I became involved with the AICPA FVS Section at an early point in my career at Mercer Capital. I attended the NextGen training program, which is catered towards rising leaders in the FVS profession. After meeting and networking with AICPA staff and volunteers, I applied to be considered for future volunteer opportunities. I was so excited when I was invited to join the AICPA Forensics & Valuation Services Conference Planning Committee. Then, in 2019 I was asked to be the 2020 & 2021 Valuation Chair. In this position, I am integral in leading the Committee’s efforts in planning our annual conference, selecting topics, inviting speakers, and collaborating with the AICPA staff & speakers.
In my role on the CFF Exam Task Force, I am contributing to the efforts to pivot the CFF (Certified in Financial Forensics) accreditation towards a universal body of knowledge and examination process. Our committee evaluated the existing test bank of questions and rewrote and wrote new questions to comply with our global framework. As I mentioned earlier, I was born in Poland and interned abroad, so I love being a part of this global initiative as our profession continues to evolve.
How meaningful is it for the Litigation Services Group to offer both valuation & forensic services?
Karolina Calhoun: During my tenure at Mercer Capital, as a CPA with an interest in finance, valuation, and forensic accounting, I have helped establish the Litigation Services Group at Mercer Capital. We have extended our services beyond valuation and financial consulting to also encompass forensic services. I think it is very valuable to be able to provide a full suite of services as oftentimes, valuation and forensic services are interconnected.
Take a divorce litigation for example. Historically, Mercer Capital would be called for the valuation of a business, and an external forensic accountant would provide the lifestyle analysis and other forensic needs. However, now Mercer Capital can assist with both the valuation and forensic scope of that divorce engagement. Extending beyond divorce litigation, our team provides valuation, forensic accounting, and financial consulting for a variety of engagements: business damages, lost profits, shareholder disputes, breach of contract, trademark infringement, and estate and tax planning, among others.
What drew you to financial forensics and in what ways are Mercer Capital professionals skilled for these types of litigation matters?
Karolina Calhoun: I enjoy the combination of accounting, economics, finance, and forensics. Litigation services is a field where we have to put all of these skills together and evaluate the facts and circumstances unique to the particular matter(s) at hand – no fact pattern is ever the same. Our Litigation Services Group at Mercer Capital is comprised of qualified professionals who have the necessary skills and experience in accounting, finance, and economics and in a wide variety of industries and types of matters.
Fairness Opinions – Evaluating a Buyer’s Shares from the Seller’s Perspective
Depository M&A activity in the U.S. has accelerated in 2021 from a very subdued pace in 2020 when uncertainty about the impact of COVID-19 and the policy responses to it weighed on bank stocks. At the time, investors were grappling with questions related to how high credit losses would be and how far would net interest margins decline. Since then, credit concerns have faded with only a nominal increase in losses for many banks. The margin outlook remains problematic because it appears unlikely the Fed will abandon its zero-interest rate policy (“ZIRP”) anytime soon.
As of September 23, 2021, 157 bank and thrift acquisitions have been announced, which equates to 3.0% of the number of charters as of January 1. Assuming bank stocks are steady or trend higher, we expect 200 to 225 acquisitions this year, equivalent to about 4% of the industry and in-line with 3% to 5% of the industry that is acquired in a typical year. During 2020, only 117 acquisitions representing 2.2% of the industry were announced, less than half of the 272 deals (5.0%) announced in pre-covid 2019.
To be clear, M&A activity follows the public market, as shown in Figure 1. When public market valuations improve, M&A activity and multiples have a propensity to increase as the valuation of the buyers’ shares trend higher. When bank stocks are depressed for whatever reason, acquisition activity usually falls, and multiples decline.
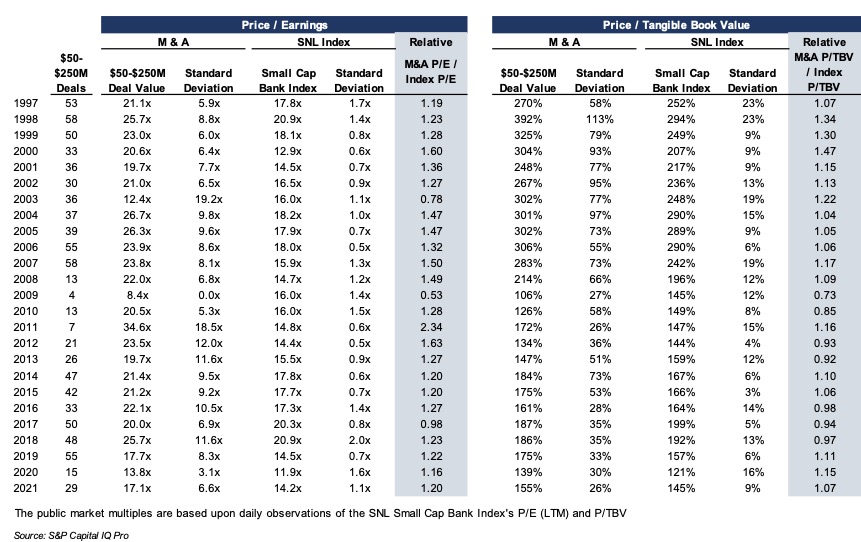
Click here to expand the image above
The rebound in M&A activity this year did not occur in a vacuum. Year-to-date through September 23, 2021, the S&P Small Cap and Large Cap Bank Indices have risen 25% and 31% compared to 18% for the S&P 500. Over the past year, the bank indices are up 87% and 79% compared to 37% for the S&P 500.
Excluding small transactions, the issuance of common shares by bank acquirers usually is the dominant form of consideration sellers receive. While buyers have some flexibility regarding the number of shares issued and the mix of stock and cash, buyers are limited in the amount of dilution in tangible book value they are willing to accept and require visibility in EPS accretion over the next several years to recapture the dilution.
Because the number of shares will be relatively fixed, the value of a transaction and the multiples the seller hopes to realize is a function of the buyer’s valuation. High multiple stocks can be viewed as strong acquisition currencies for acquisitive companies because fewer shares are issued to achieve a targeted dollar value.
However, high multiple stocks may represent an under-appreciated risk to sellers who receive the shares as consideration. Accepting the buyer’s stock raises a number of questions, most which fall into the genre of: what are the investment merits of the buyer’s shares? The answer may not be obvious even when the buyer’s shares are actively traded.
Our experience is that some, if not most, members of a board weighing an acquisition proposal do not have the background to thoroughly evaluate the buyer’s shares. Even when financial advisors are involved, there still may not be a thorough vetting of the buyer’s shares because there is too much focus on “price” instead of, or in addition to “value.”
A fairness opinion is more than a three or four page letter that opines as to the fairness from a financial point of a contemplated transaction; it should be backed by a robust analysis of all of the relevant factors considered in rendering the opinion, including an evaluation of the shares to be issued to the selling company’s shareholders. The intent is not to express an opinion about where the shares may trade in the future, but rather to evaluate the investment merits of the shares before and after a transaction is consummated.
Key questions to ask about the buyer’s shares include the following:
Liquidity of the Shares – What is the capacity to sell the shares issued in the merger? SEC registration and NASADQ and NYSE listings do not guarantee that large blocks can be liquidated efficiently. OTC traded shares should be scrutinized, especially if the acquirer is not an SEC registrant. Generally, the higher the institutional ownership, the better the liquidity. Also, liquidity may improve with an acquisition if the number of shares outstanding and shareholders increase sufficiently.
Profitability and Revenue Trends – The analysis should consider the buyer’s historical growth and projected growth in revenues, pretax pre-provision operating income and net income as well as various profitability ratios before and after consideration of credit costs. The quality of earnings and a comparison of core vs. reported earnings over a multi-year period should be evaluated. This is particularly important because many banks’ earnings in 2020 and 2021 have been supported by mortgage banking and PPP fees.
Pro Forma Impact – The analysis should consider the impact of a proposed transaction on the pro forma balance sheet, income statement and capital ratios in addition to dilution or accretion in earnings per share and tangible book value per share both from the seller’s and buyer’s perspective.
Tangible BVPS Earn-Back – As noted, the projected earn-back period in tangible book value per share is an important consideration for the buyer. In the aftermath of the GFC, an acceptable earn back period was on the order of three to five years; today, two to three years may be the required earn-back period absent other compelling factors. Earn-back periods that are viewed as too long by market participants is one reason buyers’ shares can be heavily sold when a deal is announced that otherwise may be compelling.
Dividends – In a yield starved world, dividend paying stocks have greater attraction than in past years. Sellers should not be overly swayed by the pick-up in dividends from swapping into the buyer’s shares; however, multiple studies have demonstrated that a sizable portion of an investor’s return comes from dividends over long periods of time. Sellers should examine the sustainability of current dividends and the prospect for increases (or decreases). Also, if the dividend yield is notably above the peer average, the seller should ask why? Is it payout related, or are the shares depressed?
Capital and the Parent Capital Stack – Sellers should have a full understanding of the buyer’s pro-forma regulatory capital ratios both at the bank-level and on a consolidated basis (for large bank holding companies). Separately, parent company capital stacks often are overlooked because of the emphasis placed on capital ratios and the combined bank-parent financial statements. Sellers should have a complete understanding of a parent company’s capital structure and the amount of bank earnings that must be paid to the parent company for debt service and shareholder dividends.
Loan Portfolio Concentrations – Sellers should understand concentrations in the buyer’s loan portfolio, outsized hold positions, and a review the source of historical and expected losses.
Ability to Raise Cash to Close – What is the source of funds for the buyer to fund the cash portion of consideration? If the buyer has to go to market to issue equity and/or debt, what is the contingency plan if unfavorable market conditions preclude floating an issue?
Consensus Analyst Estimates – If the buyer is publicly traded and has analyst coverage, consideration should be given to Street expectations vs. what the diligence process determines. If Street expectations are too high, then the shares may be vulnerable once investors reassess their earnings and growth expectations.
Valuation – Like profitability, valuation of the buyer’s shares should be judged relative to its history and a peer group presently and relative to a peer group through time to examine how investors’ views of the shares may have evolved through market and profit cycles.
Share Performance – Sellers should understand the source of the buyer’s shares performance over several multi-year holding periods. For example, if the shares have significantly outperformed an index over a given holding period, is it because earnings growth accelerated? Or, is it because the shares were depressed at the beginning of the measurement period? Likewise, underperformance may signal disappointing earnings, or it may reflect a starting point valuation that was unusually high.
Strategic Position – Assuming an acquisition is material for the buyer, directors of the selling board should consider the strategic position of the buyer, asking such questions about the attractiveness of the pro forma company to other acquirers?
Contingent Liabilities – Contingent liabilities are a standard item on the due diligence punch list for a buyer. Sellers should evaluate contingent liabilities too.
The list does not encompass every question that should be asked as part of the fairness analysis, but it does illustrate that a liquid market for a buyer’s shares does not necessarily answer questions about value, growth potential and risk profile. The professionals at Mercer Capital have extensive experience in valuing and evaluating the shares (and debt) of financial and non-financial service companies garnered from over three decades of business. Give us a call to discuss your needs in confidence.
Three Considerations Before You Sell Your Business
After spending years, if not decades, building your business through hard work, determination, and a little luck, what happens when you are ready to monetize your efforts by selling part or all of your business? Exiting the business you built from the ground up is often a bittersweet experience. Many business owners focus their efforts on growing their business and push planning for their eventual exit aside until it can’t be ignored any longer. However, long before your eventual exit, you should begin planning for the day you will leave the business you built.
We suggest you consider these three things.
1. Have a Reasonable Expectation of Value
Many business owners have difficulty taking an objective view of the value of their company. In many cases, it becomes a highly emotional issue, which is certainly understandable considering that many business owners have spent most of their adult lives operating and growing their companies. Nevertheless, the development of reasonable pricing expectations is a vital starting point on the road to a successful transaction.
The development of pricing expectations for an external sale should consider how a potential acquirer would analyze your company. In developing offers, potential acquirers can (and do) use various methods to develop a reasonable purchase price. An acquirer will utilize historical performance data, along with expectations for the future, to develop a level of cash flow or earnings that is considered sustainable going forward. In most cases, this analysis will focus on earnings before interest, taxes, depreciation and amortization (EBITDA) or some other pre-interest cash flow. A multiple is applied to this sustainable cash flow to provide an indication of value for the company. Multiples are developed based on an assessment of the underlying risk and growth factors of the subject company.
Valuations and financial analysis for transactions encompass a refined and scenario-specific framework. The valuation process should enhance a buyer’s understanding of the cash flows and corresponding returns that result from purchasing or investing in a firm. For sellers or prospective sellers, valuations and exit scenarios can be modeled to assist in the decision to sell now or later and to assess the adequacy of deal consideration. Setting expectations and/or defining deal limitations are critical to good transaction discipline.
2. Consider the Tax Implications
When analyzing the net proceeds from a transaction, you must consider the potential tax implications. From simple concepts such as ordinary income vs. capital gains and asset sales vs. stock sales, to more nuanced concepts such as depreciation recapture and purchase price allocation, there are almost unlimited issues that can come up related to the taxation of transaction proceeds. The structure of your own corporate entity (C Corporation vs. tax-pass through entity) may have a material impact on the level of taxes owed from a potential transaction.
We recommend consulting with your outside accountant (or hiring a tax attorney) early in the process of investigating a transaction. Only a tax specialist can provide the detailed advice that is needed regarding the tax implications of different transaction structures. There could be strategies that can be implemented well in advance of a transaction to better position your business or business interest for an eventual transaction.
3. Have a Real Reason to Sell Your Business
Strategy is often discussed as something belonging exclusively to buyers in a transaction. Not true.
Sellers need a strategy as well: what’s in it for you? Sellers often feel like all they are getting is an accelerated payout of what they would have earned anyway while giving up their ownership. In many cases, that’s exactly right! Your Company, and the cash flow that creates value, transfers from seller to buyer when the ink dries on the purchase agreement. Sellers give up something equally valuable in exchange for purchase consideration – that’s how it works.
As a consequence, sellers need a real reason – a non-financial strategic reason – to sell. Maybe you are selling because you want or need to retire. Maybe you are selling because you want to consolidate with a larger organization, or need to bring in a financial partner to diversify your own net worth and provide ownership transition to the next generation. Whatever the case, you need a real reason to sell other than trading future compensation for a check. The financial trade won’t be enough to sustain you through the twists and turns of a transaction.
The process of selling a business is typically one of the most important, and potentially complex, events in an individual’s life. Important decisions such as this are best made after a thorough consideration of the entire situation. Early planning can often be the difference between an efficient, controlled sales process and a rushed, chaotic process.
Mercer Capital provides transaction advisory services to a broad range of public and private companies and financial institutions. We have assisted hundreds of companies with planning and executing potential transactions since Mercer Capital was founded in 1982. Rather than pushing solely for the execution of any transaction, Mercer Capital positions itself as an advisor, encouraging the right decision to be made by its clients.
Our dedicated and responsive team is available to advise you through a transaction process, from initial planning and investigation through eventual execution. To discuss your situation in confidence, give us a call.
Valuations for Gift & Estate Tax Planning
Managing Complicated Multi-Tiered Entity Valuation Engagements
When equity markets fell in early 2020 due to the onset of the COVID-19 global pandemic, many business owners and tax planners contemplated whether it was an opportune time to engage in significant ownership transfers. Although equity markets have recovered to all-time highs, a confluence of three factors may make 2021 an ideal time for estate planning transactions for owners of private companies:
- Depressed Valuations. Valuations for many privately held businesses remain somewhat depressed due to significant supply chain challenges and hiring difficulties.
- Low Interest Rates. Applicable federal rates (AFRs) are at historically low levels, allowing business owners to make leveraged estate planning strategies more efficient.
- Political Risk. The Biden administration’s proposal to lower the gift and estate tax exemption and increase the capital gains tax rate may prompt some individuals and businesses to take advantage of currently favorable tax conditions before any adverse changes are made.
Mercer Capital has been performing valuations for complicated tax engagements since its inception in 1982. For many high net worth individuals and family offices, complex ownership structures have evolved over time, typically involving multi-tiered entity organizations and businesses with complicated ownership structures and governance. In this article, we describe the processes that lead to credible and timely valuation reports. These processes contribute to smoother engagements and better outcomes for clients.
Defining the Engagement
Defining the valuation project is an important step in every engagement process, but when multiple or tiered entities are involved, it becomes critical. It is insufficient to define a complicated engagement by referring only to the top tier entity in a multi-tiered organizational structure. The engagement scope should clearly identify all the direct and indirect ownership interests that will need to be valued. This allows the appraiser to plan the underlying due diligence and analytical framework to design the deliverable work product.
For example, will the appraiser need to perform a separate appraisal at each level of a tiered structure? Or, can certain entities or underlying assets be valued using a consolidated analytical framework? Planning well on the front end of an engagement leads to more straightforward analyses that are easier to defend.
Collecting the Necessary Information
During the initial discussion of the engagement, the appraiser will usually request certain descriptive and financial information (such as governing documents, recent audits, compilations, and/or tax returns) to determine the scope of analysis needed to render a credible appraisal for the master, top-tier entity and the underlying entities and assets.
Upon being retained, one of the first things an appraiser will do is to prepare a more comprehensive information request list designed to solicit all the documentation necessary to render a valuation opinion. Full and complete disclosure of all requested information, as well as other information believed pertinent to the appraisal, will aid the appraiser in preventing double-counting or otherwise missing assets all together.
Information Needed for Complex Multi-Tiered Entity Valuation
Requested information for complex multi-tiered entity valuations typically falls into three
broad categories:
- Legal documentation. The legal structure and inter-relationships in complex assignments are essential to deriving reliable valuation conclusions. In addition to the operating agreements, it is important to have current shareholder/member lists. A graphical organization chart is often a very helpful supplement to the legal documents and helps ensure that everyone really is “on the same page” regarding the objectives of the valuation assignment.
- Financial statements. A careful review of the historical financial statements for each entity in the overall structure provides essential context for the cash flow projections, growth outlook, and risk assessment that are the basic building blocks for any valuation assignment. Depending on ownership characteristics and business attributes, it may be appropriate to combine financial statements for multiple entities to promote efficiency in project execution.
- Supplementary information. For operating businesses, supplementary information may include financial projections, detailed revenue and margin data (by customer, product, region or some other basis), personnel information, and/or information pertaining to the competitive environment. For asset-holding entities, supplementary data may include current appraisals of real estate or other illiquid underlying assets, brokerage statements, and the like.
The ultimate efficiency of the project often hinges on timely receipt of all requested information. Disorganized information or data that requires a lot of handling or interpretation on the part of the appraiser adds to project cost, and more importantly, can make it harder to defend valuation conclusions that are later subject to scrutiny.
In short, providing high quality information in response to the appraiser’s request list promotes a more predicable outcome with the IRS and with other stakeholders.
The Importance of Reviewing the Draft Appraisal
Upon completing research, due diligence interviews with appropriate parties, and the valuation analysis, the appraiser should provide a draft appraisal report for review. The steps discussed thus far – careful planning and timely information collection – are not substitutes for careful review of the draft appraisal report. The complexity of many multi-tiered structures increases the need for relevant parties to review the draft appraisal for completeness and factual accuracy.
Engagements involving complicated entity and operational structures are not easily shoehorned into typical appraisal reporting formats and presentation. Unique entity and asset attributes may require complex valuation techniques and heighten the need for clear and concise reporting of appraisal results. Regardless of the
complexity of the underlying structure and valuation techniques, the appraisal report should still be easy to read and understand.
Understand the Income Approach in a Business Valuation
What Is the Income Approach and How Is It Utilized?
We recently wrote about the market approach, which is one of the three primary approaches utilized in business valuations. In this article, we’ll be presenting a broad overview of the income approach. The final approach, the asset-based approach, will discussed in a future article. While each approach should be considered, the approach(es) ultimately relied upon will depend on the unique facts and circumstances of each situation.
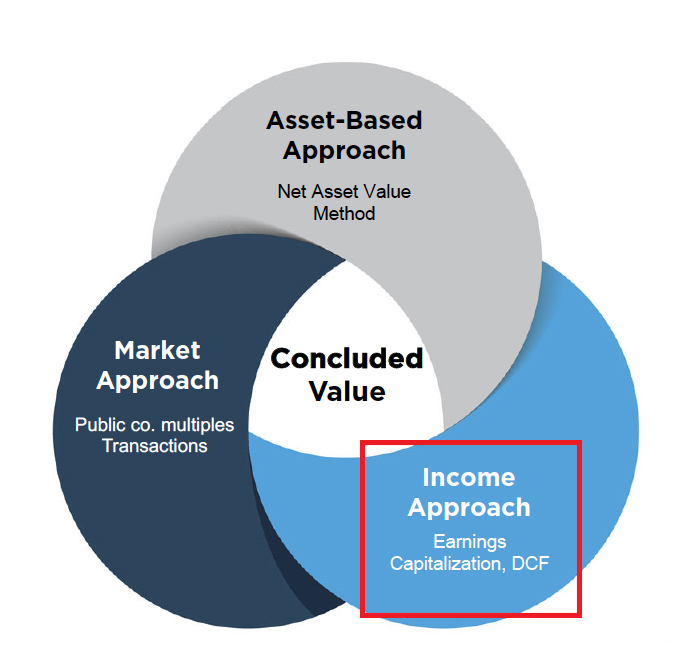
The income approach is a general way of determining the value of a business by converting anticipated economic benefits into a present single amount. Simply put, the value of a business is directly related to the present value of all future cash flows that the business is reasonably expected to produce. The income approach requires estimates of future cash flows and an appropriate rate at which to discount those future cash flows.
Methods under the income approach are varied but typically fall into one of two categories:
- Single period methods, for example capitalization of earnings or free cash flow
- Multi-period methods like the discounted cash flow (DCF)
The question if often asked, which method should you use, or should you use multiple methods? Also, does one use single period methods, or multi-period method? It depends on the facts and circumstances, including but not limited to, whether the business is in a mature or growing business cycle, if budgets/projections are prepared in normal course of business, among other considerations. More importantly, the analyst must evaluate if trends analyzed from the business’ historical performance provide a reasonable indication of the future, and which methodology or methodologies best capture that future economic stream of benefits.
Normalizing Adjustments
Before analyzing each method, it is important to start with normalizing adjustments, which serve as a foundation for both income approach methodologies. Normalizing adjustments adjust the income statement of a private company to show the financial results from normal operations of the business and reveal a “public equivalent” income stream. In creating a public equivalent for a private company, another name given to the marketable minority level of value is “as if freely traded,” which emphasizes that earnings are being normalized to where they would be as if the company were public, hence supporting the need to carefully consider and apply, when necessary, normalizing adjustments. There are two categories of adjustments.
Non-Recurring, Unusual Items
Mercer Capital dives deep into this subject in this article, but here are some highlights. These adjustments eliminate one-time gains or losses, unusual items, non-recurring business elements, income/expenses of non-operating assets, and the like. Examples include, but are not limited to:
- One-time legal settlement. The income (or loss) from a non-recurring legal settlement would be eliminated and earnings would be reduced (or increased) by that amount.
- Gain from sale of asset. If an asset that is no longer contributing to the normal operations of a business is sold, that gain would be eliminated and earnings reduced.
- Life insurance proceeds. If life insurance proceeds were paid out, the proceeds would be eliminated as they do not recur, and thus, earnings are reduced. The balance sheet impact can be dependent on whether the company has a direct obligation to repurchase the shares or not.
- Restructuring costs. Sometimes companies must restructure operations or certain departments, the costs are one-time or rare, and once eliminated, earnings would increase by that amount.
Discretionary Items
These adjustments relate to discretionary expenses paid to or on behalf of owners of private businesses. Examples include the normalization of owner/officer compensation to comparable market rates, as well as elimination of certain discretionary expenses, such as expenses for non-business purpose items (lavish automobiles, boats, planes, personal living expenses, etc.) that would not exist in a publicly traded company.
For more, refer to our article “Normalizing Adjustments to the Income Statements” and Chris Mercer’s blog.
Single Period Capitalization Method
Once the analyst determines adjusted earnings, we can move forward to capitalizing these economic benefits.
The simplest method used under the income approach is a single period capitalization model. Ultimately, this method is an algebraic simplification of its more detailed DCF counterpart. As opposed to a detailed projection of future cash flow, a base level of annual net cash flow and a sustainable growth rate are determined.
The value of any operating asset/investment is equal to the present value of its expected future economic benefit stream.

If the growth in cash flows is constant, this can be simplified:

Where
CF = Next year’s cash flow
g = perpetual growth rate
r = discount rate for projected cash flows
The denominator of the expression on the right (r – g) is referred to as the “capitalization rate,” and its reciprocal is the familiar “multiple” that is applicable to next year’s cash flow. The multiple (and thus the firm’s value) is negatively correlated to risk and positively correlated to expected growth. There are two primary methods for determining an appropriate capitalization rate—a public guideline company analysis or a “build-up” analysis (previous article by Mercer Capital where we discussed the discount rate in detail).
Discounted Cash Flow Method
Businesses may be valued using the DCF method because this method allows for modeling of varying or near-term accelerated growth revenues, expenses, and other sources and uses of cash over a discrete projection period. Beyond the discrete projection period, it is assumed that the business will grow at a constant rate into perpetuity. As that point, the future beyond the projection period is capitalized as the terminal value and the method converges to the single period capitalization.
In circumstances where no changes in the business model or capital structure are expected, a single period capitalization method may be sufficient. Ultimately, the DCF’s output is only as good as its inputs, therefore, testing of assumptions and reasonableness is critical.
The discounted cash flow methodology requires assumptions, but the formula can be broken down to three basic elements:
- Projected future cash flows
- Discount rate
- Terminal value
Projected Future Cash Flows
Discrete cash flows are forecasted for as many periods as necessary until a stabilized earnings stream could be anticipated (commonly in the range of 3-10 years). Ideally, projections will be sourced from management, but if management projections are not available, a competent valuation professional may choose to develop a forecast based on historical performance, industry data, and discussions with management. It is important to test the reasonableness of the projections by comparing historical and projected performance as well as expectations based on the subject company’s history and the industry in which it operates.
Discount Rate
A discount rate is used to convert future cash flows to present value as of the valuation date. Factors to consider include, but are not limited to business risk, supplier and/or customer concentrations, market and industry risk, size of the company, financial leverage, capital structure, among others. For a detailed look into discount rates, see a recent article published by Mercer Capital.
Terminal Value
The terminal value captures the value of the company into perpetuity. It uses a terminal growth rate, the discount rate, and the final year cash flow to arrive at a value, which is discounted and added to the discrete cash flow projections.
Conclusion
The income approach can determine the value of an operating business using financial metrics, growth rate and discount rate unique to the subject company. However, each method within the income approach must be selected based on applicability and facts and circumstances unique to the matter at hand; thus, a competent valuation expert is needed to ensure that the methods are applied in a thoughtful and appropriate manner.
Cash-Out Transactions and SEC Amended Rule 15c2-11
It may seem an odd time for some publicly traded companies to consider cash-out merger transactions because broad equity market indices are at or near record levels. Nonetheless, the changing market structure means some boards may want to consider it.
Among a small subset of public companies that may are those that are traded on OTC Markets Group’s Pink Open Market (“Pink”), the lowest of three tiers behind OTCQB Venture Market and OTCQX Best Market. Pink is the successor to the “pink sheets” which was published by a quotation firm that was purchased by investors who rechristened the firm OTC Markets Group.
Today, OTC Markets Group is an important operator in U.S. capital markets because it facilitates capital flows for 11,000 US and global securities that range from micro-cap and small-cap issuers across all major industries to ADRs of foreign large cap conglomerates. Many issuers are SEC registrants, too.
The issue that may cause some boards of companies traded on Pink to contemplate a cash-out merger or other transaction to reduce the number of shareholders is an amendment by the SEC to Rule 15c2-11, which governs the publication of OTC quotes and was last amended in 1991. Since then, markets and the public participation in markets have increased significantly as trading costs have declined and information has become more widely disseminated. The amendment applies only to Pink listed companies because those traded on OTCQB and OTCQX already meet the new requirements.
Because of a quirk in how the rule was written in conjunction with a “piggyback exception” for dealers, financial information for some Pink issuers is not publicly available. The amended rule, which goes into effect September 28, 2021, prohibits dealers from publishing quotes for companies that do not provide current information including balance sheets, income statements and retained earnings statements. OTC Markets Group requires companies to comply with the rule through posting information to the issuer’s publicly available landing page that it maintains.
While the disclosure requirement presumably is not burdensome, not all companies want to disclose such information, especially to competitors. Companies that choose not to comply with amended Rule 15c2-11 will no longer be eligible for quotation. Because shareholders of these companies historically have had the option to obtain liquidity, boards may want to evaluate an offer to repurchase shares or a cash-out merger transaction that reduces the number of shareholders.1
Also, some micro-cap and small-cap companies whether traded on an OTC market or a national exchange may not obtain as many advantages compared to a decade or so ago.
Given the rise of passive investing in which upwards of 50% of US equities are now held in a passively managed fund, companies that are not included in a major index such as the S&P 500, Russell 1000, NASDAQ or Russell 2000 are at a disadvantage given the amount of capital that now flows into passive funds. In some instances, it may make sense for these companies to go private, too.
Cash-out transactions can be particularly attractive for companies that have a high number of shareholders in which a small number of shareholders have substantial ownership. Cash-out merger transactions require significant planning with help from appropriate financial and legal advisors. The link here provides an overview of valuation and fairness issues to consider in going private and cash-out transactions for companies whether privately or publicly held.
Mercer Capital is a national valuation and financial advisory firm that works with companies, financial institutions, private equity and credit sponsors, high net worth individuals, benefit plan trustees, and government agencies to value illiquid securities and to provide financial advisory services related to M&A, divestitures, capital raises, buy-backs and other significant corporate transactions.
1 Cash-out merger transactions are also referred to as freeze-out mergers or squeeze-out mergers in shareholders owning fewer than a set number of shares receive cash for their shares while those holding more than the threshold amount will be continuing shareholders.
2021 Mid-Year Core Deposit Intangibles Update
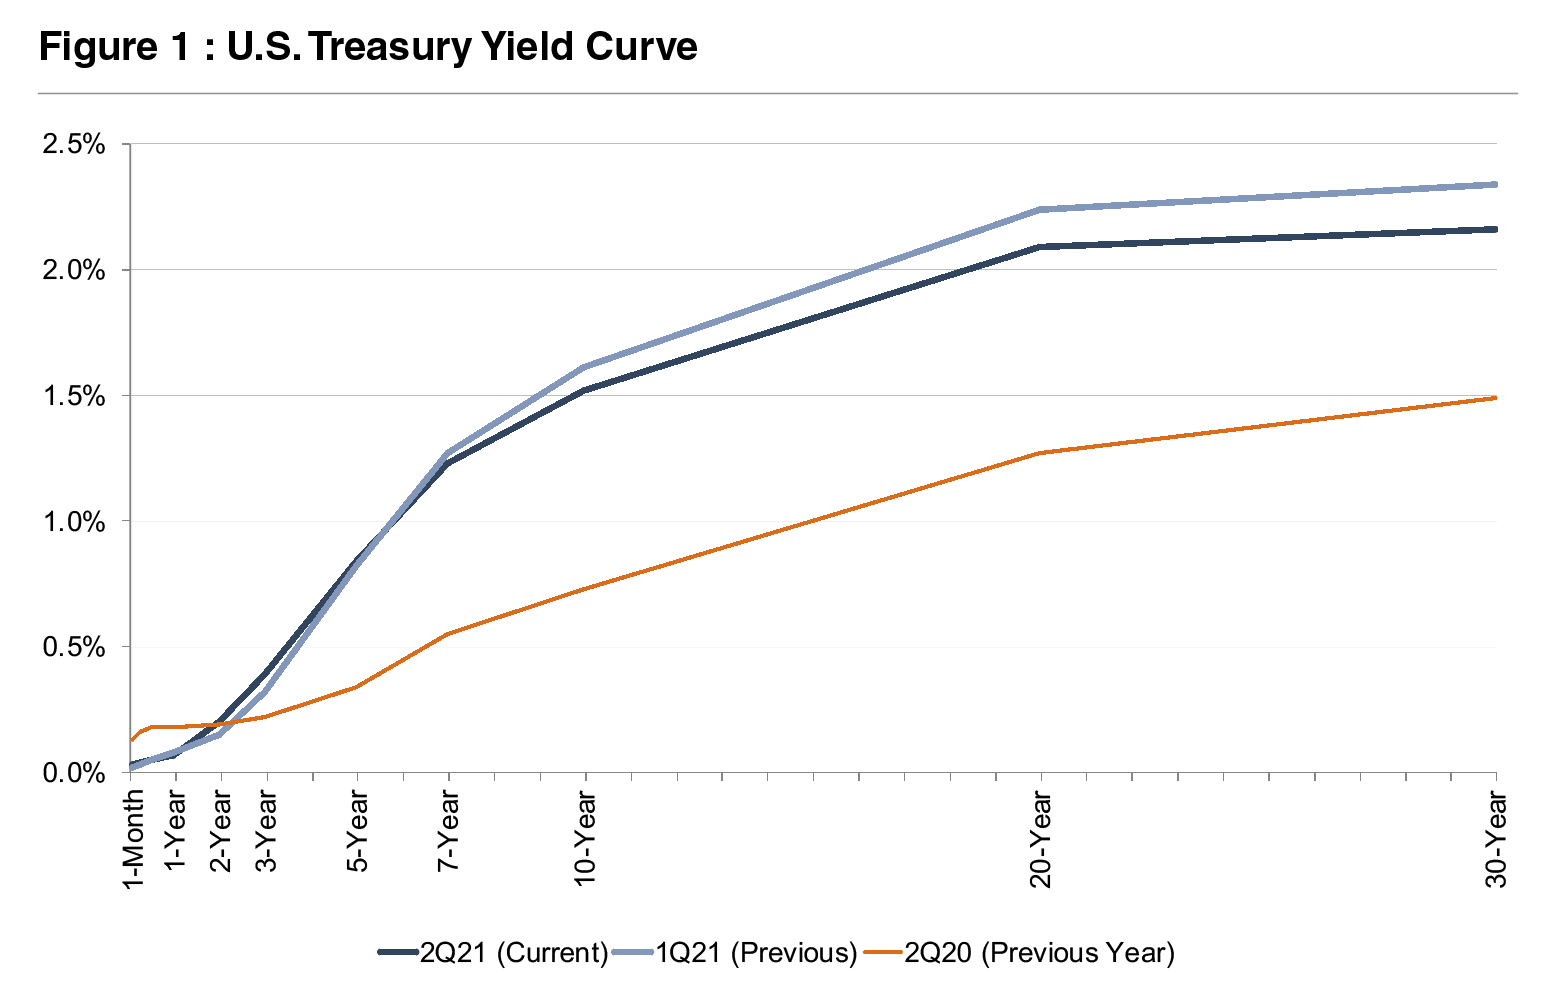
In our last update regarding core deposit trends published in August 2020, we described a decreasing trend in core deposit intangible asset values in light of the pandemic. In response to the pandemic, the Fed cut rates to effectively zero, and the yield on the benchmark 10-year Treasury reached a record low. While many factors are pertinent to analyzing a deposit base, a significant driver of value is market interest rates. Although there has been some recovery in longer-term treasury rates since this time last year, shorter-term treasury rates (maturities of two years or less) have eased as investors concluded the Fed will not raise short-term policy rates in the near-term.
M&A Activity
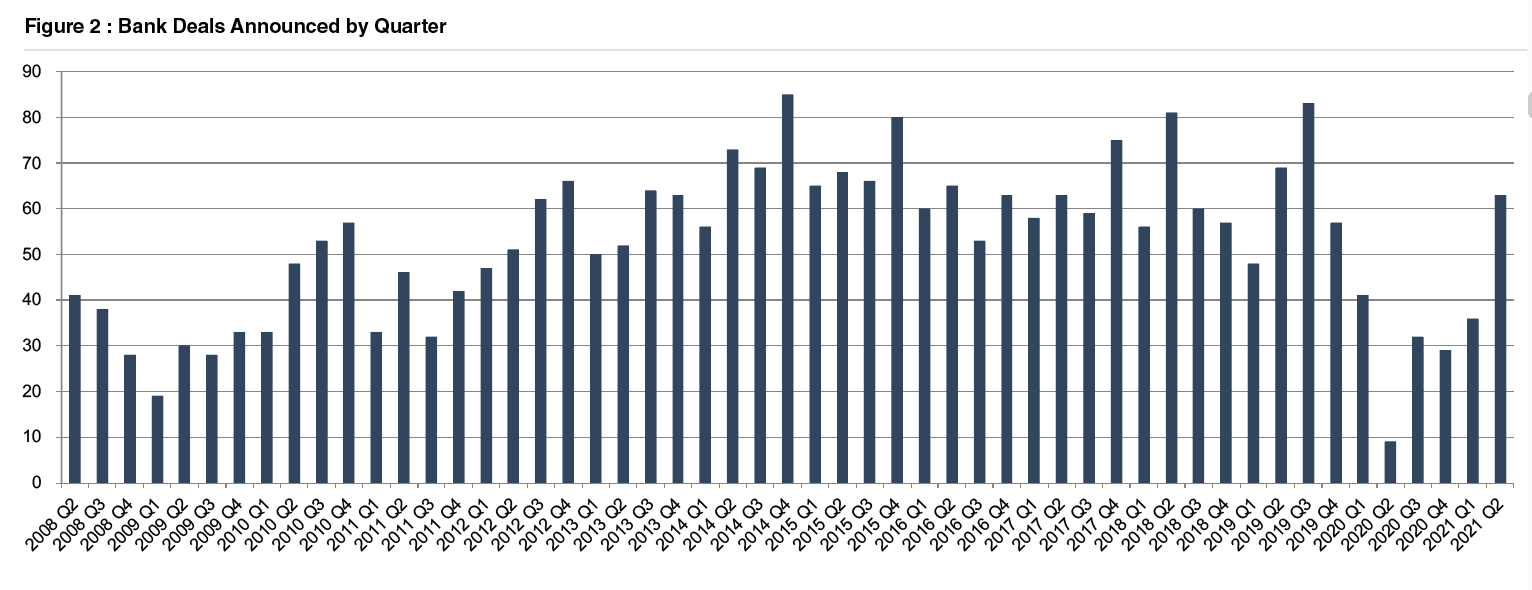
For the full year of 2020, bank M&A activity fell sharply to 111 announced transactions from approximately 250 to 300 transactions per year during 2014 to 2019. More deals have been announced in the first eight months of 2021 than were announced in all of 2020. As shown in Figure 2, on the next page, the majority of the 2021 announcements occurred in the second quarter.
With 63 announced deals, the second quarter of 2021 represented the highest level of quarterly deal announcements since the third quarter of 2019 (83 deals). For comparison, only nine whole-bank transactions were announced in the second quarter of 2020, representing the fewest deals announced during a quarter over the time period analyzed. At this time last year, there were several factors hindering deal activity. Unknowns surrounding credit quality and the severity of loan deferrals in the midst of the pandemic gave pause to many deal talks in progress prior to the pandemic. Constraints surrounding travel and due diligence also hampered activity.
Ultimately, credit losses were not as significant as were feared initially, and travel has begun to normalize in the wake of widespread vaccine distribution. As a result, there appears to be a degree of pent-up demand in the bank M&A market. Moreover, many of the factors driving acquisitions have intensified over the past year.
Revenue pressure is causing institutions to seek operational efficiencies via synergies, as loan growth (excluding PPP loans) has been exceptionally weak over the past year, deposit growth has been unprecedented, and interest rates remain near historic lows. Additionally, as more consumers adopted digital banking in a socially-distancing society, banks lacking capability in this arena saw a more acute need to seek partnerships with more technologically advanced institutions.
Click here to expand the chart above
Trends In CDI Values
Using data compiled by S&P Capital IQ Pro, we analyzed trends in core deposit intangible (CDI) assets recorded in whole bank acquisitions completed from 2000 through June 30, 2021. CDI values represent the value of the depository customer relationships obtained in a bank acquisition. CDI values are driven by many factors, including the “stickiness” of a customer base, the types of deposit accounts assumed, and the cost of the acquired deposit base compared to alternative sources of funding. For our analysis of industry trends in CDI values, we relied on S&P Capital IQ Pro’s definition of core deposits.1 In analyzing core deposit intangible assets for individual acquisitions, however, a more detailed analysis of the deposit base would consider the relative stability of various account types.
In general, CDI assets derive most of their value from lower-cost demand deposit accounts, while often significantly less (if not zero) value is ascribed to more rate-sensitive time deposits and public funds, or to non-retail funding sources such as listing service or brokered deposits which are excluded from core deposits when determining the value of a CDI.
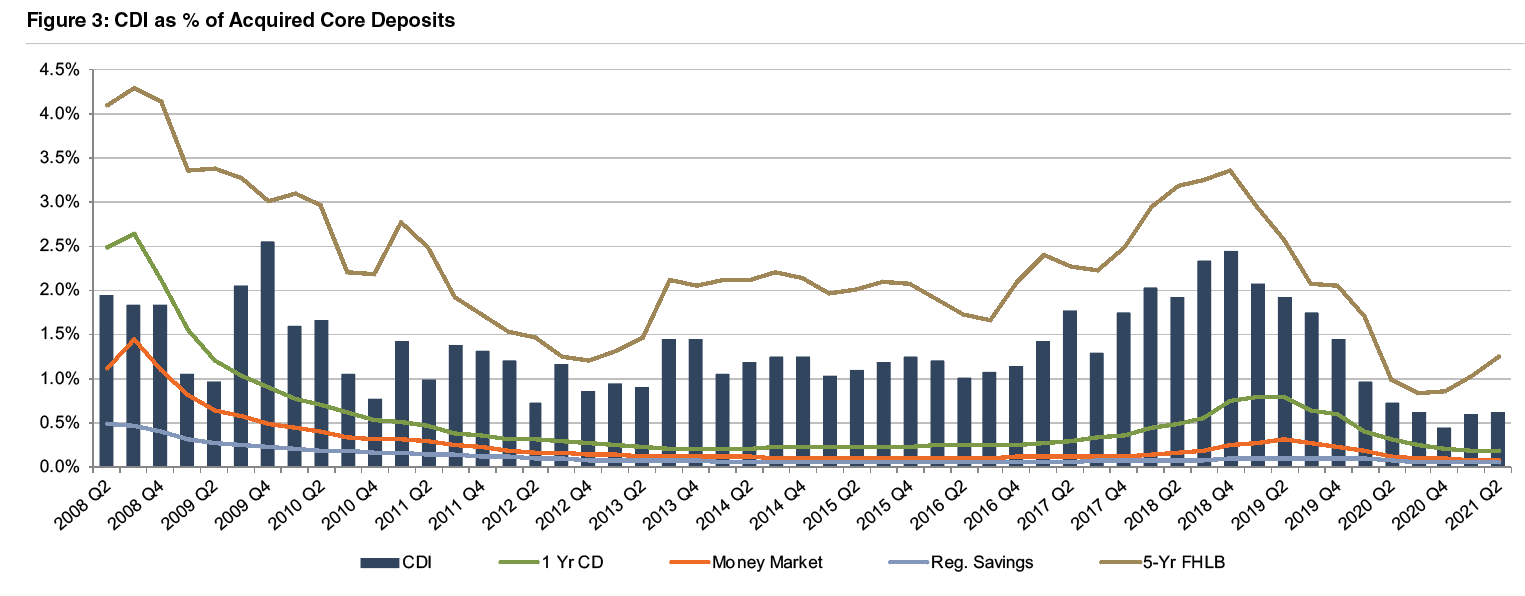
Figure 3, below, summarizes the trend in CDI values since the start of the 2008 recession, compared with rates on 5-year FHLB advances. Over the post-recession period, CDI values have largely followed the general trend in interest rates—as alternative funding became more costly in 2017 and 2018, CDI values generally ticked up as well, relative to post-recession average levels.
Click here to expand the chart above
Throughout 2019, CDI values exhibited a declining trend in light of yield curve inversion and Fed cuts to the target federal funds rate during the back half of 2019. This trend accelerated in March 2020 when rates were effectively cut to zero. CDI values have shown some recovery in the past two quarters (average of 60 basis points for the first half of 2021 as compared to 50 basis points in the second half of 2020). Despite the recent uptick, CDI values remain below the post-recession average of 1.33% in the period presented in the chart and meaningfully lower than long-term historical levels which averaged closer to 2.5-3.0% in the early 2000s.
The average CDI value declined 11 basis points from June 2020 to June 2021, while the five year FHLB advance increased 25 basis points over the same period. Although the five year FHLB advance rate has increased year-over-year, rates on FHLB advances with terms of less than two years have declined an average of 11 basis points since this time last year.
Since the beginning of the pandemic, banks have been burdened with an excess of deposits. It was initially expected that the increase in deposits would be transient in nature as the economy re-opened, PPP funds were spent or invested, and consumer confidence improved. However, the glut of deposits has endured, and deposits at US commercial banks were at a record level of $17.3 trillion at the end of July despite earning historically low deposit rates. Weak loan demand has aggravated the issue for banks, and margin pressure remains a very real concern for financial institutions.
In past cycles, when interest rates declined, the change in the CDI/core deposit ratio was mostly caused by lower CDI values (the numerator in the ratio). In the pandemic, though, CDI values declined (due to lower rates) while core deposits increased (due to the governmental response to the pandemic among other factors). With market participants unwilling to pay a premium for potentially transient deposits, the CDI/core deposit ratio was squeezed by both lower CDI values (the numerator) and higher core deposits (the denominator). Time will tell how stable deposits will be after the deposit influx experienced in 2020 and the first half of 2021, which will affect CDI values going forward.
Trends In Deposit Premiums Relative To CDI Asset Values
Core deposit intangible assets are related to, but not identical to, deposit premiums paid in acquisitions. While CDI assets are an intangible asset recorded in acquisitions to capture the value of the customer relationships the deposits represent, deposit premiums paid are a function of the purchase price of an acquisition. Deposit premiums in whole bank acquisitions are computed based on the excess of the purchase price over the target’s tangible book value, as a percentage of the core deposit base.
While deposit premiums often capture the value to the acquirer of assuming the established funding source of the core deposit base (that is, the value of the deposit franchise), the purchase price also reflects factors unrelated to the deposit base, such as the quality of the acquired loan portfolio, unique synergy opportunities anticipated by the acquirer, etc.
Additional factors may influence the purchase price to an extent that the calculated deposit premium doesn’t necessarily bear a strong relationship to the value of the core deposit base to the acquirer. This influence is often less relevant in branch transactions where the deposit base is the primary driver of the transaction and the relationship between the purchase price and the deposit base is more direct. Figure 4 presents deposit premiums paid in whole bank acquisitions as compared to premiums paid in branch transactions.
As shown in Figure 4, deposit premiums paid in whole bank acquisitions have shown more volatility than CDI values. Deposit premiums in the rangeof 6% to 10% remain well below the pre-Great Recession levels when premiums for whole bank acquisitions averaged closer to 20%.
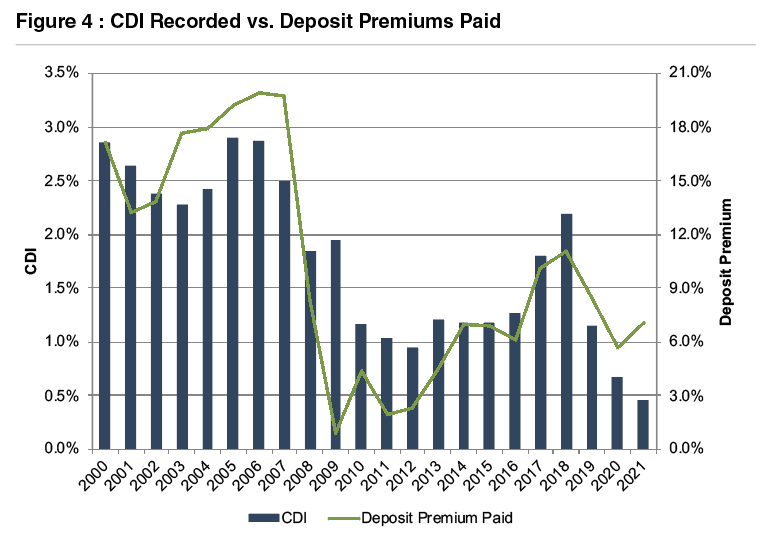
Deposit premiums paid in branch transactions have generally been less volatile than tangible book value premiums paid in whole bank acquisitions. Branch transaction deposit premiums averaged in the 4.5% to 7.5% range during 2019 and 3.0% to 7.5% during 2020, up from the 2.0% to 4.0% range observed in the financial crisis. Only eight branch transactions were completed in the first half of 2021, but the range of their implied premiums is in line with 2019 and 2020 levels.
Some disconnect appears to exist between the prices paid in branch transactions and the CDI values recorded in bank M&A transactions. Beyond the relatively small sample size of branch transactions, one explanation might be the excess capital that continues to accumulate in the banking industry, resulting in strong bidding activity for the M&A opportunities that arise–even in situations where the potential buyers have ample deposits.

Accounting For CDI Assets
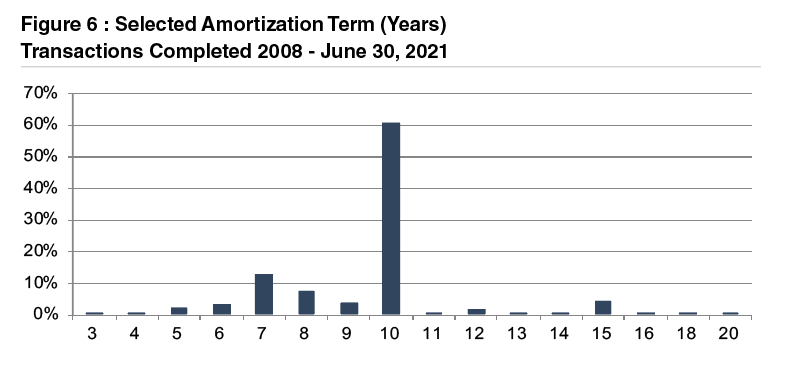
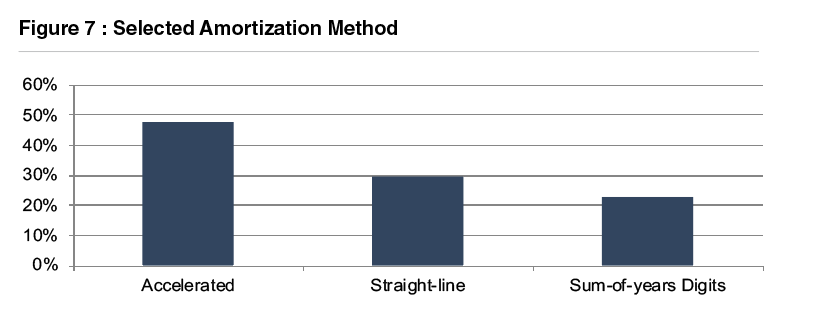
Based on the data for acquisitions for which core deposit intangible detail was reported, a majority of banks selected a ten-year amortization term for the CDI values booked. Less than 10% of transactions for which data was available selected amortization terms longer than ten years. Amortization methods were somewhat more varied, but an accelerated amortization method was selected in approximately half of these transactions.
For more information about Mercer Capital’s core deposit valuation services, please contact one of our professionals.
1 S&P Global Market Intelligence defines core deposits as, “Deposits, less time deposit accounts with balances over $100,000, foreign deposits and unclassified deposits”
Meet the Team – Scott A. Womack, ASA, MAFF
In each “Meet the Team” segment, we highlight a different professional on our Family Law team. The experience and expertise of our professionals allow us to bring a full suite of valuation and forensics services to our clients. We hope you enjoy getting to know us a bit better.
What attracted you to a career in litigation?
Scott Womack: I started doing divorce work about 13 years ago. Personally, I have found this work to be very rewarding. Divorce clients are very appreciative and I feel like I am making a difference as their Trusted Advisor throughout the process, but especially in mediation or during the trial. Often the non-business or out-spouse is not directly involved in the couple’s business and doesn’t know the value of the business or understand the process of valuation. These clients look to us to educate them and guide them through the process. Business owners or the in-spouse also see us as a value-add to the process, as they may have not gone through the business valuation process during their ownership of their company.
What type of cases give rise to your involvement in litigation matters?
Scott Womack: More often than not, I am involved in family law/divorce cases. The cases generally involve high wealth individuals and those that own businesses or business interests. In addition to the valuation and forensic work, I also participate in mediation to assist the client in an attempted settlement. If mediation is not successful, I generally submit a formal report to the Court and do testimony work at trial. Other litigation projects include breach of contract or shareholder disputes.
What drew you to financial forensics?
Scott Womack: A forensic credential allowed me to better analyze financial statements in divorce. Credentials help to frame your expertise and demonstrate your general ability to do your work. In a lot of divorce cases, especially if you are valuing a business, there can be forensic work. One example would be discretionary or personal expenses being paid through the business, which can have an impact on the value of the business as well as implications in the divorce such as possible dissipation or income available for support.
How has the valuation industry evolved since you started?
Scott Womack: Early in my career, the industry was comprised mostly of valuation generalists. In the early 2000s, financial statement reporting and valuations took on a whole new life of their own with purchase price allocations and stock based compensation. At this point, the valuation profession kind of exploded to become more specialized. We have people that now specialize in a specific service, be it divorce, financial statement reporting, or a particular industry. That is really what I have seen change. The movement from generalization to specialization. Especially for growth in your career, specialization is a great avenue for advancement by being able to be an expert in a field.
What influenced your concentration in the Auto Dealership Industry?
Scott Womack: I had a partner at my old firm who had several auto clients and I often got to work on those engagements. Some of these cases were related to divorce so I was able to see the litigation side as well. The Auto Dealership industry has some unique characteristics in its financial statements and operations. After being exposed to these differences I saw an opportunity to make an impact in this industry. I would be able to specialize in this area in order to provide the best valuation services possible.
What are a few unique characteristics of the Auto Dealership Industry?
Scott Womack: The financial statements are pretty unique in the Auto Dealership industry. Dealers have to submit monthly financials to manufacturers, and each manufacturer statement looks a little different, almost like trying to solve a puzzle. Due to the specialization and profit centers of the various departments, these statements have a lot of detail. They are very informative with not only the major categories like assets, liabilities, and revenues, but you can determine the size the service department or how many used vehicles they sold, what they’re selling them for, or how much inventory they have on the lot.
Not only do auto dealerships have to submit monthly statements, but some also report a thirteenth month statement. The thirteenth month takes the twelfth month with added year-end tax adjustments, normalization adjustments, etc. Furthermore, there is unique terminology in this industry. An example would be, “Blue-Sky”, which is the goodwill value of the dealership. It can encompass a number of factors and the Blue Sky value is often very meaningful to a dealer requesting a valuation.
There are also nuances in ownership and management that are important to know, as well as different valuation techniques and methodologies that are preferred. Someone specialized in this industry is better equipped to know what a client is looking for. I have found that my experience valuing auto dealerships has given me an advantage in knowing what to look for and what questions to ask.
What is one thing about your job that gets you excited to work every day?
Scott Womack: I have always enjoyed that the valuation and consulting business is project-based. On a project basis, you are able to work with different owners and different industries all across the board. One of my favorite parts of a project is conducting the management interviews and site visits. While the financial statements paint a picture and supply the quantitative results of operations, the management interviews provide much of the qualitative factors and allow you to gain an understanding of the company, the industry and the risk factors that they face. I enjoy meeting different business owners and learning about their successful companies and history.
Understanding Transaction Advisory Fees
Real Expertise Is an Investment, and the Benefits in Return Should Well Exceed the Costs
In the previous article, we highlighted the various benefits of hiring a financial advisor when investigating the potential sale of a business.
In a transaction with an outside party, the buyer will almost always be far more experienced in “deal-making” relative to the seller, who often will be undertaking the process for the first (and likely only) time. With such an imbalance, it is important for sellers to level the playing field by securing competent legal, tax and financial expertise.
A qualified sell-side advisor will help ensure an efficient process while also pushing to optimize the terms and proceeds of the transaction for the sellers.
As with anything in this world, favorable transaction processes and outcomes require an investment. Fee structures for transaction advisory services can vary widely based on the type and/or size of the business, the specific transaction situation, and the varying roles and responsibilities of the advisor in the transaction process.
Even with this variance, most fee structures fall within a common general framework and include two primary components: 1) Project Fees and 2) Success Fees.
Project Fees
Project fees are paid to advisors throughout an engagement for the various activities performed on the project. Such activities include the initial valuation assessment, development of the Confidential Information Memorandum, development of the potential buyer list, and other activities. These fees generally include an upfront “retainer” fee paid at the beginning of the engagement.
Retainer fees serve to ensure that a seller is serious about considering the sale of their business. For lower middle market transactions, the upfront retainer fee is typically in the $10,000 to $20,000 range.
Often times, a fixed monthly project fee will be charged throughout the term of the engagement. These fees are meant to cover some, but not all, of an advisor’s costs associated with the project.
For lower middle market transactions, monthly fees are typically $5,000 to $10,000. In certain situations, the engagement will include hourly fees paid throughout the engagement for the hourly time billed by the advisor. Such hourly fees are billed in place of a fixed monthly project fee.
Hourly fees are typically appropriate when the project is more advisory-oriented versus being focused on turn-key transaction execution. Hourly fees serve to emphasize the objective needs of the client by counter-balancing the incentive for an advisor to “push a deal through” that may not be in the best long-term interests of the client.
An hourly fee structure typically front loads the fees paid throughout the transaction process and is paired with a reduced success fee structure at closing which brings total fees back in line with market norms.
Mercer Capital has had favorable outcomes with numerous clients when fee structures are well-tailored to the facts and circumstances of the seller and the seller’s options in the marketplace.
Success Fee
A success fee is paid to a transaction advisor upon the successful closing of a transaction. Typically, success fees are paid as part of the disbursement of funds on the day of closing. As with project fees, success fees can be structured in a number of different ways.
A simple approach is to apply a flat percentage to the aggregate purchase price to calculate the success fee. The use of a flat percentage fee seems to have increased in recent years, and makes a fair bit of sense as it allows the client to clearly understand what the fees will look like on the back-end of a transaction.
Traditionally, the most used success fee structure employs a waterfall of rates and deal valuation referred to as the Lehman Formula. This formula calculates the success fee based on declining fee percentages applied to set increments (“tranches”) of the total transaction purchase price.
For lower middle market transactions, the simplest Lehman approach is a 5-4-3-2-1 structure: 5% on the first million dollars, 4% on the next million, and so on down to 1% on any amount above $4 million. The Lehman Formula, which can be applied using different percentages and varying tranche amounts, pays lower percentages in fee as the purchase price gets higher. Smaller deals may include a modified rate structure (for example 6-5-4-3-2) or may alter the tranche increments from $1 million to $2 million.
The Lehman Formula, in its varying forms, has been utilized to calculate transaction advisory fees for decades. While the formula may add some unnecessary complexities to the calculation (versus say a flat percentage), it has proven over time to provide reasonable fee levels from the perspective of both sell-side advisors and their clients.
A success fee can also be structured on a tiered basis, with a higher percentage being paid on transaction consideration above a certain benchmark. If base-level pricing expectations on a transaction are $15 million, the success fee might be set at 2.5% of the consideration up to $15 million and 5% of the transaction consideration above this level. If the business were sold for $18 million, the fee would be 2.5% of $15 million plus 5% of $3 million. The blended fee in this case would total $525,000, a little under 3% of the total consideration.
Escalating success fees are often favored by clients because they provide an incentive for advisors to push for maximized deal pricing rather than settling for an easier deal at a lower price.
Typical Total Fees
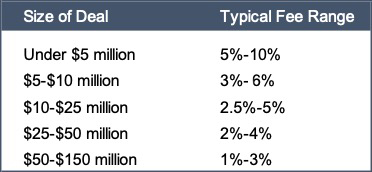
Transaction advisory fees, on a percentage basis, tend to be higher for smaller transactions and decline as the dollars of transaction consideration increases. Various surveys of transaction advisors are available online that suggest typical fee ranges.
Consensus figures from these sources are outlined below. Based on our experience, these “typical” ranges (or at least the upper end of each range) appear to be somewhat inflated relative to what most business owners should expect in an actual transaction advisory engagement.
Mercer Capital’s View on Fees
At Mercer Capital, we tailor fees in every transaction engagement to fit both the transaction situation at hand and our client’s objectives and alternatives.
In situations where a client has an identified buyer, we understand that our role will likely be focused on valuation and negotiation. Many sellers are unaware that price is only one aspect of the deal, and terms are another. Altering the terms of a definitive agreement can move the needle by 5%-10% and can potentially accelerate end-game liquidity by 6 to 12 months.
Accordingly, we design each fee structure to recognize what we are bringing to the process, typically utilizing some combination of hourly billings and a tiered success fee structure on the portions of the deal where our services are making a difference in the total outcome.
If we are assisting a client through a full auction process, it may be appropriate to utilize a more traditional Lehman Formula or a flat percentage calculation. A primary focus of our initial conversations with a potential client is to understand the situation in detail so that we can develop a fee structure that ensures that the client receives a favorable return from their investment in our services.
Mercer Capital provides transaction advisory services to a broad range of public and private companies and financial institutions. We have worked on hundreds of consummated and potential transactions since Mercer Capital was founded in 1982.
Mercer Capital leverages its historical valuation and investment banking experience to help clients navigate critical transactions, providing timely, accurate, and reliable results. We have significant experience advising shareholders, boards of directors, management, and other fiduciaries of middle-market public and private companies in a wide range of industries.
Rather than pushing solely for the execution of any transaction, Mercer Capital positions itself as an advisor, encouraging the right decision to be made by its clients. We recommend to clients to accept the right deal or no deal at all.
Our dedicated and responsive team is available to manage your transaction process. To discuss your situation in confidence, give us a call.
The SEC Adopts New Rule 2a-5 for Valuation of Fund Portfolio Investments
Summary
In December 2020, the Securities and Exchange Commission (“SEC”) adopted a new rule 2a-5 to update the regulatory framework around valuations of investments held by a registered investment company or business development company (“fund”). Boards of directors of funds are obligated to determine fair value of investments without readily available market quotations in good faith under the Investment Company Act of 1940 (“Act”).
Rule 2a-5 specifies requirements to fulfill these obligations. Concurrently, the SEC also adopted rule 31a-4, which provides recordkeeping requirements related to fair value determinations. Rule 2a-5 was effective as of March 2021, and funds are required to be compliant upon the conclusion of an 18-month transition period following the effective date (voluntary early compliance allowed).
Valuation Framework
Prior to adopting rule 2a-5, the SEC last addressed valuation practices under the Act more than 50 years ago. Over the intervening period, the variety of securities and other instruments held by investment funds has proliferated. The volume and type of data used in valuations have also increased. Funds increasingly use third-party services to provide pricing information, especially for relatively illiquid or otherwise complex assets. In addition, accounting standards and regulatory requirements have advanced including developments related to ASC 820, Fair Value Measurement.
Against this backdrop, rule 2a-5 establishes a framework consisting of four primary functions required to determine fair value in good faith. A fund board may choose to determine fair value by executing the functions. Rule 2a-5 also allows a fund board to designate these functions to a “valuation designee.” The required functions are:
- Periodically assess and manage valuation risks, including conflicts of interest. The rule does not prescribe a required minimum frequency for re-assessing valuation risks, instead stating that different frequencies may be appropriate for different funds or risks. Re-assessment of valuation risks should generally consider changes in fund investments, significant changes in investment strategies or policies, market events, and other relevant factors.
- Establish and apply fair value methodologies. Satisfying this function will require selecting and applying appropriate valuation methodologies, periodically reviewing the appropriateness and accuracy of the methodologies (and making any necessary changes or adjustments), and monitoring for circumstances that may necessitate the use of fair value. A fund board or the valuation designee is required to specify key inputs and assumptions used in the valuation of particular asset classes or portfolio holdings. Appropriate valuation methodologies for investments may vary, even within the same asset class. However, these methodologies are expected to be applied consistently to minimize the risks of selecting methodologies to achieve a specific outcome. Further, the rule states that appropriate methodologies must be consistent with the principles outlined in ASC 820.
- Test fair value methodologies for appropriateness and accuracy. This function is intended to ensure the selected valuation methodologies are appropriate and adjustments are made as necessary. The fund board or the valuation designee should identify the testing methods and the minimum frequency with which such methods will be used. However, the rule does not prescribe any particular testing method or specific minimum testing frequency. Examples of testing methods include calibration and back-testing against valuations obtained from observed transactions.
- Oversight and evaluation of pricing services. The fund board or the valuation designee must establish a process for approving, monitoring, and evaluating pricing service providers. A process to initiate pricing challenges, as appropriate, is also required. Pricing services are described as third parties that regularly provide funds with information on evaluated prices, matrix prices, price opinions, or similar pricing estimates or information to assist in determining fair value of fund investments. The rule discusses the possibility of conflicts of interest on the part of the pricing services, arising from the need to maintain continuing business relationships with the fund board or valuation designee. Accordingly, the oversight function is intended to ensure the fund board or the valuation designee has a reasonable basis to use the pricing information it receives as inputs in performing valuations.
Valuation Designees
When fair value determinations are made by a valuation designee, which can be the fund adviser or an officer of an internally managed fund, the board is required to actively oversee the valuation designee’s work and compliance with the rule. In general, rule 2a-5 limits possible designees to entities that that have a fiduciary duty to the fund. While the adviser may have some conflicts, the fiduciary obligation to the fund would ensure that the valuation designee acts in the fund’s best interest and mitigates or discloses conflicts. The rule states that fund boards should approach oversight of the valuation designee’s work with a skeptical and objective view that considers valuation risks, the appropriateness of the valuation process, and the skill and resources devoted to the endeavor. In order to assist the fund board in its oversight function, a valuation designee is required to present both annual and quarterly written reports to the board.
Quarterly reports should include:
- Items requested by the board related to the fair value of investments or the valuation process.
- A summary or description of material fair value matters that occurred in the prior quarter, including any significant changes in valuation risks, fair value methodologies, and the process for selecting and overseeing pricing services.
Annual reports should include:
- An assessment of the valuation process, including a summary of the results of the testing of fair value methodologies.
- An assessment of the adequacy of resources allocated to the valuation process.
In addition to periodic reporting to the fund board, the valuation designee is required to state the titles of the persons responsible for the valuation of portfolio investments. The valuation designee should also reasonably segregate fair value determinations from the portfolio management of the fund so that the portfolio manager does not determine or exert influence on the valuation of portfolio investments.
Conclusion
Rule 2a-5 updates decades-old valuation guidance from the SEC for investment funds. Fund boards have the primary responsibility to adhere to the valuation framework outlined in the rule. When a valuation designee performs these functions, active oversight is required of the board. The rule prescribes a framework that emphasizes understanding and managing risks around conflicts of interest and promotes a principles-based valuation regime that aligns with recent accounting and regulatory developments, notably ASC 820.
Originally published in the Portfolio Valuation: Private Equity and Credit, Third Quarter 2021.
2021 Transportation Industry Update | COVID in Review
COVID-19 has had a lasting impression on many industries throughout the world, but the U.S. trucking and transportation industry was among the first industries to feel the impact of the pandemic.
Lockdowns in China (initiated in December 2019) began affecting the U.S. trucking industry in very early 2020 as Chinese imports account for nearly 40% of all shipments entering the U.S. By the beginning of March, the U.S. had already begun to see massive declines in incoming freight with an escalation of shipping cancellations. The ports of Seattle and Long Beach experienced 50-60 container shipment cancellations reflecting declines of 9% relative to the prior year.
When discussing the decline of imports in the port of Seattle, Sheri Call of the Washington Trucking Association said, “That’s the kind of decline we’d normally see over the course of an entire year.” Disruption of international trade led to transportation companies reducing capacity as early as the beginning of March. Outbound rail and trucking shipments from LA dropped 25% and 20% respectively, in March 2020.
Due to social distancing requirements throughout the United States, many roadside eateries and rest areas were closed in the first several months of the pandemic, which reduced truck drivers’ access to food and other necessities for long days on the road. Trucking companies were forced to alter their transportation network, frequently carrying empty loads as a result of uneven and declining demand. According to Reuters, “trucks hauling food and consumer products north to the United State are returning empty to Mexico where mass job losses have hit demand, leaving cash-strapped truckers to log hundreds of costly, empty miles.” Empty loads increased nearly 40% worldwide in the immediate aftermath of the lockdown.
An indication of the health of U.S. trucking industry can be seen through the ratio of full north bound trips to full southbound trips at the Mexico-US border. The ratio is typically one full southbound trip to every three full northbound trips, but the ratio began to lean closer to a one to seven ratio during the pandemic with the remainder being empty or partially full. Additionally, new freight contracts have fallen 60% to 90% since the rise of COVID-19 in 2020.
Increased online shopping from consumers has led to a spike in demand for last-mile delivery services. Amazon reported $75.5 billion in 2020 first-quarter sales which was a 26% increase from the first quarter of 2019. Many last-mile delivery companies like FedEx and Amazon continued to hire workers with Amazon seeing an increase in company employment of nearly 175,000 workers from March to April of 2020. Last-mile delivery carriers also eliminated signature requirements so that they can now achieve a “contactless” delivery process.
The level of domestic industrial production is correlated to the demand for services within the transportation industry. The Industrial Production Index is an economic measure of all real output from manufacturing, mining, electric, and gas utilities.
Lockdowns that began in March of 2020, as a result of the pandemic, led to a sharp decline in the Industrial Production Index. The index began a rapid recovery during the summer months of 2020. At the end of the first quarter of 2020, the Industrial Production Index saw a quarter-over-quarter decrease of 16.7% while also being down 17.7% on a year-over-year basis. The index rebounded in the second quarter of 2020 with a quarter-over-quarter increase of 12.7%. The index continually increased over the last three quarters of 2020, but it had not reached pre-pandemic levels as of April 2021.
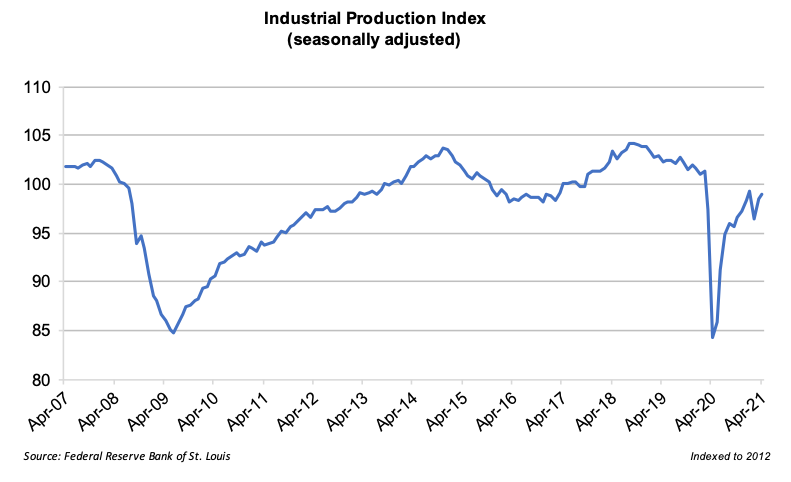
The outlook for the trucking industry at the beginning of 2020 was promising with economists predicting that freight rates would grow 2% over the course of the year. Strong economic growth in the first two months of 2020 was halted by the outbreak of the unforeseen pandemic. The impact was dramatic – though not entirely negative for all carriers. Carriers of essential goods like groceries, cleaning supplies, and medical supplies experienced skyrocketing demand for their services while industrial, manufacturing, and other non-essential carriers are still undergoing lasting effects from the pandemic.
One non-essential industry that experienced a downward turn at the onset of the pandemic was the vehicle shipping services industry. A strong economy with high disposable income and consumer confidence ramped up consumer spending for the American automobile industry in the periods leading up to the pandemic.
The industry’s growth prospects were halted during 2020 due to a high unemployment rate and a drop-off in disposable income. The success of the vehicle shipping services industry is closely intertwined with new car sales and consumer confidence. The graph below shows the relationship between revenue of the vehicle shipping services industry and new car sales and consumer confidence. Overall, decreased consumer confidence in 2020 led to many Americans electing to defer vehicle upgrades, which created a major economic downturn for the vehicle shipping services industry.
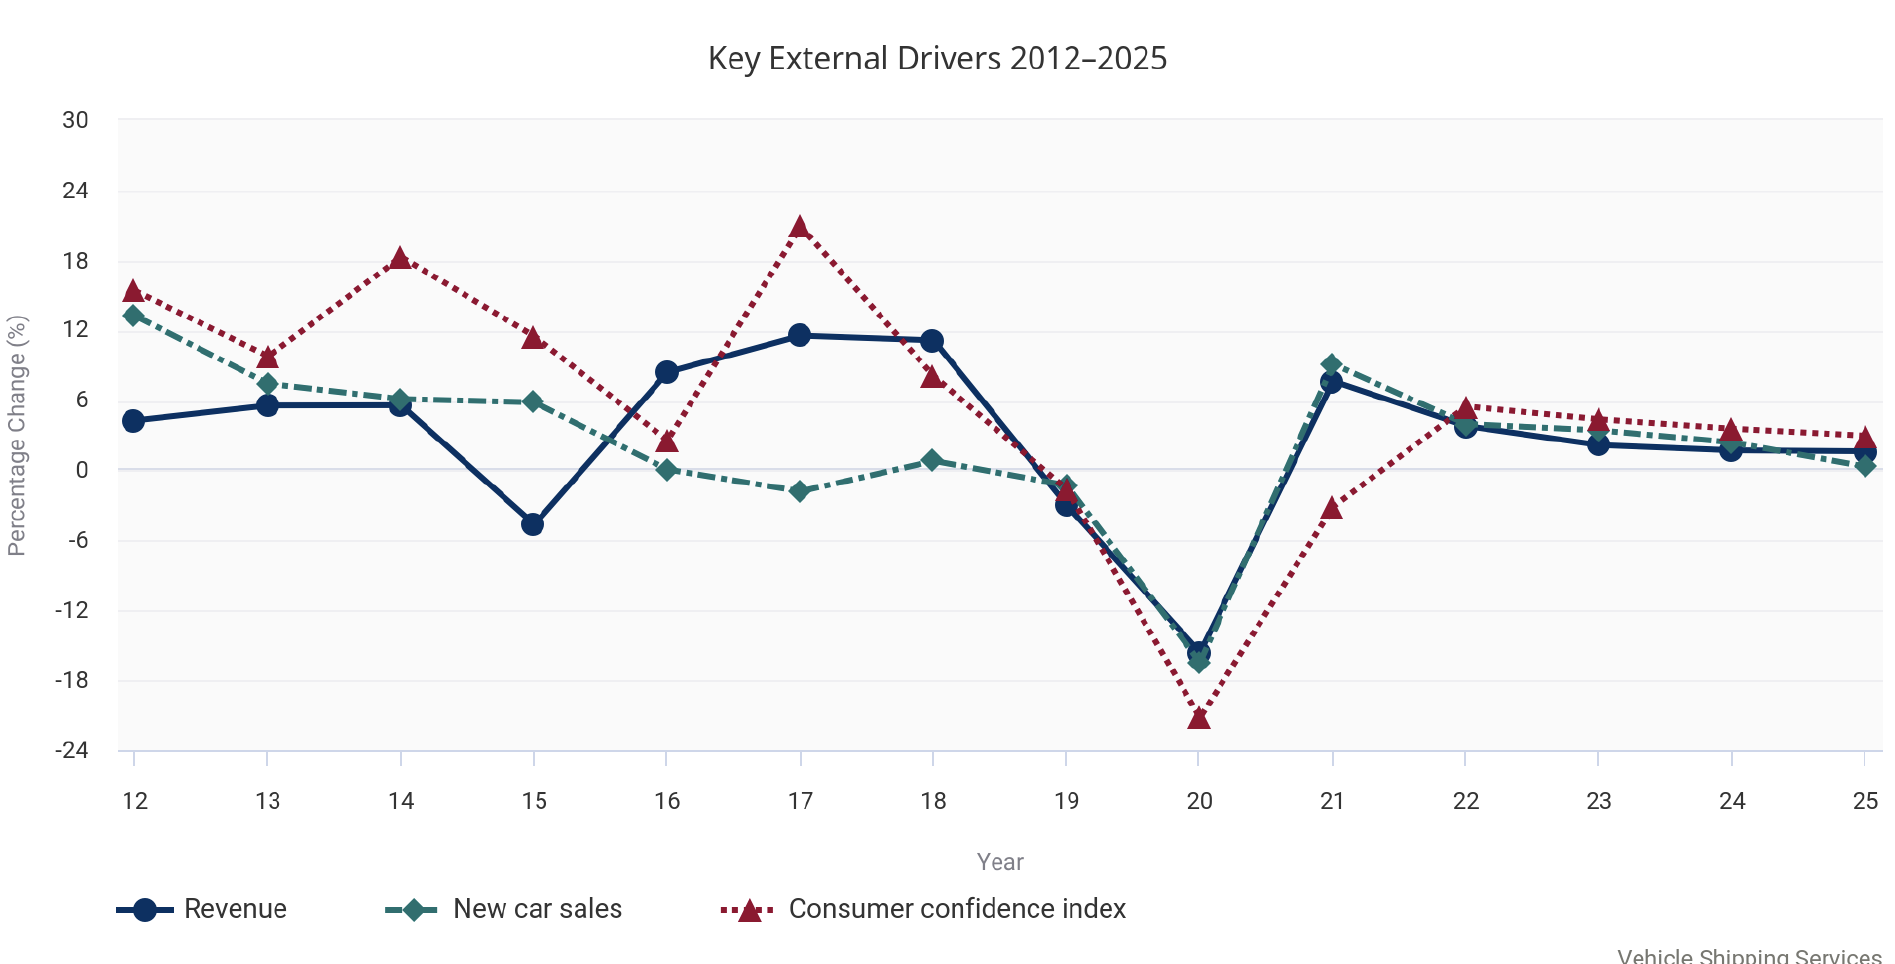
With many businesses closed, overall Cass Freight trucking shipments plummeted, seeing a decrease of 15.1% and 22.7% from April 2019 to April 2020. Truck tonnage also dropped 9.3% on a from March 2020 to April 2020 while declining 8.90% from April 2019 through April 2020.
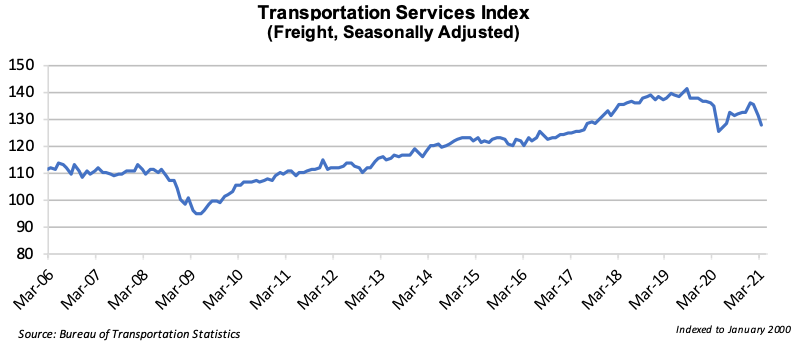
The fall of the number of shipments along with overall truck tonnage caused transportation companies to lower contract and spot rates. Flatbed and reefer rates hit a five-year low in April of 2020, though they rapidly recovered and had surpassed pre-pandemic rates by the fourth quarter of 2020. Truck tonnage has not recovered at the same rate as spot and contract pricing and had not reached pre-pandemic levels by March 2021. These trends are reflected in the Cass Freight and Shipment Indices. While the Shipments index has increased relative to its April 2020 level and has surpassed pre-pandemic levels, the Expenditures index increased over 27% from March 2020 through April 2020.
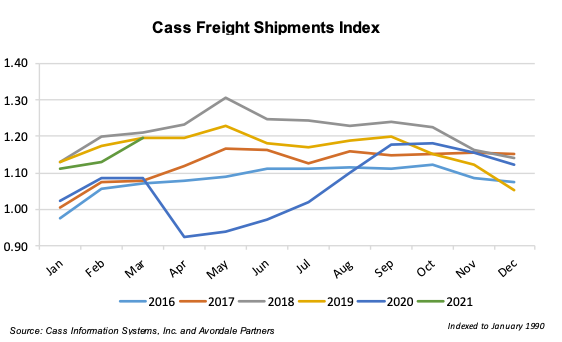
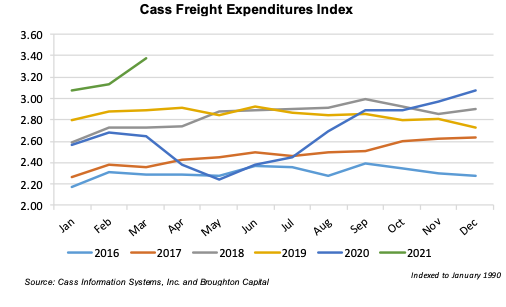
Even though contract rates did not have as sharp of a decline in March of 2020 as spot rates, both experienced a drop-off at the onset of the pandemic. Spot rates dropped below numbers that had been seen in recent years. After the sharp decline of spot rates in March, rates for all categories began to steadily increase. Rates hit a seasonal decline at the end of December due to decreased consumer spending after the holiday season. Rates resumed their climb during the first months of 2021. Overall, the rising price of contract and spot rates spins a positive image for overall outlook of the trucking industry, while also encouraging new competition to enter the market.
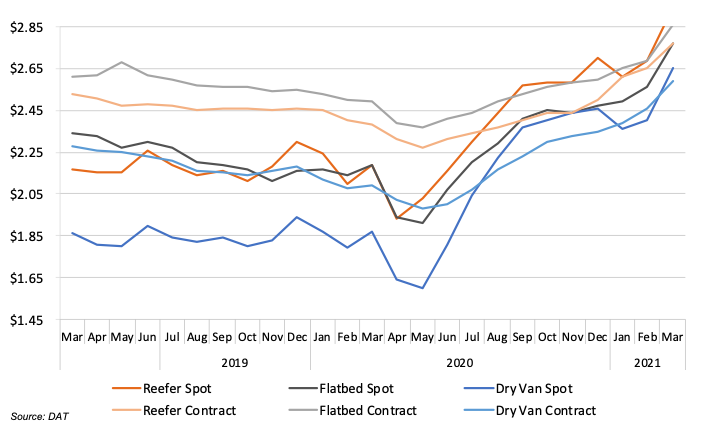
At the beginning of 2020, there were strong predictions for revenue in both the long distance and local trucking industries. Once the COVID-19 pandemic hit, revenues for both parts of the trucking industry dropped along with future revenue predictions. After a few months of lockdowns, the trucking industry began a rapid rebound as a result of businesses reopening and increased online retail. Future revenue predictions from March and April of 2021 from both the long distance and local sectors exceed predictions made in October 2020.
Industrial production and consumer spending, spurred on by the substantial stimulus programs enacted by federal government, have recovered more rapidly than initially expected. This rapid recovery has seemingly reduced the expected long-term impacts of COVID-19 on the long-distance and local trucking industries.
The effects of rising trucking rates and revenues coupled with optimistic outlooks for both categories can be seen in the number of long-distance and local trucking establishments. Lured in by appealing spot and contract rates, March 2021 predictions for the number of establishments in the trucking industry look to be on the rise. Naturally, there was a drop-off in the number of establishments in 2020, but the industry seems to have recovered with numerous new entries into the market in 2021. The long-distance trucking industry is projected to have more than one hundred thousand more establishments than originally forecasted in January of 2020.
Benefits of Hiring an Advisor When Selling Your Business
While many business owners have a general sense of what their business may be worth and a threshold selling price in mind, going at it alone in a transaction process involves more than a notion on pricing – it involves procedural awareness, attention to detail, as well as a good measure of patience despite the desire for an immediate outcome.
In most external transactions (i.e., a business owner selling to a third party rather than to family or employees) there is an acute imbalance of savvy and experience between buyers and sellers. For certain sellers who owe their business successes to personal effort, brute force, and honed skills, it’s a difficult decision and an act of faith to turn the business asset over to an advisory team.
Buyers, both financial or strategic in nature, have completed many transactions while most sellers have never bought or sold a business. Given this near universal lop-sidedness in experience and resources, sellers need to assemble a team of experienced advisors to assist in navigating unfamiliar terrain. The time intensity and distractions of the process can cause the business to suffer if ownership sacrifices on operational oversight and foregoes the attention to detail that made the business an attractive acquisition target in the first place.
We strongly recommend hiring a full transaction team composed of, at a bare minimum, three primary players:
- Transaction attorney
- Tax accountant
- Financial (sell-side) advisor
By securing a turnkey transaction team, business owners benefit from the multi-perspective expertise and overlapping skillsets of the team. The diversity and breadth of the team often facilitates proactivity and response capability for a wide variety of developments that can derail or compromise the timing, process and financial outcome of the final deal.
Benefits of Hiring a Financial Advisor
The following are a few of the many benefits of hiring a qualified sell-side advisor to assist in the transaction process.
Maximize Net Proceeds
The core components and key terms of a transaction are often complicated and sometimes deceptively obscured in the legal rhetoric of an LOI, APA or SPA. Hiring a sell-side advisor with the right experience and expertise can help business owners maximize the net proceeds from the transaction. Financial intricacies and other points of negotiation, such as working capital true-ups or contingent consideration arrangements, often require careful analysis and modeling in order to foster clear decision making regarding competing and differently structured deals.
A good sell-side advisor encourages objective comparative assessment of competing offers, negotiates key points, and helps acclimate sellers to certain realities of getting a deal done.
Negotiate Best Possible Terms
Sell-side advisors have years of experience reviewing purchase agreements and will work with ownership’s legal counsel to ensure the transaction documents accurately reflect the agreed upon value and terms. These documents can often be cumbersome and need to be reviewed and crafted with the utmost attention to detail. Experienced advisors can help streamline the fine-tuning of these documents to assist the business owner(s) in negotiating favorable (or acceptable) terms of sale.
At some point in most deals, a seller has to pick the fights worth fighting and concede on those terms that aren’t likely to change or have no real benefit. A good advisor should be frank and forthright with sellers, even when the recommendations or choices are not entirely satisfying. Sellers must be aware that a buyer needs a few wins and concessions to justify their investment. An informed seller, using the advice of a good seller representative, can better identify and prioritize the issues that impact the deal.
Drive Transaction to Closure
Seasoned sell-side advisors have often worked on hundreds of transaction engagements. This range of experience can be of great help if and when unexpected issues arise, and unexpected issues almost always arise. Sell-side advisors will work with the rest of the transaction team to manage these issues and provide the information necessary to make critical decisions regarding proposed solutions with the end-goal of driving a transaction to closure.
Confidentiality and Ownership Burden
Revealing a contemplated transaction to your employees and stakeholders can often lead to undue stress, which compounds the strain already present on ownership and management during a transaction process. With the help of a sell-side advisor, ownership and management can maintain their focus on running the business and generating profits while knowing that the transaction process is progressing in the background.
Ownership can also gain peace of mind in knowing that the transaction will become “public information” at the appropriate time, which allows the business to function normally throughout the entire process. Many of the delays and sensitivities involved in the selling process, represent the potential for unexpected breaches of information to employees and other stakeholders. Owners can avoid many water cooler dilemmas by using an outside representative who collects, organizes, and disseminates information and manages exchanges between the parties.
Conclusion
Admittedly, we are valuation and transaction advisory providers – go figure, that our advice is to retain us, if you desire strong representation that we believe will pay for itself. If you have a good business asset to sell, it’s likely you have been highly concentrated in your capital investments and your personal efforts to create that wealth. Selling such an asset is not only the opportunity to diversify your wealth but to outsource much of the pain and worry that accompanies the process of selling.
Mercer Capital offers a seasoned bench of professionals with a diversity of experience unmatched by most pure-play brokers and M&A representatives. We combine top-shelf valuation competency with a vast array of litigation, transaction advisory and consulting experience to facilitate the best available strategic outcomes for our clients. To discuss your situation in confidence, give us a call.
How Long Will It Take to Sell My Business?
That Depends on the Type of Transaction…
Ownership transitions, whether internal among family and other shareholders or external with third parties, require effective planning and a team of qualified advisors to achieve the desired outcome. In this article, we examine some “typical” timelines involved in various types of transactions.
Internal Transitions
Sale to Next Generation
Internal transitions are often undertaken in accordance with provisions outlined in the Company’s existing or newly minted buy-sell agreement. A buy-sell agreement is an agreement by and between the owners of a closely owned business that defines the terms for the purchase when an owner requires liquidity. Buy-sell agreements typically specify how pricing is determined, including the timing, the standard of value used, the level of value, and the appraiser performing the valuation.
As a matter of practicality, the timing for transfers using an existing buy-sell agreement is often dependent on the readiness of financing and the service level of the assisting legal and valuation advisory professionals. Experience suggests this can take as little as four to eight weeks, but often involves processes that can require three to six months to carry out.
In circumstances where a newly crafted buy-sell agreement is being developed, you should expect a lengthier process of at least several months so that the attending financial, valuation, and legal frameworks are satisfactorily achieved.
Mercer Capital has published numerous books on the topic of buy-sell agreements, which readers of this article should avail themselves of, or better yet, contact a Mercer Capital valuation professional to make sure you get directed to the most useful content to assist in your circumstance.
Companies with an existing buy-sell agreement and those that obtain regular appraisal work, stand the best chance of achieving a timely process. Those Companies that are embarking on their first real valuation process, and that have stakeholders who require a thorough education on valuation and other topics, should allow for a deliberate and paced process.
In the event of an unexpected need for ownership transfer (death and divorce to name a few), it is sound advice to retain a primary facilitator to administer to the potentially complex sets of needs that often accompany the unexpected.
Employee Stock Ownership Plans
The establishment of an Employee Stock Ownership Plans (ESOP) is a necessarily involved process that requires a variety of analyses, one of which is an appraisal of the Company’s shares that will be held by the plan.
For a Company with well-established internal processes and systems, the initial ESOP transaction typically requires four to six months. In a typical ESOP transaction, the Company will engage a number of advisors who work together to assist the Company and its shareholders in the transaction process. The typical “deal team” includes a firm that specializes in ESOP implementation, as well legal counsel, an accounting firm, a banker, and an independent trustee (and that trustee’s team of advisors as well).
Most modern-day ESOPs involve complex financing arrangements including senior bankers and differing types and combinations of subordinated lenders (mezzanine lenders and seller notes). There are numerous designs to achieve an ESOP installation. In general, the Company establishes and then funds the ESOP’s purchase financing via annual contributions.
ESOPs are qualified retirement plans that are subject to the Employee Retirement Income Security Act and regulated by the Department of Labor. Accordingly, ESOP design and installation are in the least, a time consuming process (plan for six months) and in some cases an arduous one that requires fortitude and an appreciation by all parties for the consequences of not getting it right up front. The intricacies and processes for a successful ESOP transaction are many.
A more detailed assessment of ESOPs is provided here on Mercer Capital’s website.
The following graphics depict the prototypical ESOP structure and the flow of funds.


External Sales
Many entrepreneurs cannot fathom why success in business may not equally apply to getting a deal done. In most external transactions, there is a significant imbalance of deal experience: today’s buyers have often completed many transactions, while sellers may have never sold a business. Accordingly, sellers need to assemble a team of experienced and trusted advisors to help them navigate unfamiliar terrain.
Without exception, we recommend retaining a transaction team composed of at least three deal-savvy players: a transaction attorney, a tax accountant, and a sell-side financial advisor. If you do not already have some of these capable advisors, assembling a strong team can require time to accomplish. Since many transactions with external buyers originate as unsolicited approaches from the growing myriad of private equity and family office investors, it is advisable to maintain a posture of readiness.
Up-to-date financial reporting, good general housekeeping with respect to accounts, inventory, real property maintenance, information technology, and the like are all part of a time-efficient transaction process. These aspects of readiness are the things that sellers can control in order to improve timing efficiency. As is often said in the transaction environment – time wounds all deals.
Sellers doing their part on the readiness front are given license to expect an efficient process from their sell-side advisors and from buyers. We do caution that selling in today’s mid-market environment ($10-$500 million deal size) often involves facilitating potentially exhaustive buyer due diligence in the form of financial, legal, tax, regulatory and other matters not to mention potentially open-ended Quality of Earnings processes used by today’s sophisticated investors and strategic consolidators. A seasoned sell-side advisor can help economize on and facilitate these processes if not in the least comfort sellers as to the inherent complexity of the transaction process.
The sell-side advisor assists ownership (or the seller’s board as the case may be) in setting reasonable value expectations, preparing the confidential information memorandum, identifying a target list of potential motivated buyers, soliciting and assessing initial indications of interest and formal bids, evaluating offers, facilitating due diligence, and negotiating key economic terms of the various contractual agreements.
The typical external transaction process takes four to seven months and is done in three often overlapping and recycling phases. While every deal process involves different twists and turns on the path to consummation, the typical external transaction process takes five to seven months and is completed in the three phases depicted in the following graphics.

CLICK HERE TO ENLARGE THE IMAGE ABOVE

CLICK HERE TO ENLARGE THE IMAGE ABOVE
Conclusion
As seasoned advisors participating on both front-end and post-transaction processes, we understand that every deal is unique. We have experienced the rush of rapid deal execution and the trying of patience in deals that required multiple rounds of market exposure. A proper initial Phase I process is often required to fully vet the practical timing required for an external transaction process.
Mercer Capital provides transaction advisory services to a broad range of public and private companies and financial institutions. We have worked on hundreds of consummated and potential transactions since Mercer Capital was founded in 1982. We have significant experience advising shareholders, boards of directors, management, and other fiduciaries of middle-market public and private companies in a wide range of industries. Rather than pushing solely for the execution of any transaction, Mercer Capital positions itself as an advisor, encouraging the right decision to be made by its clients.
Our independent advice withstands scrutiny from shareholders, bondholders, the SEC, IRS, and other interested parties to a transaction. Our dedicated and responsive team stands ready to help manage your transaction.
The Potential Buyers of Your Business
An Overview of the Different Types of Buyers for Closely Held, Mid-Market Companies
We regularly encounter business owners contemplating the dilemma of ownership transition. After years (maybe even decades) of cultivating the business through hard work, determination, and perhaps a bit of luck, many prospective sellers believe now is a sensible time to exit.
Tax changes are looming, pandemic and post-pandemic winners see solutions to a myriad of operational challenges, and valuations remain favorable in most industries. However, a seller’s timing, the readiness of the business, and the readiness of the marketplace may not be aligned without careful seller preparation and real-time market awareness.
Little do most sellers realize that their preparation, their tolerance for post-deal involvement, their health and ability to remain active, and their needs for liquidity will influence the breadth and priorities of their options and will influence who the potential buyers might be and how they might target the business. Proactivity (or backfilling for the lack thereof) will also influence the design and costs of the process for effective M&A representation.
Under ideal circumstances, the planning process for an exit will begin well before the need for an actual ownership transfer arises. One of the first steps in planning for an eventual sale is to understand who the potential buyers might be and the different characteristics of these buyers.
In this article, we discuss some exit options and summarize some of the specifics of certain types of buyers and what that could mean for transaction structure and economic outcomes.
Internal Ownership Transition
When done carefully, an internal transition can be desirable in order to protect both the existing employees and the culture of the business. Potential buyers in an internal transition generally include the next generation of the owner’s family or key employees of the company (or a mix thereof).
These transactions generally occur one of two ways: through a direct sale from the exiting owner to the next generation or through the establishment of an Employee Stock Ownership Plan (ESOP).
While these transactions may not yield the pricing or turnkey liquidity that selling to an outside buyer might, they can provide comfort to exiting owners regarding their legacy and the continuing prospects of the business as an independent going concern.
Sale to Next Generation
A key consideration in selling to family members or to employees is price. Equally important is the question of how the transaction is financed.
Internal transactions are often achieved by share redemptions in installments and/or through a leveraged buyout process. Often, the seller will provide financing using one of many potential structures.
Seller financing carries the risk of the buyer’s inability to pay, which often requires the seller to reinsert into active leadership. Many may view seller financing as acceptable, if not necessary or desirable, in order to control the terms and costs of the arrangements and to benefit from the interest payments and other terms of the financing.
As noted, a seller’s liquidity requirements and the underlying fundamental borrowing capacity of the business play a big part in determining how much third party capital can be employed. Many sellers want their buyers, family or otherwise, to have real skin in the game by way of at least partial external financing.
If the next generation of family members and/or employees are not well-situated to achieve a buyout as a concentrated ownership group, then the feasibility of a more formal collective buyer group may be a good alternative. Following is a brief overview of Employee Stock Ownership Plans, which can serve as an alternative to a concentrated internal transition.
Establishing an Employee Stock Ownership Plan
ESOPs are a proven vehicle of ownership transfer. They can provide for either an incremental or a turnkey ownership transfer. They also facilitate the opportunity for legacy owners to continue contributing to the stability and success of the business while allowing employees to reap the rewards and benefits of capital ownership.
Assessing the feasibility of an ESOP requires the advisory support of experienced financial and legal professionals who help ensure that best practices are implemented and that compliance awareness governs the transaction. To that end, owners contemplating an ESOP need to be keenly aware of the importance of following a well-designed process that satisfies the requirements of the Department of Labor and adheres to governing rules and regulations.
As a qualified retirement plan subject to regulations set forth by ERISA (Employee Retirement Income Security Act), ESOPs are regulated using strict guidelines for process, fairness, and administration. Accordingly, the entire life cycle of a contemplated ESOP needs to be studied in a process generally referred to as an ESOP Feasibility Study. Valuation, financing, plan design, plan administration, future repurchase obligations, and many other concerns must be assessed before venturing down the ESOP path.
In function, the establishment of an ESOP includes the creation of an ESOP trust, which, using one of many possible transaction structures, becomes the ultimate owner of some or all of the stock of the sponsoring ESOP company. ESOPs are unique in being the only qualified retirement plans allowed to use debt to purchase the shares of the employer corporation.
Once an ESOP is in place, the qualifying employee participants are allocated interests in the trust annually according to the Plan’s design. As employees cycle through their employment tenure, they trigger milestone events that allow for the effective sale of their accumulated ownership positions, providing a nest egg for retirement.
During their tenure of employment, the employee’s account is mostly concentrated in company stock, the valuation of which determines the amount they receive when nearing and eventually reaching retirement age. The stock accumulated during active employment is converted to cash and the plan shares are either redeemed or recycled to perpetuate the ESOP.
There are certain tax-related and transaction design features in an ESOP transaction that can benefit sellers in numerous different ways. Sellers in ESOP installations must understand the necessary complexities and nuances of a well-run ESOP transaction. Sellers lacking the patience and gumption for an ESOP process or those who require turnkey liquidity in their ownership exit should likely consider an alternative liquidity strategy.
External Sale
In general, the ability to sell your business to an external party yields the highest proceeds. If you have succeeded in creating a sustainable business model with favorable prospects for growth, your business assets may generate interest from both strategic and financial buyers.
The Strategic Buyer
A strategic buyer is usually a complementary or competitive industry player within your markets or looking to enter your markets.
Strategic buyers can be generally characterized as either vertical or horizontal in nature. Such buyers are interested in the natural economies of scale that result from an expanded market area (cost and operational leverage in our terminology) and/or from specific synergies that create the opportunity for market and financial accretion (think 1 + 1 = 3).
There is a good chance that a potential strategic buyer for your business is someone or some group you already know. Such buyers don’t require the full ground-up familiarization process because they are already in tune with the risk and growth profiles of the business model. Accordingly, owners interested in a turnkey, walk-away sale of their business are often compelled toward a strategic buyer since strategic buyers can quickly integrate the seller’s business into their own.
The moving parts of transaction consideration paid by strategic buyers can cover a broad spectrum. We see simple, nearly 100% cash deals, as well as deals that include various forms of contingent consideration and employment/non-compete agreements.
Most sellers in strategic deals are not inclined to work for their buyers other than in a purely consultative role that helps deliver the full tangible and intangible value the buyer is paying for. In many cases, strategic buyers want a clean and relatively abrupt break from prior ownership in order to hasten the integration processes and cultural shift that come with a change in control.
Additionally and/or alternatively, strategic deals may include highly tailored earn-outs that are designed with hurdles based on industry-specific metrics. In general, earn-outs are often designed to close gaps in the bid/ask spread that occur in the negotiation process. These features allow sellers more consideration if post-transaction performance meets or beats the defined hurdles and vice versa. Sellers must be aware of the sophisticated means by which larger strategic buyers can creatively engineer the outcomes of contingent consideration.
In certain industries strategic buyers may structure consideration as part cash and part or all stock. Sellers in the financial sector are often selling equity ownership as opposed to the asset sales that dominate most non-financial sectors. In such deals, sellers who take equity in the merged entity must be cognizant of their own valuation and that of the buyer. The science of the exchange rate and the post-closing true-ups that may apply are areas in which sellers should seek skilled professional advisory guidance.
The Financial Buyer
Financial buyers are primarily interested in the returns achieved from their investment activities. These returns are achieved by the conventions of 1) traditional opportunistic investment and 2) by means of sophisticated front-end and back-end financial engineering with respect to the original financing and the subsequent re-financings that often occur.
Most traditional buy-out financial investors are looking to satisfy the specific investment criteria of their underlying fund investors, who have signed on for a targeted duration of investment that, by nature, requires the financial investor to achieve a secondary exit of the business within three to seven years after the original acquisition (the house flipping analogy is a clear but oversimplified one). Financial investors may have significant expertise acquiring companies in certain industries or may act as generalists willing to acquire different types of businesses across different industries.
In general, there are three types of financial buyers:
- Private Equity Groups or other Alternative Financial Investors
- Permanent Capital Providers
- Single/Multi-Family Offices
Despite their financial expertise, financial buyers usually do not have the capacity or knowledge to assume the management of the day-to-day operations of all of their business investments. As such, the seller’s management team at the time of a sale will likely remain involved with the Company for the foreseeable future. A sale to a financial investor can be a viable solution for ownership groups in which one owner wants to cash out and completely exit the business while other owners remain involved (rollover) with the business.
With respect to work force and employee stability, financial investors will ultimately seek maximum efficiency, but they often begin the process by making sure they secure the services of both frontline and managerial employees. In many cases, the desired growth of such investors can bolster the employment security of good employees while screening out those that resist change and impede progress.
The value of the assembled workforce is becoming a more meaningful asset to prospective buyers in the marketplace, whether they be strategic or financial in nature. Further, larger acquirers often can present employees with a more comprehensive benefit package and enhanced upward mobility in job responsibility and compensation. All this said, financial investors will ultimately seek to optimize their returns with relentless efficiency.
Lastly, as the financial buyer universe has matured over the past 20+ years, we have witnessed directly that many strategic consolidators are platform businesses with private equity sponsorship, which blurs or even eliminates the notion of a strictly strategic or financial buyer in many industries.
Conclusion
An outside buyer might approach you with an offer that you were not expecting, you and your partners might decide to put the business on the market and seek offers, or you and your partners might opt for an internal sale. Whatever the case may be, most owners only get to sell their business once, so you need to be sure you have experienced, trustworthy advisors in your corner.
Mercer Capital provides transaction advisory services to a broad range of public and private companies and financial institutions. We have worked on hundreds of consummated and potential transactions since Mercer Capital was founded in 1982. We have significant experience advising shareholders, boards of directors, management, and other fiduciaries of middle-market public and private companies in a wide range of industries.
Rather than pushing solely for the execution of any transaction, Mercer Capital positions itself as an advisor to inform sellers about their options and to encourage market-based decision making that aligns with the personal priorities of each client.
Our independent advice withstands scrutiny from shareholders, bondholders, the SEC, IRS, and other interested parties to a transaction. Our dedicated and responsive team stands ready to help you manage the transaction process.
Labor Shortage in Trucking Industry Leading to a Rise in Consumer Pricing
A truck driver’s lifestyle is typically portrayed as being lackluster due to exhausting work hours and countless days away from home. As a result of the work environment for a driver, prospects debating entering the labor force in this career field ponder whether driving would be an enjoyable lifestyle. Due to the notion that the younger generation typically finds a career path in trucking unappealing, the demographics of this industry lean towards older males with 27% of truck drivers being over the age of 55 and the median age being 46.
Once the COVID-19 pandemic hit the United States in 2020, the demand for truck drivers increased sharply as many consumers turned towards online shopping. Even though trucking services were in high demand, the trucking industry struggled to grow its workforce during this time period.
Many eligible drivers elected to enter early retirement rather than waiting to return to work at the conclusion of the pandemic. Additionally, many prospects in the job market feel that they can achieve better working conditions and benefits along with similar wages working somewhere besides the transportation industry. Driver turnover is another factor that contributes to the abundance of available positions. Historically, truck drivers have a yearly turnover rate of 87%. During the 4th quarter of 2020, truck driver turnover reached 92%. High turnover rates coupled with mediocre working conditions have directly contributed to the current driver shortage that the United States is facing today. We last looked at this driver shortage in December 2018 – the situation has not changed and driver hiring and retention remains a concern for many trucking companies.
Logistics companies have been forced to raise wages for their current drivers. Many have seen wage increases of up to 50% since 2018 due to lack of available drivers throughout the U.S. Leah Shaver, CEO of the National Transportation Institute told Transport Topics that the ongoing duration of driver shortage is leaving companies with no choice but to raise pay. “For the last few weeks, it seems every couple of hours, some fleet is increasing pay,” she said. “The fleets are telling us because capacity is so tight, they could do four times the amount of work, if only they had enough drivers.” It harkens back to basic supply and demand – increasing wages for truck drivers is an approach that many transportation companies have instituted in order to fill vacant driver positions.
Hiking wages for drivers has had a serious economic impact on the economy. Elevated wages for drivers have forced retailers to increase their prices. Retailers reason that they must raise their prices as a result of the increased shipping costs so that they can maintain their current profit margins. As a result, the consumer price index has been steadily on the rise every month in 2021. The CPI surged 4.2% in April, 2021, causing it to reach a 13 year high surpassing pre-Recession levels. For the 12 months ending March 31, 2021, the CPI increased 2.6% overall, with food prices seeing a rise of 3.5% and energy prices skyrocketing 13.2%.
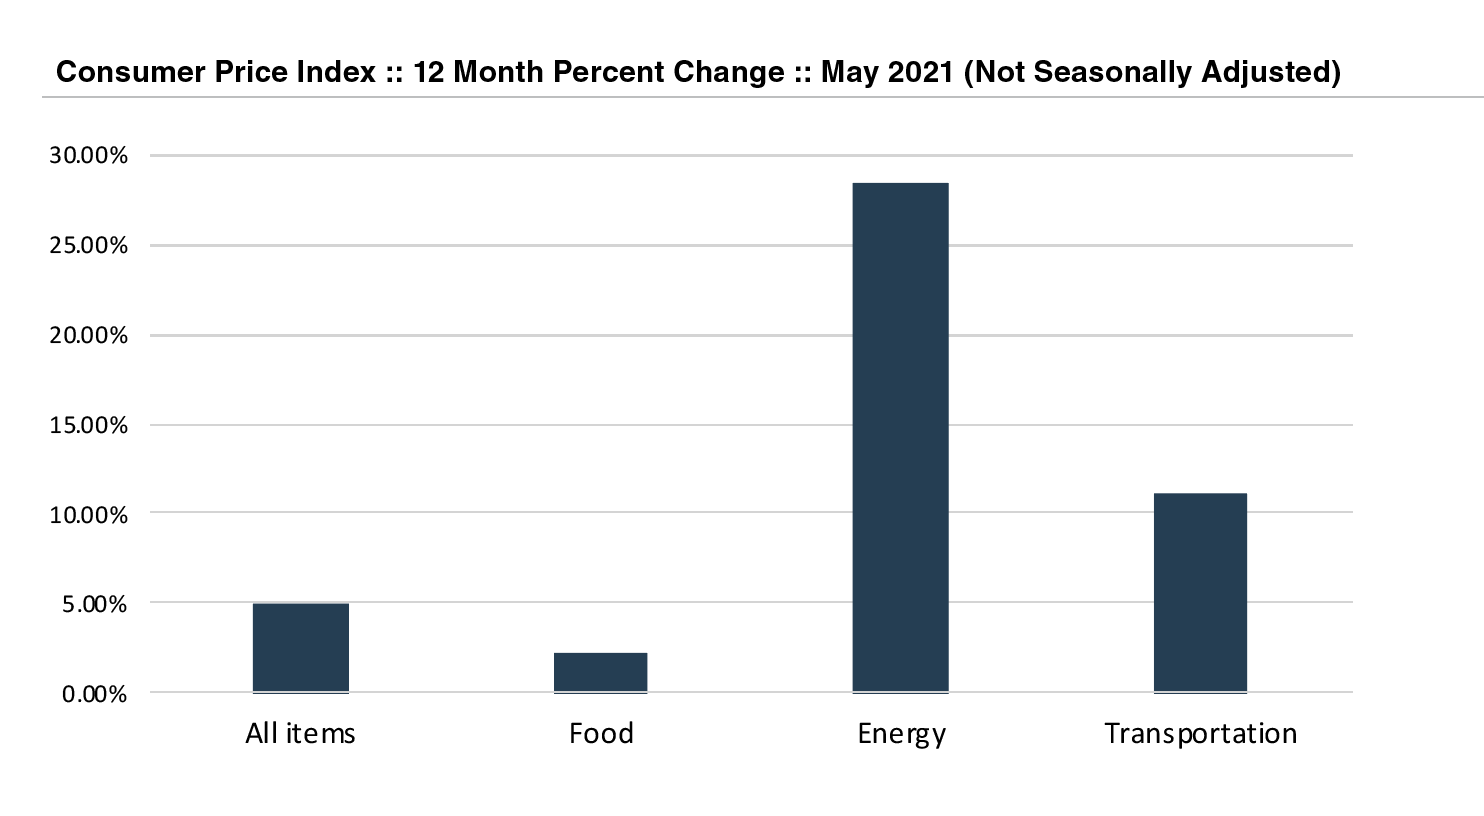
Navigating Tax Returns: Tips and Key Focus Areas for Family Law Attorneys and Divorcing Individuals/Business Owners – Part I
Part I of III- Form 1040
This is a three-part series where we focus on key areas to assist family lawyers and divorcing parties.
Form 1040 is used by taxpayers to file an annual income tax return. It calculates the total taxable income of the taxpayer(s) and determines the amount that should be paid or refunded. There are five filing statuses – single, married filing jointly, married filing separately, head of household, and qualified widow(er) with dependent children.
Why Would Form 1040 Be Important In Divorce Proceedings?
Form 1040 provides a general understanding of a taxpayer’s financial status and can be a guide to finding additional information about one’s finances. It can serve as a starting point to get a picture of an individual’s (or couple’s) income(s), assets and liabilities, and lifestyle. Form 1040 is supplemented with additional schedules and documentation which lend detail and insight into one’s lifestyle and financial matters. Ultimately, for divorce purposes, multiple years of tax returns should be reviewed and can be a source of inputs for the marital estate subject to division, as well as data for further financial analyses like income determination and lifestyle analysis/pay and need analysis.
Below is a snapshot from Form 1040:
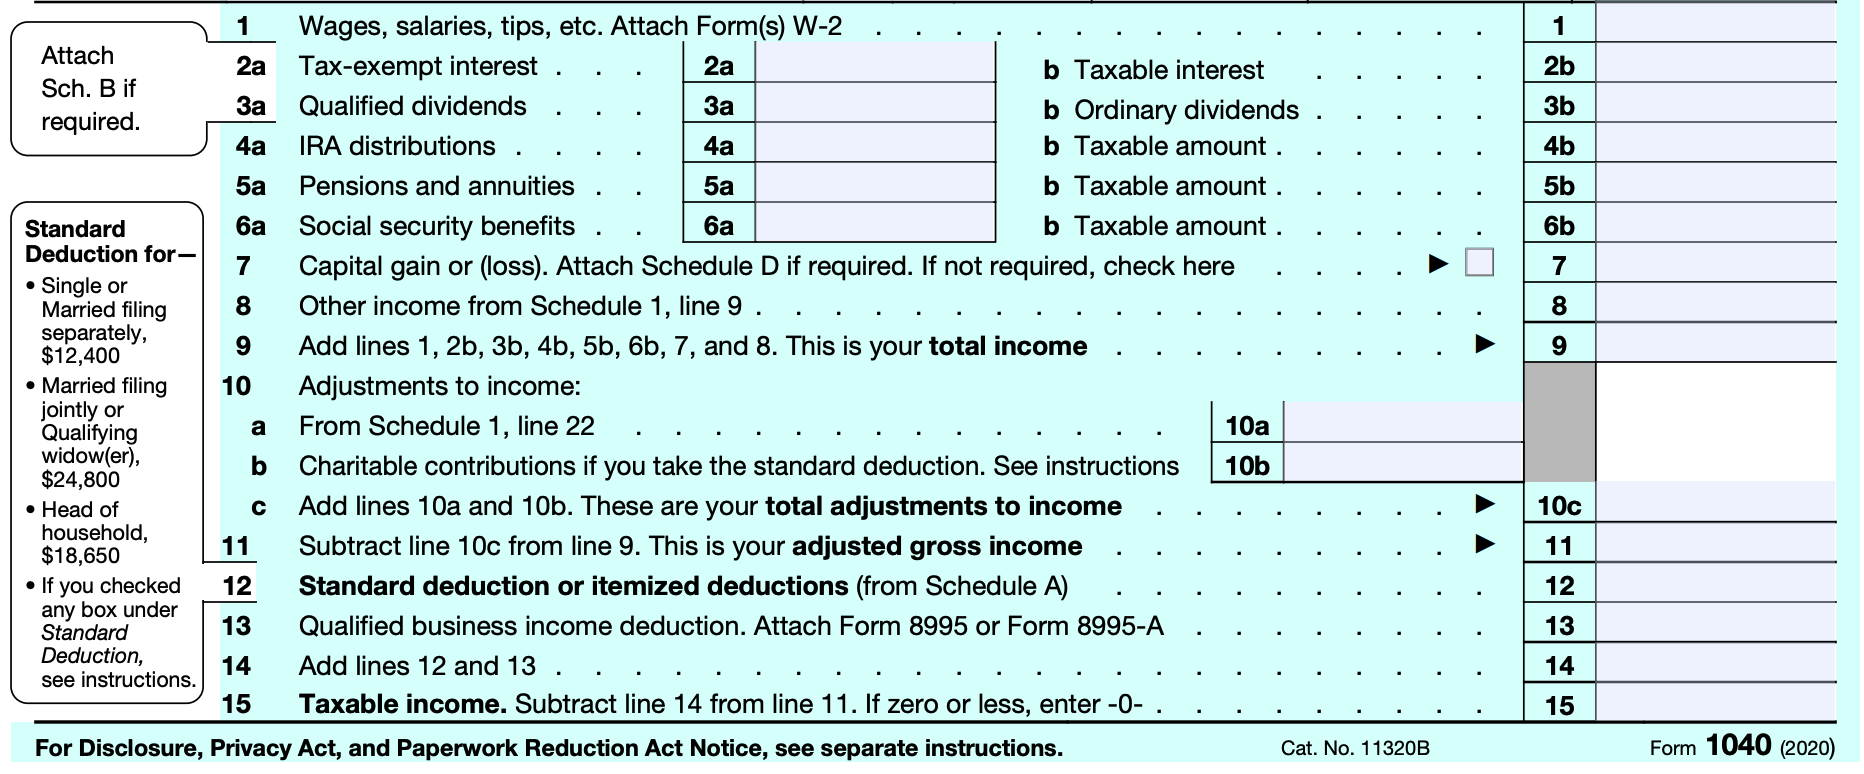
Key Areas of Focus for Family Law Attorneys and Divorcing Parties
Line 1: Wages, Salaries, and Tips – Line 1 details wages, salaries, and tips. This amount should match the income reported in Box 1 of the Form W-2. The amount on Line 1 is not gross income. It is likely that there are pre-tax deductions, such as contributions to a 401(k) account. You should refer to the underlying W-2(s) for more information about these deductions as well as gross income.
Line 2 & Line 3: Interest and Dividends – An entry in Line 2 indicates interest income, while an entry in Line 3 indicates dividend income. Both point to ownership of assets and documentation of these assets should be requested. Furthermore, income earned from interest and dividends can be considered as a source of income when calculating spousal and child support. Details about interest and dividend income can be found on Schedule B, Form 1099-INT, and Form 1099-DIV
Line 4: IRA Distributions – An entry in Line 4 shows distribution from an individual retirement account, signaling that the taxpayer has an IRA account and documentation of these assets should be requested. A withdrawal from a retirement account may also point to possible dissipation of marital assets, if not readily identifiable or available by account documentation. Details about retirement distributions are on Form 1099-R.
Line 5: Pensions and Annuities – An entry in Line 5 indicates existence of pensions and annuities, which may be wholly or partially marital property. These must be carefully considered for property division as well as sources of income when calculating spousal and child support.
Line 6: Social Security Benefits – Like pensions, Social Security benefits should be considered as sources of income when calculating spousal and child support. Details can be found on Form SSA-1099, which is a form provided to the taxpayer who receives these benefits. Estimates of an individual’s future monthly payments can be extracted from the Social Security Administration website.
Line 7: Capital Gains or Losses – Line 7 indicates capital gains or losses, which means that an asset (or multiple assets) was sold and some sort of monies were made or lost on the transaction. Not only does this information indicate ownership of assets, it can also be important in tracing analyses as well as other forensic analyses when reviewing several years of tax returns. Details can be found in Schedule D and Form 8949.
Line 8: Other Income – An entry in Line 8 should be reviewed further as it often indicates income from gambling winnings or other unusual sources (for example, prizes, jury duty pay, or the taxable portion of disaster relief payments). Information about the sources of other income can be found in Form 1099-MISC (miscellaneous income) or Form W-2G (which is a form that records gambling winnings). However, these incomes are typically not recurring in nature, and are not always reported which may require scrutiny and potential forensic analyses.
Line 9: Total Income –This line is the summation of above lines and yields total income of the taxpayer and can give you information about how the taxpayer earns their income. This number may be used when determining spousal or child support as it does not include any adjustments.
Line 11: Adjusted Gross Income – Adjusted Gross Income (AGI) is the amount used to determine one’s taxable income. The AGI is total income less adjustments. A few common adjustments are deductions for educator expenses, health savings account deductions, and student loan interest deductions. Many of these adjustments are optional, and excessive use could potentially be used to skew spousal or child support amounts. Therefore, gross income (line 9) is often considered over AGI when determining spousal or child support amounts. More information on the adjustments claimed can be found on Schedule 1.
Line 13: Qualified Business Income (QBI) Deduction – If the taxpayer is taking this deduction, it indicates that they own a business, which should lead to requests for related business documents. The QBI deduction is for pass-through businesses, therefore, a Schedule C or Schedule K-1 should also be included with the tax return. Examples of pass-through businesses are sole proprietorships, LLCs, partnerships, and S-Corporations.
Line 37: Amount You Owe Now – Line 37 indicates the incremental amount owed based on the total tax liability less any federal tax withholding, estimated payments, and credits. Reviewing the amount owed or amount to be refunded over several years can potentially uncover intentional over or under payment. However, business owners or self-employed individuals who pay quarterly taxes may have fluctuating incomes from year to year. It is important to understand that quarterly tax payment estimates are based on prior year realized income levels, which may or may not be the reason for over or under payment. A financial expert can accurately assess these types of scenarios.

Conclusion
Knowing how to navigate key areas of Form 1040 can be quite useful in divorce proceedings. Information within the tax return can provide support for marital assets and liabilities, determination of spousal and child support, and potential further analyses. Reviewing multiple years of tax returns is typical as multi-year overviews may reveal trends, provide helpful information, and may even indicate the need for potential forensic investigations.
While we do not provide tax advice, Mercer Capital is a national business valuation and financial advisory firm and we provide expertise in the areas of financial, valuation, and forensic services.
Estate of Michael J. Jackson v. Commissioner – Key Takeaways
It is imperative for estate planners to engage valuation analysts that perform the proper procedures and follow best practices when performing valuations for gift and estate planning purposes. It is necessary to have a well-supported valuation because these reports are scrutinized by the IRS and may end up going to court. The recent decision by the U.S. Tax Court in Estate of Michael J. Jackson v. Commissioner provides several lessons and reminders for valuation analysts, and those that engage valuation analysts, to keep in mind when performing valuations for gift and estate planning purposes.
Michael Jackson, the “King of Pop,” passed away on June 25, 2009. His Estate (the “Estate”) filed its 2009 Form 706, United States Estate (and Generation-Skipping Transfer) Tax Return, listing the value of Jackson’s assets. After auditing the Estate’s tax return, the Commissioner of the Internal Revenue Service (the “Commissioner”) issued a notice of deficiency that concluded that the Estate had underpaid Jackson’s estate tax by a little more than $500 million. Because the valuation of some assets were considered to be so far off, the Commissioner also levied penalties totaling nearly $200 million on the Estate. The IRS and the Estate settled the values of several assets outside of court. The case involved three contested assets of Michael Jackson’s estate:
- Jackson’s Image and Likeness
- Jackson’s interest in New Horizon Trust II (“NHT II”) which held Jackson’s interest in Sony/ATV Music Publishing, LLC, a music-publishing company
- Jackson’s interest in New Horizon Trust III (“NHT III”) which contained Majic Music, a music-publishing catalog
We discuss the key topics that the Tax Court ruled on and addressed that inform valuation analysts in the preparation of quality valuation reports.
Known or Knowable
It is important that valuation analysts only rely on information that was known or knowable at the valuation date.
In the decision, the Tax Court rejects the analysis of experts on several occasions for using information that was “unforeseeable at the time of Jackson’s death.” The Tax Court goes on to state that “foreseeability can’t be subject to hindsight.”
It can be difficult to distinguish and depend on only the information known or knowable at the valuation date especially when a significant amount of time has passed between the current date and the valuation date. Therefore, a careful examination of all sources of information is necessary to be sure that it can be relied upon in the analysis.
As can be seen from the Tax Court’s opinion, valuation analysts and experts can undermine their credibility by relying on information that was not known or knowable at the valuation date.
Tax Affecting S Corporations
The Tax Court, in this specific case, did not accept the tax affecting of S Corporations: “The Estate’s own experts used inconsistent tax rates. They failed to explain persuasively the assumption that a C corporation would be the buyer of the assets at issue. They failed to persuasively explain why many of the new pass-through entities that have arisen recently wouldn’t be suitable purchasers. And they were met with expert testimony from the Commissioner’s side that was, at least on this very particular point, persuasive in light of our precedent. This all leads us to find that tax affecting is inappropriate on the specific facts of this case.” The Tax Court did, however, leave room for the possibility of tax affecting being appropriate by stating, “we do not hold that tax affecting is never called for.”
At Mercer Capital, we tax affect the earnings of S corporations and other pass-through entities. Given that this issue continues to be a point of contention, it is imperative that valuation analysts provide a thorough analysis and clear explanation for why tax affecting is appropriate for S corporations and other tax pass-through entities.
Developing Projected Cash Flows
In the valuation of NHT II, the Court found it more reasonable to use the projections of Sony/ATV in the development of a forecast used in the income approach rather than relying on historical financial performance to inform the projection. The Tax Court based its decision on the fact that “the music-publishing industry was (and has remained) in a state of considerable uncertainty created by a long series of seismic technological changes. We think that projections of future cashflow, if made by businessmen with an incentive to get it right, are more likely to reflect reasonable estimates of the short-to-medium-term effects of these wild changes in the industry that even experts, much less judges, are unlikely to intuit correctly.”
This decision makes it clear that valuation analysts need to fully understand the industry in which the company operates and develop a forecast that is most reasonable given the information available as of the valuation date.
In cases where analysts have access to a projection developed by management, valuation analysts should have a clear, well-reasoned rationale for not relying on the forecast should they decide not to use it in the analysis. However, valuation analysts should not blindly accept management’s forecasts as truth but should perform proper due diligence to assess the reasonability of the forecast and clearly articulate any deviations from management’s forecast.
Other Topics Addressed
A few other topics of note are addressed throughout the decision that can help valuation analysts provide reliable valuation analyses.
On more than one occasion, the Tax Court sided with the expert that provided a compelling explanation for the use of a certain assumption rather than arbitrarily using an assumption without explanation. The Tax Court also sided with one expert simply because they provided a clear citation for their source when another expert did not. The Tax Court also called out the inconsistency of an expert in their report and testimony. These topics addressed by the Tax Court demonstrate that consistently explaining and citing the sources of assumptions and key elements of the valuation analysis help to produce a supportable valuation
analysis.
Finally, the expert for the Commissioner seriously damaged their credibility in the eyes of the Tax Court when the expert was caught in a couple lies during the trial. The Tax Court found that the expert “did undermine his own credibility in being so parsimonious with the truth about these things he didn’t even benefit from being untruthful about, as well as not answering questions directly throughout his testimony. This affects our fact finding throughout.”
Takeaways & Conclusion
The table below presents the valuation conclusions of the Estate, Commissioner, and the Tax Court at trial. This decision has shown that it is critical for valuation analysts to present quality valuation reports that are clear, supported, and follow accepted best practices.

At Mercer Capital, estate planners can be confident that we follow the proper procedures, standards, and best practices when performing our valuations for gift and estate planning. Mercer Capital has substantial experience providing valuations for gift and estate planning as well as expert witness testimony in support of our reports. Please do not hesitate to contact one of our professionals to discuss how Mercer Capital may be able to help your estate planning needs.
What Does the Step-Up in Basis Tax Proposal Mean for High Net Worth Individuals and Family Businesses?
Recently, the Biden Administration announced elements of its tax agenda in the American Families Plan. The Biden Administration aims to make some significant changes to current tax law.
These changes are highlighted by the following:
- Increasing the top capital gains tax rate to 39.6%
- Increasing the top federal income tax rate to 39.6%
- Increasing the corporate tax rate to 28%
Another substantial proposal includes the elimination of the step-up in basis. The potential elimination of the step-up in basis presents an estate planning opportunity to high-networth individuals and family business owners or should at least spur them to contemplate revisiting their estate plans.
What Is the Step-Up In Basis?
The step-up in basis refers to the current tax environment that allows individuals to transfer appreciated assets at death to their heirs at the current market value without heirs having to pay capital gains taxes on the unrealized capital appreciation of those assets that occurred during the individual’s life. In other words, heirs currently benefit from a “step-up” in tax basis of inherited assets to the market value on the day of death, and no taxes are paid on unrealized capital appreciation of the assets.
Biden Administration Proposal
The Biden Administration is proposing to eliminate this step-up in basis. This means that the heir would be responsible for the taxes on the unrealized capital appreciation of the assets being transferred as if the assets had been sold. This would result in a large tax burden on the heir especially when considering that the Biden Administration is also aiming to increase the top capital gains tax rate to 39.6%. Specifically, the proposal would end the step-up in basis for capital gains What Does the Step-Up in Basis Tax Proposal Mean for High Net Worth Individuals and Family Businesses? in excess of $1 million (or $2.5 million for couples when combined with existing real estate exemptions). So, the first $1 million of unrealized capital gains would be exempt from taxes and only the excess would be taxed. However, the proposal does state that “the reform will be designed with protections so that family-owned businesses and farms will not have to pay taxes when given to heirs who continue to run the business.” These protections and exemptions seem to provide some relief for family businesses, but the details of the protections have yet to be specified.
Takeaways
These proposals are certainly not set in stone and may change as the proposals are debated and legislature eventually makes its way through Congress. However, the Biden Administration’s current tax proposals could have a significant impact on the estate planning environment.
The potential elimination of the step-up in basis is yet another reason for high-net-worth individuals and family business owners to make estate plans or revisit their current estate planning techniques. When considered alongside other Biden Administration proposals such as an increase in the capital gains tax and the fact that the increased lifetime gift and estate tax exclusion limits are set to sunset in 2025, now is a great time to have a conversation about planning. Contact a professional at Mercer Capital to discuss your specific situation in confidence.
Fairness Opinions
Evaluating a Buyer’s Shares From the Seller’s Perspective
M&A activity in North America (and globally) is rebounding in 2021 after falling to less than $2.0 trillion of deal value in 2020 for just the second time since 2015 according to PitchBook; however, deal activity has accelerated in 2021 and is expected to easily top 2020 assuming no major market disruption due to a confluence of multiple factors.
- Most acquirers whose shares are publicly traded have seen significant multiple expansion since September 2020;
- Debt financing is plentiful at record low yields;
- Private equity is active; and,
- Hundreds of SPACs have raised capital and are actively seeking acquisitions.
The rally in equities, like low borrowing rates, has reduced the cost to finance acquisitions because the majority of stocks experienced multiple expansion rather than material growth in EPS. It is easier for a buyer to issue shares to finance an acquisition if the shares trade at rich valuation than issuing “cheap” shares.
As of June 3, 2021, the S&P 500’s P/E based upon trailing earnings (as reported) was 44.9x compared to the long-term average since 1871 of 16x. Obviously trailing earnings were depressed by the impact of COVID-19 on 2020 earnings, but forward multiples are elevated, too. Based upon consensus estimates for 12 months ended March 31, 2022, the S&P 500 is trading for 21x earnings.
High multiple stocks can be viewed as strong acquisition currencies for acquisitive companies because fewer shares have to be issued to achieve a targeted dollar value. As such, it is no surprise that the extended rally in equities has supported deal activity this year. However, high multiple stocks may represent an under-appreciated risk to sellers who receive the shares as consideration. Accepting the buyer’s stock raises a number of questions, most which fall into the genre of: what are the investment merits of the buyer’s shares? The answer may not be as obvious as it seems, even when the buyer’s shares are actively traded.
Our experience is that some if not most members of a board weighing an acquisition proposal do not have the background to thoroughly evaluate the buyer’s shares. Even when financial advisors are involved there still may not be a thorough vetting of the buyer’s shares because there is too much focus on “price” instead of, or in addition to, “value.”
A fairness opinion is more than a three or four page letter that opines as to the fairness from a financial point of a contemplated transaction; it should be backed by a robust analysis of all of the relevant factors considered in rendering the opinion, including an evaluation of the shares to be issued to the selling company’s shareholders. The intent is not to express an opinion about where the shares may trade in the future, but rather to evaluate the investment merits of the shares before and after a transaction is consummated.
Key questions to ask about the buyer’s shares include the following:
- Liquidity of the Shares – What is the capacity to sell the shares issued in the merger? SEC registration and even NASADQ and NYSE listings do not guarantee that large blocks can be liquidated efficiently. Generally, the higher the institutional ownership, the better the liquidity. Also, liquidity may improve with an acquisition if the number of shares outstanding and shareholders increase sufficiently.
- Profitability and Revenue Trends – The analysis should consider the buyer’s historical growth and projected growth in revenues, operating earnings (usually EBITDA or EBITDA less capital expenditures) in addition to EPS. Issues to be vetted include customer concentrations, the source of growth, the source of any margin pressure and the like. The quality of earnings and a comparison of core vs. reported earnings over a multi-year period should be evaluated.
- Pro Forma Impact – The analysis should consider the impact of a proposed transaction on revenues, EBITDA, margins, EPS and capital structure. The per share accretion and dilution analysis of such metrics as earnings, EBITDA and dividends should consider both the buyer’s and seller’s perspectives.
- Dividends – In a yield starved world, dividend paying stocks have greater attraction than in past years. Sellers should not be overly swayed by the pick-up in dividends from swapping into the buyer’s shares; however, multiple studies have demonstrated that a sizable portion of an investor’s return comes from dividends over long periods of time. If the dividend yield is notably above the peer average, the seller should ask why? Is it payout related, or are the shares depressed? Worse would be if the market expected a dividend cut. These same questions should also be asked in the context of the prospects for further increases.
- Capital Structure – Does the acquirer operate with an appropriate capital structure given industry norms, cyclicality of the business and investment needs to sustain operations? Will the proposed acquisition result in an over-leveraged company, which in turn may lead to pressure on the buyer’s shares and/or a rating downgrade if the buyer has rated debt?
- Balance Sheet Flexibility – Related to the capital structure should be a detailed review of the buyer’s balance sheet that examines such areas as liquidity, access to bank credit, and the carrying value of assets such as deferred tax assets.
- Ability to Raise Cash to Close – What is the source of funds for the buyer to fund the cash portion of consideration? If the buyer has to go to market to issue equity and/or debt, what is the contingency plan if unfavorable market conditions preclude floating an issue?
- Consensus Analyst Estimates – If the buyer is publicly traded and has analyst coverage, consideration should be given to Street expectations vs. what the diligence process determines. If Street expectations are too high, then the shares may be vulnerable once investors reassess their earnings and growth expectations.
- Valuation – Like profitability, valuation of the buyer’s shares should be judged relative to its history and a peer group presently and relative to a peer group through time to examine how investors’ views of the shares may have evolved through market and profit cycles.
- Share Performance – Sellers should understand the source of the buyer’s shares performance over several multi-year holding periods. For example, if the shares have significantly outperformed an index over a given holding period, is it because earnings growth accelerated? Or, is it because the shares were depressed at the beginning of the measurement period? Likewise, underperformance may signal disappointing earnings, or it may reflect a starting point valuation that was unusually high.
- Strategic Position – Assuming an acquisition is material for the buyer, directors of the selling board should consider the strategic position of the buyer, asking such questions about the attractiveness of the pro forma company to other acquirers?
- Contingent Liabilities – Contingent liabilities are a standard item on the due diligence punch list for a buyer. Sellers should evaluate contingent liabilities too.
The list does not encompass every question that should be asked as part of the fairness analysis, but it does illustrate that a liquid market for a buyer’s shares does not necessarily answer questions about value, growth potential and risk profile. We at Mercer Capital have extensive experience in valuing and evaluating the shares (and debt) of financial and non-financial service companies garnered from over three decades of business.
Not All MOEs Are Created Equal
In the December 2020 BankWatch, we provided our M&A outlook for 2021 and touched on themes that we believed would drive deal activity for the year. Our view was that the need to reduce costs in the face of revenue pressure would create urgency for banks to engage in M&A and lead to increased deal activity, given that credit quality remained stable and the economy avoided a double-dip recession.
Specifically, we noted that these drivers may cause mergers of equals (“MOEs”) to see more interest. Indeed, four of the largest bank deals in 2020 were structured as MOEs or quasi-MOEs (low premium transactions), and we believed the trend would only gain more traction as economic clarity emerged.
Thus far in 2021, against the backdrop of economic reopening, stable asset quality, and favorable bank stock performance, deal activity in the industry has picked up, and MOEs remain a hot topic. S&P Global Market Intelligence reported 53 U.S. bank deals year-to date through April 30, compared to 43 during the same period in 2020. The pace increased notably in April as 19 deals were announced in the month, including two large MOEs. BancorpSouth (BXS) announced a merger with Cadence (CADE) on April 12, and Webster (WBS) announced a deal with Sterling Bancorp (STL) one week later on April 19.
U.S. Bank MOEs by Year
# of Announced Deal

Bank MOEs are not a new concept, but they have occurred more frequently over the past several years, with the most notable being the BB&T – SunTrust combination to form Truist Financial (TFC). The BB&T-SunTrust combination has been reasonably well received, while it is perhaps early to judge some of the more recent deals. These types of transactions certainly have their merits and can appear strategically and financially compelling. However, MOEs involve a number of risks that should not be overlooked. For management teams considering an MOE, it is important to assess both the benefits and potential risks of such a deal.

CLICK HERE TO ENLARGE THE CHART ABOVE
BENEFITS
Reduce Costs
Perhaps the most apparent benefit is the opportunity to reduce costs and improve operational efficiency. This is especially valuable in the current environment as revenue growth opportunities are limited. Reported estimates for cost savings in recent MOEs have been on the order of 10% to 15% of the combined expense base. These savings are often achieved by consolidating back office and administrative functions and/or right-sizing the branch network. With the increased adoption of digital banking, branch networks have become less central to banks’ business models and can be a drag on efficiency. MOEs provide management teams an opportunity to re-evaluate their banks’ physical distribution systems and reap the benefits of optimizing the branch network.

CLICK HERE TO ENLARGE THE CHART ABOVE
Invest in Technology
The savings from efficiencies and branch consolidation can be invested in upgrading the bank’s technological capabilities. Almost all recent merger press releases include some type of statement indicating management’s intent to invest in the pro forma bank’s digital capabilities. While the specifics of such investments are often not disclosed, it is clear that management teams view the ability to invest in technology as a key piece of the rationale for merging. By gaining scale, banks can dedicate the necessary resources to develop sophisticated financial technology solutions.
Expand Footprint
With a challenging loan growth outlook, many banks are considering entering new markets with favorable demographic characteristics. Unlike a de novo strategy or a series of small acquisitions, an MOE provides an opportunity to quickly establish a sizeable presence in a desired market. In merging with Cadence, BancorpSouth will in a single transaction more than double its deposit base in Texas where it previously had been acquiring smaller banks, with three sub-$500 million asset bank acquisitions since 2018. As banks look to position themselves for growth, MOEs are a potentially attractive option to gain meaningful exposure to new markets.
Diversify Revenue Stream
A merger offers opportunities to diversify the revenue stream by either gaining new lending expertise or entering a new fee income line of business. The more retail-focused First Citizens Bancshares will significantly diversify its lending profile when it completes its combination with the commercial-oriented CIT Group, announced in October of last year. Similarly, IberiaBank diversified its revenue stream by combining with First Horizon which has a sizeable fixed income operation. As revenue growth remains challenging, management teams should consider if a transaction might better position their bank for the current environment.
RISKS
While an MOE can offer benefits on a larger scale, it also presents risks on a larger scale. The risks detailed below largely apply to all mergers and are amplified in the case of an MOE.
Culture
Culture is often the arbiter between success and failure for an MOE. Each of the subsequent risks detailed in this section could be considered a derivative of culture. If two banks with conflicting management philosophies combine, the result is predictable. The 1994 (admittedly before my time) combination of Society Corporation and KeyCorp was considered a struggle for several years as Society was a centralized, commercial-lending powerhouse while KeyCorp was a decentralized, retail-focused operation. Potential merger partners need to honestly assess cultural similarities and differences and evaluate the proposed post-merger management structure before moving forward.
It is also important that merging banks be on the same page regarding post-merger ambitions. If one views the merger as “fattening itself up” for a future acquirer while the other desires to remain independent, they will likely diverge in their approach to other strategic decisions. When executives or board members frequently clash, the pro forma entity will struggle.
Staff Retention
There is usually some level of employee fallout with an acquisition, but if enough key employees leave or are poached by competitors, the bank’s post-merger performance will suffer. This is an especially important consideration when acquiring a bank in a new market or with a unique lending niche. If employees with strong ties to the communities in a new market leave for a competitor, it will be difficult to gain traction in that market. Likewise, a new lending specialty or business line can fail if those with the knowledge and experience to run it do not stick around for long.
Execution/Integration
Acquiring a bank of the same or similar size requires a tremendous amount of effort. Loan and deposit systems must be consolidated, customers from the acquired bank must be onboarded to the new bank’s platforms, and branding must be updated across the franchise. If the acquirer’s management team has little experience with acquisitions, successfully integrating with a large partner may prove difficult. When considering an MOE, the acquiring bank must assess what tasks will be necessary to combine the operations of the two organizations and achieve the projected cost savings. Management teams must consider whether their organization has the expertise to do that or, if not, what external resources would be needed.
Credit
Credit quality issues from an acquired loan portfolio can come back to bite a bank years after the acquisition. Merger partners need to be sure they have performed thorough due diligence on each bank’s loan portfolio and are comfortable with the risk profile. While recent credit quality concerns in the industry have not materialized and greater economic clarity has emerged, would-be acquirers need not be lulled to sleep by the current credit backdrop. The past year has shown that the future is unpredictable, and that forecasts are not always correct.

CLICK HERE TO ENLARGE THE CHART ABOVE
Adverse Market Reaction
In recent MOEs and low premium transactions, acquirers’ shares have faced an adverse reaction from investors with declines of 5% to 7% in the days following announcement. First Citizens is an exception as its shares were up 34% five days after announcing its acquisition of CIT, which largely reflects the favorable price paid (44% of tangible book value). While it is not uncommon for buyers’ shares to decline following the announcement of an acquisition, these drops could reflect the market’s concerns around the heightened execution and integration risk of an MOE. It is early to judge whether the deals will create value in the long run or if the market’s initial reaction was justified.
CONCLUSION
We believe M&A will continue at a strong pace in the coming months as the economy continues to reopen and banks dust off previously shelved pre-Covid deals. We also expect MOEs will continue to garner more interest due to the aforementioned benefits. Management teams may be more willing to negotiate now than before on price, management roles, board composition, branding, etc. A balanced consideration of the benefits and risks of an MOE is imperative for making the optimal decision. Mercer Capital has significant experience in advising banks as buyers and sellers in transactions, including MOEs.
Understand the Market Approach in a Business Valuation
What Is the Market Approach and How Is it Utilized?
A thoughtful business valuation will likely rely on multiple approaches to derive an indication of value. While each approach should be considered, the approach(es) ultimately relied upon will depend on the unique facts and circumstances of each situation. This article presents a broad overview of the market approach, which is one of the three (the other two being asset and income) approaches utilized in business valuations.
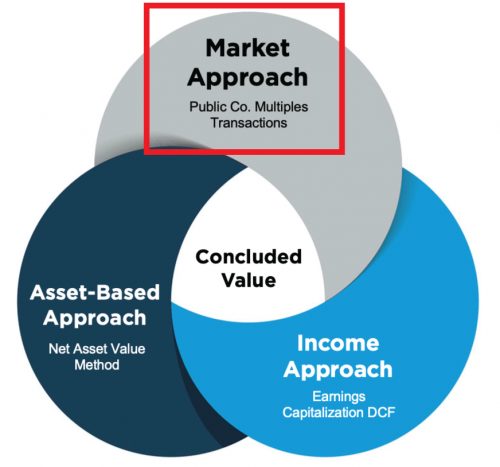
The market approach is a general way of determining a value indication by comparing the subject company or ownership interest to similar businesses, business ownership interests, securities, or intangible assets that have been sold. Within each of the three approaches, there are varying methodologies. Within the market approach, there are two primary methods: the guideline public company method (based on valuation multiples derived from publicly traded companies in similar industries), and the guideline transactions method (based on valuation multiples derived primarily from merger & acquisition transactions involving companies similar to the subject company). Historical transactions in the stock of a company being valued can also be considered under the guideline transactions method.
Guideline Public Company Method
The guideline public company method develops an indication of value based on consideration of publicly traded companies that provide a reasonable basis for comparison to the subject company. The valuation professional will typically conduct a search to identify a group of guideline public companies based on subject company’s industry, and review operating, financial, geographical, industry, and/or market characteristics to ensure that they are reasonable for inclusion.
Analysts express the relationship between the value of a company and a corresponding performance metric in the form of a valuation multiple, as shown in the following equation.

Applied to the subject company, the equation becomes:
The valuation professional must select the most relevant valuation multiples based on a number of factors, including the subject company’s size, profitability, growth prospects, industry, and capital structure. Common valuation multiples include EV (enterprise value) to sales, EV to EBITDA (earnings before interest, taxes, depreciation, and amortization), and Price to Earnings (P/E).1 Additionally, the valuation professional may deem it appropriate to adjust valuation multiples for size, risk, growth, and/or other attributes of the subject company relative to the guideline public companies from which the multiples were derived.2
The guideline public company method relies on objective, empirical data that can be used to draw inferences about a subject company’s value. And given that public company stocks trade daily, there won’t be a meaningful gap between the relevant valuation date and the data used in the analysis.
However, the method also has drawbacks. Depending on the subject company’s industry, there may be not sufficiently comparable publicly traded companies. Public companies are typically much larger than a private subject company. Public companies will also often have more product and/or geographic diversification. No two companies are identical, so operational, financial, and market factors must be assessed by the valuation professional. Also, two valuation professionals may deem different companies as comparable or not comparable.
While some commonalities may appear obvious, the guideline public company method requires considerable research and diligence. Access to databases that consolidate public company information like Bloomberg, Capital IQ, and TagniFi is helpful, as well.
The valuation professional also needs to understand the general economic environment and how it impacts the subject company and its industry. In a volatile year (such was the one we have experienced with COVID), earnings metrics may approach (or go below) zero, yielding multiples that are sky-high or negative, rendering this method, and potentially the entire market approach, unreliable and inappropriate for use.
A guideline public company group can sometimes provide useful valuation benchmarks. However, it is ultimately left to the analyst to determine if this method is appropriate given the facts and circumstances of subject companies. If deemed appropriate, then the analyst must develop valuation multiples for a subject company based upon a thorough review of a selected guideline group relative to the subject company.
Guideline Transactions Method
The guideline transactions method is similar to the guideline public company method. However, instead of deriving values from public company stock prices, values are derived from transaction consideration in mergers & acquisitions. It is even sometimes referred to as the M&A method.
Unlike public company stock prices, which can be viewed on a daily basis, guideline transactions occur at a single point in time. As such, market conditions may have changed between the guideline transaction date and the subject company valuation date. Timing is one important consideration. Reliability and accuracy of data is another.
The data for market transactions is typically sourced from various databases, with varying databases for public or private deals. While the providers of private deals attempt to ensure that data is accurate, the underlying information they source is typically self-reported, or sometimes provided by business brokers or investment bankers, instead of being derived from audited and publicly available financial statements for public companies. Additionally, transactions involving comparable companies may in fact take place, but details regarding transaction consideration and/or the target company’s earnings or performance metrics may not be disclosed, making it impossible to use these transactions for valuation inferences.
Market transactions can also have complexities not present in the guideline public company method (which is based on a public company’s common stock price). A market transaction may be structured with an earnout, in which the seller will receive additional consideration at a later date if the acquired company achieves certain financial or operating milestones. A transaction could include a lucrative employment agreement for the primary shareholder, which may influence how much the shareholder is willing to accept for the overall business. Additionally, the seller may provide attractive financing, influencing how much the buyer is willing to pay.
Without knowing all the details of guideline transactions, it is difficult to quantify the impact of these items on transaction consideration, and is often unclear, especially regarding earnouts, how transaction databases incorporate these items.
Additionally, a strategic buyer could have specific motivations to acquire a company due to various synergistic or strategic benefits. Data from strategic transactions are not generally useful in fair market value determinations, which typically do not include strategic benefits.
However, the guideline transactions method has its merits. While guideline public companies are typically much larger in size than private companies, market transactions take place across the size spectrum. Data can be filtered based on the size of the subject company. If the data set is large enough, further filters can be applied based on the subject company’s geographic location and other attributes. This results in companies likely being more directly comparable to the subject company relative to the larger guideline public companies. Ultimately, it is up to the valuation professional to determine the appropriateness of using the guideline transactions method.
Transactions in the Stock of the Subject Company
Transactions in the stock of a subject company can be used as a subset of the guideline transactions method to develop value indications. With public companies, the best indication of value for shares of a company’s stock, e.g., Microsoft, is the current trading price for its shares.
While private companies, by their very nature, do not have an active trading market for their stock, there are certain circumstances where the guideline transactions method can be applied. However, an important requirement for the application of the guideline transactions method is that the transaction was “arm’s length,” meaning that it took place between independent parties acting in their own self-interests. Transfers among family members or grants to employees are not necessarily representative of fair market value. Timing is also important. How much time has passed since the transaction? In what condition is the business and industry at the valuation date relative to the time of said transaction?
Sometimes we value startup companies, which come with additional considerations. If the company has recently been raising capital, the terms of recent investments can be used to imply a value for an interest. However, the valuation professional must take care to understand any differences between the interest acquired in the transactions and the interest that is being valued. Venture capital investments will often be in the form of preferred stock, which may have attributes that make the shares more valuable than the corresponding shares of common stock (e.g., liquidation preferences, anti-dilution provisions, etc.). Because of the complex nature of pricing preferences in venture capital and private equity transactions, a skilled valuation professional should be involved.
Conclusion
The market approach can be one of the most straightforward and compelling ways to derive the value of a subject company. However, each method within the market approach has its own merits and drawbacks, and thus a competent valuation expert is needed to ensure that the methods are applied in a thoughtful and appropriate manner given the unique facts and circumstances regarding the subject company.
________________________
1 The appropriate value for the numerator is based on whether the metric in the denominator is reflective of all capital providers (in which case enterprise value or total capital value is appropriate), or just equity holders (in which case just the equity value should be included in the numerator). Mercer Capital’s Chairman, Chris Mercer, discusses the distinction between enterprise and equity multiples in more detail here.
2 This is often referred to as a “fundamental adjustment.” A detailed discussion of the fundamental adjustment is outside the scope of this article, though Mercer Capital has a primer on the topic here.
Five Trends to Watch in the Medical Device Industry – 2021 Update
The medical device manufacturing industry produces equipment designed to diagnose and treat patients within global healthcare systems. Medical devices range from simple tongue depressors and bandages, to complex programmable pacemakers and sophisticated imaging systems. Major product categories include surgical implants and instruments, medical supplies, electro-medical equipment, in-vitro diagnostic equipment and reagents, irradiation apparatuses, and dental goods.
The following outlines five structural factors and trends that influence demand and supply of medical devices and related procedures.
1. Demographics
The aging population, driven by declining fertility rates and increasing life expectancy, represents a major demand driver for medical devices. The U.S. elderly population (persons aged 65 and above) totaled 49 million in 2016 (15% of the population). The U.S. Census Bureau estimates that the elderly will roughly double by 2060 to 95 million, representing 23% of the total population.
U.S. Population Distribution by Age Group
The elderly account for nearly one third of total healthcare consumption. Personal healthcare spending for the population segment was approximately $19,000 per person in 2014, five times the spending per child (about $3,700) and almost triple the spending per working-age person (about $7,200).

According to United Nations projections, the global elderly population will rise from approximately 608 million (8.2% of world population) in 2015 to 1.8 billion (17.8% of world population) in 2060. Europe’s elderly are projected to reach approximately 29% of the population by 2060, making it the world’s oldest region. While Latin America and Asia are currently relatively young, these regions are expected to undergo drastic transformations over the next several decades, with the elderly population expected to expand from approximately 8% in 2015 to more than 21% of the total population by 2060.
World Population 65 and Over (% of Total)

2. Healthcare Spending and the Legislative Landscape in the U.S.
Demographic shifts underlie the expected growth in total U.S. healthcare expenditure from $3.8 trillion in 2019 to $6.2 trillion in 2028, an average annual growth rate of 5.4%. While this projected average annual growth rate is more modest than that of 7.0% observed from 1990 through 2007, it is more rapid than the observed rate of 3.9% between 2009 and 2018. Projected growth in annual spending for Medicare (7.6%) and Medicaid (5.5%) is expected to contribute substantially to the increase in national health expenditure over the coming decade. Healthcare spending as a percentage of GDP is expected to expand from 17.7% in 2018 to 19.7% by 2028.
Since inception, Medicare has accounted for an increasing proportion of total U.S. healthcare expenditures. Medicare currently provides healthcare benefits for an estimated 60 million elderly and disabled people, constituting approximately 15% of the federal budget in 2018 and is expected to rise to 18% by 2028. Medicare represents the largest portion of total healthcare costs, constituting 20% of total health spending in 2017. Medicare also accounts for 25% of hospital spending, 30% of retail prescription drugs sales, and 23% of physician services.
U.S. Healthcare Consumption Payor Mix and as a % of GDP

Due to the growing influence of Medicare in aggregate healthcare consumption, legislative developments can have a potentially outsized effect on the demand and pricing for medical products and services. Net mandatory benefit outlays (gross outlays less offsetting receipts) to Medicare totaled $644 billion in 2019, and are expected to reach $1.4 trillion by 2030.
Average Spending Growth Rates, Medicare and Private Health Insurance

The Patient Protection and Affordable Care Act (“ACA”) of 2010 incorporated changes that are expected to constrain annual growth in Medicare spending over the next several decades, including reductions in Medicare payments to plans and providers, increased revenues, and new delivery system reforms that aim to improve efficiency and quality of patient care and reduce costs. While political debate centered around altering the ACA has been a continuous fixture in American politics since its passing, it is unlikely that material reform to the ACA might occur in the near future under the Biden Administration. On a per person basis, Medicare spending is projected to grow at 5.1% annually between 2018 and 2028, compared to 1.7% average annualized growth realized between 2010 and 2018.
As part of ACA legislation, a 2.3% excise tax was imposed on certain medical devices for sales by manufacturers, producers, or importers. The tax was made effective on December 31, 2012 but met resistance from industry participants and policy makers. In late 2015, Congress passed legislation promulgating a two-year moratorium on the tax beginning January 2016. In January 2018, the moratorium suspending the medical device excise tax was extended through 2019. In December 2019, the medical device excise tax was repealed.
3. Third-Party Coverage and Reimbursement
The primary customers of medical device companies are physicians (and/or product approval committees at their hospitals), who select the appropriate equipment for consumers (patients). In most developed economies, the consumers themselves are one (or more) step removed from interactions with manufacturers, and therefore pricing of medical devices. Device manufacturers ultimately receive payments from insurers, who usually reimburse healthcare providers for routine procedures (rather than for specific components like the devices used). Accordingly, medical device purchasing decisions tend to be largely disconnected from price.
Third-party payors (both private and government programs) are keen to reevaluate their payment policies to constrain rising healthcare costs. Several elements of the ACA are expected to limit reimbursement growth for hospitals, which form the largest market for medical devices. Lower reimbursement growth will likely persuade hospitals to scrutinize medical purchases by adopting i) higher standards to evaluate the benefits of new procedures and devices, and ii) a more disciplined price bargaining stance.

The transition of the healthcare delivery paradigm from fee-for-service (“FFS”) to value models is expected to lead to fewer hospital admissions and procedures, given the focus on cost-cutting and efficiency. In 2015, the Department of Health and Human Services (“HHS”) announced goals to have 85% and 90% of all Medicare payments tied to quality or value by 2016 and 2018, respectively, and 30% and 50% of total Medicare payments tied to alternative payment models (“APM”) by the end of 2016 and 2018, respectively. A report issued by the Health Care Payment Learning & Action Network (“LAN”), a public-private partnership launched in March 2015 by HHS, found that 35.8% of payments were tied to Category 3 and 4 APMs in 2018, compared to 32.8% in 2017.
Some expressed concern that the shift toward value-based care would encounter difficulties with the Trump Administration. In November 2017, the CMS partially canceled bundled payment programs for certain joint replacement and cardiac rehabilitation procedures. However, indications are that the CMS supports valuebased care and wants pilot programs to accelerate. In 2020, CMS released guidance for states on how to advance value-based care (“VBC”) across their healthcare systems, emphasizing Medicaid populations, and to share pathways for adoption of such approaches. Ultimately, lower reimbursement rates and reduced procedure volume will likely limit pricing gains for medical devices and equipment.
The medical device industry faces similar reimbursement issues globally, as the EU and other jurisdictions face similar increasing healthcare costs. A number of countries have instituted price ceilings on certain medical procedures, which could deflate the reimbursement rates of third-party payors, forcing down product prices. Industry participants are required to report manufacturing costs and medical device reimbursement rates are set potentially below those figures in certain major markets like Germany, France, Japan, Taiwan, Korea, China and Brazil. Whether third-party payors consider certain devices medically reasonable or necessary for operations presents a hurdle that device makers and manufacturers must overcome in bringing their devices to market.
4. Competitive Factors and Regulatory Regime
Historically, much of the growth for medical technology companies has been predicated on continual product innovations that make devices easier for doctors to use and improve health outcomes for the patients. Successful product development usually requires significant R&D outlays and a measure of luck. If viable, new devices can elevate average selling prices, market penetration, and market share.
Government regulations curb competition in two ways to foster an environment where firms may realize an acceptable level of returns on their R&D investments. First, firms that are first to the market with a new product can benefit from patents and intellectual property protection giving them a competitive advantage for a finite period. Second, regulations govern medical device design and development, preclinical and clinical testing, premarket clearance or approval, registration and listing, manufacturing, labeling, storage, advertising and promotions, sales and distribution, export and import, and post market surveillance.
Regulatory Overview in the U.S.
In the U.S., the FDA generally oversees the implementation of the second set of regulations. Some relatively simple devices deemed to pose low risk are exempt from the FDA’s clearance requirement and can be marketed in the U.S. without prior authorization. For the remaining devices, commercial distribution requires marketing authorization from the FDA, which comes in primarily two flavors.

Click here to enlarge the image
- The premarket notification (“510(k) clearance”) process requires the manufacturer to demonstrate that a device is “substantially equivalent” to an existing device (“predicate device”) that is legally marketed in the U.S. The 510(k) clearance process may occasionally require clinical data, and generally takes between 90 days and one year for completion. In November 2018, the FDA announced plans to change elements of the 510(k) clearance process. Specifically, the FDA plan includes measures to encourage device manufacturers to use predicate devices that have been on the market for no more than 10 years. In early 2019, the FDA announced an alternative 510(k) program to allow medical devices an easier approval process for manufacturers of certain “well-understood device types” to demonstrate substantial equivalence through objective safety and performance criteria. The plans materialized as the Abbreviated 510(k) Program later in the year.
- The premarket approval (“PMA”) process is more stringent, time-consuming and expensive. A PMA application must be supported by valid scientific evidence, which typically entails collection of extensive technical, preclinical, clinical and manufacturing data. Once the PMA is submitted and found to be complete, the FDA begins an in-depth review, which is required by statute to take no longer than 180 days. However, the process typically takes significantly longer, and may require several years to complete.
Pursuant to the Medical Device User Fee Modernization Act (“MDUFA”), the FDA collects user fees for the review of devices for marketing clearance or approval. The current iteration of the Medical Device User Fee Act (MDUFA IV) came into effect in October 2017. Under MDUFA IV, the FDA is authorized to collect almost $1 billion in user fees, an increase of more than $320 million over MDUFA III, between 2017 and 2022. Intended to begin in 2020, negotiations for MDUFA V were delayed due to the COVID-19 pandemic.
Regulatory Overview Outside the U.S.
The European Union (“EU”), along with countries such as Japan, Canada, and Australia all operate strict regulatory regimes similar to that of the FDA, and international consensus is moving towards more stringent regulations. Stricter regulations for new devices may slow release dates and may negatively affect companies within the industry.
Medical device manufacturers face a single regulatory body across the EU. In order for a medical device to be allowed on the market, it must meet the requirements set by the EU Medical Devices Directive. Devices must receive a Conformité Européenne (“CE”) Mark certificate before they are allowed to be sold in that market. This CE marking verifies that a device meets all regulatory requirements, including EU safety standards. A set of different directives apply to different types of devices, potentially increasing the complexity and cost of compliance.
5. Emerging Global Markets
Emerging economies are claiming a growing share of global healthcare consumption, including medical devices and related procedures, owing to relative economic prosperity, growing medical awareness, and increasing (and increasingly aging) populations. According to the WHO, middle income countries, such as Russia, China, Turkey, and Peru, among others, are rapidly converging towards outsized levels of spending as their income scales. When countries grow richer, the demand for health care increases along with people’s expectation for government financed healthcare. Middle income country share, the fastest growing economic sector, increased from 15% to 19% of global spending between 2000 and 2017. As global health expenditure continues to increase, sales to countries outside the U.S. represent a potential avenue for growth for domestic medical device companies. According to the World Bank, all regions (except Sub-Saharan Africa and South Asia) have seen an increase in healthcare spending as a percentage of total output over the last two decades.
Global medical devices sales are estimated to increase 5.4% annually from 2018 to 2025, reaching nearly $612.7 billion according to data from Fortune Business Insights. While the Americas are projected to remain the world’s largest medical device market, the Asia/Pacific and Western Europe markets are expected to expand at a quicker pace over the next several years.
World Health Expenditure as a % of GDP
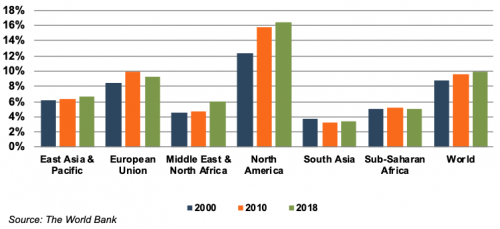
Summary
Demographic shifts underlie the long-term market opportunity for medical device manufacturers. While efforts to control costs on the part of the government insurer in the U.S. may limit future pricing growth for incumbent products, a growing global market provides domestic device manufacturers with an opportunity to broaden and diversify their geographic revenue base. Developing new products and procedures is risky and usually more resource intensive compared to some other growth sectors of the economy. However, barriers to entry in the form of existing regulations provide a measure of relief from competition, especially for newly developed products.
Post-Script – COVID-19 & The Medical Device Industry
The COVID-19 pandemic disrupted the healthcare sector, causing demand for optional procedures and in person visits to fall as medical resources were allotted for COVID-19 relief. At the onset of the pandemic, local governments implemented stay-at-home orders which restricted in-person visits to healthcare providers which resulted in decreased diagnoses and postponed procedures. As the pandemic went on, patients avoided nonessential medical care out of fear of contracting or spreading the virus.
In October of 2020, a McKinsey survey found that 40% of individuals reported having canceled upcoming appointments, and an additional 15% reported needing care but had not scheduled or received care. As a result, demand for industry products fell, with the exception of respiratory ventilators, breath monitors, and other devices used in the treatment of COVID-19. Simultaneously, the pandemic also decreased production capacity and fulfillment as manufacturers and transportations companies were forced to send employees home for social distancing measures. As of December 2020, IBISWorld projected medical device industry revenue to fall by 5.7% year-over-year for 2020 before rebounding in 2021 upon mass vaccinations.
