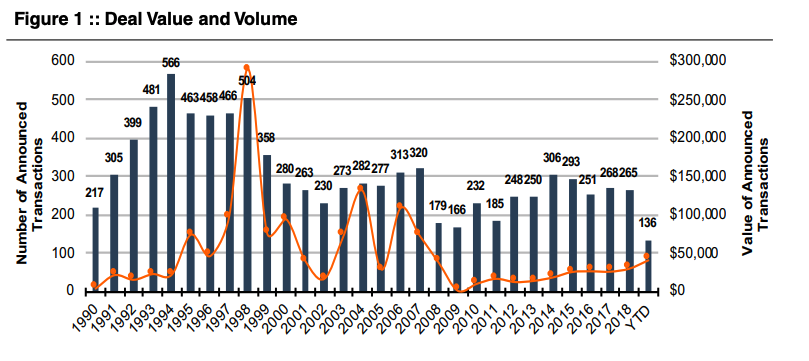
Through late July, M&A activity in 2019 is on pace to match the annual deal volume achieved in the last few years. Since 2014, approximately 4%-5% of banks have been absorbed each year via M&A. According to data provided by S&P Global Market Intelligence, there were 136 announced transactions in the year-to-date period, which equates to 2.5% of the 5,406 FDIC-insured institutions that existed as of year-end 2018.
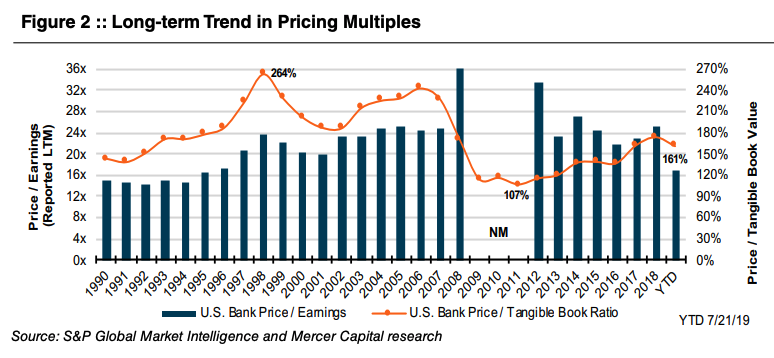
In the first seven months of the year, aggregate deal volume reached $41.3 billion, which surpasses the $30.5 billion in announced deals in all of 2018 as shown in Figure 1. The increase primarily reflects the $28 billion BB&T-SunTrust merger that was announced on February 7 and represents the largest deal since the 2007-2009 financial crisis. While deal value is up, multiples are down relative to 2018 with the average P/TBV multiple declining from 174% to 161% and the median P/E multiple declining from 25.3x to 17.1x as shown in Figure 2, although the price/earnings multiples from the 2018 period may be distorted by the effects of tax reform.
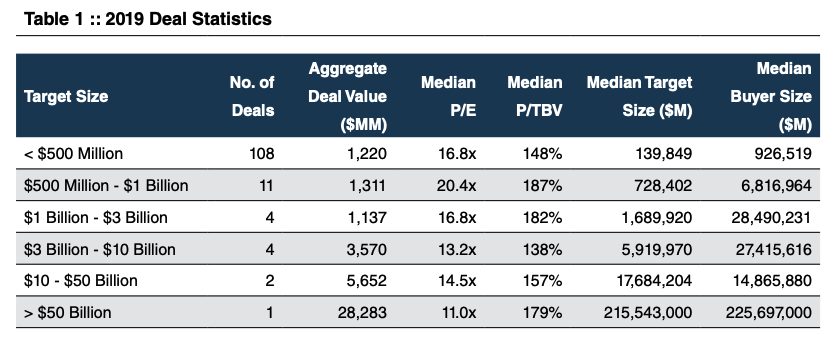
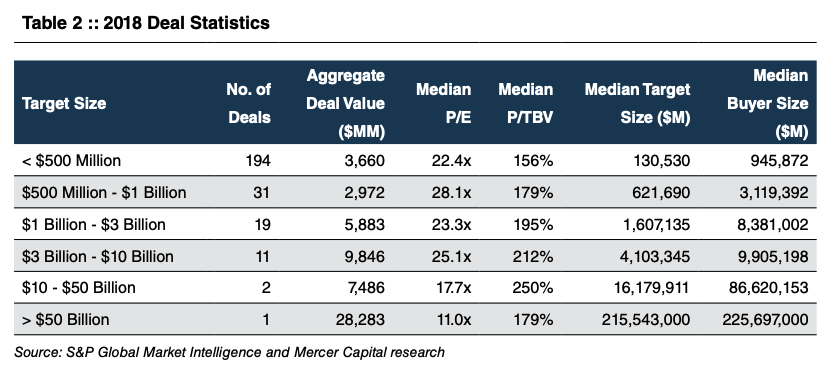
 The tables below provide a more detailed look at deal activity and the change in multiples in 2019 relative to 2018. For banks with assets less than $500 million, P/TBV multiples declined approximately 5%. While deal volume in the $500 million to $1 billion size group somewhat limits the meaningfulness of comparisons, it’s interesting to note that the median P/TBV multiple increased for this group relative to 2018 while the median buyer size increased from $3.1 billion in assets to $6.8 billion.
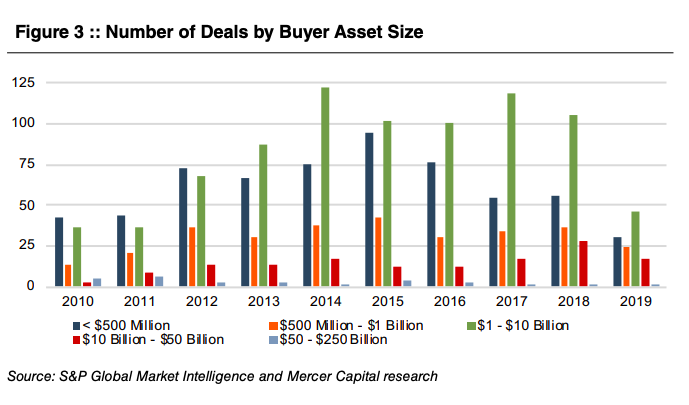
 As shown in Figure 3 below, the landscape of buyers has shifted somewhat in favor of bigger banks over the last decade. Deal activity among the smallest group (buyers with assets less than $500 million) peaked in 2015 with 95 announced deals. In 2018, this group announced 56 acquisitions. In contrast, buyers with total assets between $10 billion-$50 billion announced a 10-year high, 28 deals in 2018 and are on pace to reach a similar level in 2019. In May 2018, the SIFI threshold was increased to $250 billion, providing immediate relief to banks with assets between $50 billion and $100 billion. For those with assets between $100 billion and $250 billion, regulatory relief will phase in after 18 months. This change is expected to encourage additional M&A activity among bigger players.
 The theme of the story hasn’t changed; consolidation of the banking industry continues at a pace on par with the historical average. Target banks with less than $500 million in assets continue to comprise 75%-85% of total deal volume, but the composition of the buyer universe does seem to be shifting. In addition to the move towards larger buyers, another trend that appears to be gaining speed is the acquisition of commercial banks by credit unions. In 2015, three of such transactions were announced. In 2018, nine deals by credit unions were announced, and an additional ten have been announced through late July of this year.
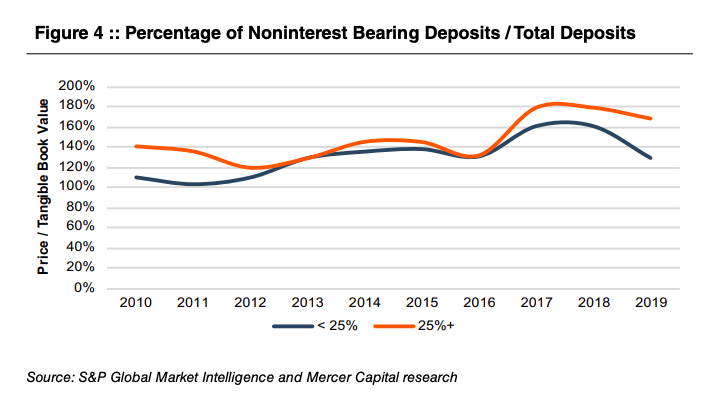
As to be expected, pricing trends over the last few years have also further cemented the value of a stable and low-cost customer base. As shown in Figure 4 below, as interest rates increased from the end of 2015 through 2018, pricing diverged in favor of banks with the highest percentage of noninterest-bearing deposits to total deposits.
The theme of the story hasn’t changed; consolidation of the banking industry continues at a pace on par with the historical average. Target banks with less than $500 million in assets continue to comprise 75%-85% of total deal volume, but the composition of the buyer universe does seem to be shifting. In addition to the move towards larger buyers, another trend that appears to be gaining speed is the acquisition of commercial banks by credit unions. In 2015, three of such transactions were announced. In 2018, nine deals by credit unions were announced, and an additional ten have been announced through late July of this year.
As to be expected, pricing trends over the last few years have also further cemented the value of a stable and low-cost customer base. As shown in Figure 4 below, as interest rates increased from the end of 2015 through 2018, pricing diverged in favor of banks with the highest percentage of noninterest-bearing deposits to total deposits.
 Mercer Capital has been providing transaction advisory and valuation services for over 30 years. To discuss a transaction or valuation issue in confidence, please contact us.
Originally published in Bank Watch, July 2019.
Mercer Capital has been providing transaction advisory and valuation services for over 30 years. To discuss a transaction or valuation issue in confidence, please contact us.
Originally published in Bank Watch, July 2019.


