Banks

October 29, 2024

Fed Rate Cut(s) – Now What?

Rate cycles are predictable in one sense: a period of falling rates tends to follow a period of rising rates. The opposite is true, too. How much and how long the cycle will take are questions to ask, but are unknowable. Another question to ponder is whether the Fed leads or follows the market, when setting its short-term policy rates.

Now that the pandemic interest rate cycle is complete (rate cuts in 2020, rate hikes in 2022-2023) and a new “downrate” cycle has begun. We take a high-level look at changes in yields, cost of funds (COF) and net interest margins (NIM) from past cycles to gauge how he unfolding downrate cycle may impact margins.

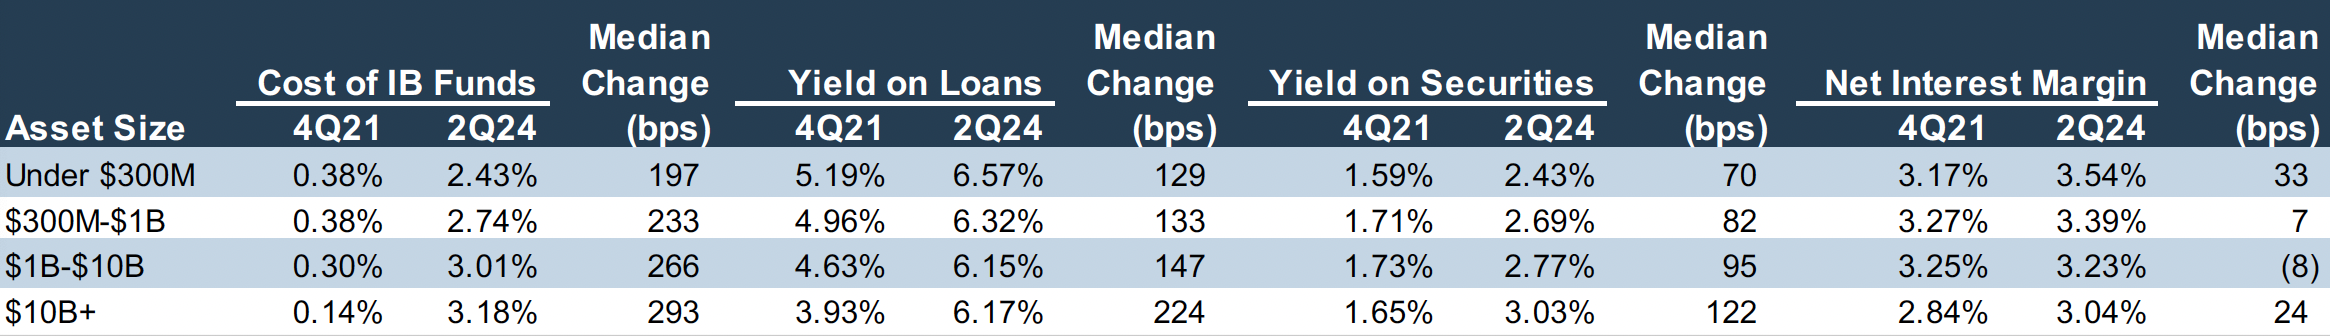
The figure below details the change in COFs and yields from the last quarter before the Fed began to raise rates (4Q21) and 2Q24 – the last quarter before the Fed initiated the first of what presumably will be multiple cuts by reducing its policy rates by 50 basis points (bps) in mid-September. As an aside, the increase of ~50bps in long-term U.S. Treasury yields and ~$200/ounce in gold since the cut implies the downrate cycle may be limited.

Click here to expand the image above

By way of reference, immediately before the first hike in March 2022, the Fed funds target rate was 0.00-0.25%, bank prime was 3.25%, and the 10-year Treasury yielded ~2%.Before the Fed cut in mid-September, the fed funds range was 5.25-5.50%, the bank prime was 8.5%, and the 10-year Treasury yielded ~3.7%.

As shown below, there is a direct correlation between asset size and cost of interest-bearing funds. Larger banks reported a higher cost of funds in 2Q24, presumably given the competitive nature of more urban markets and greater reliance on wholesale funding whereas smaller banks arguably have somewhat less competition and are less reliant on wholesale funding. Small banks reported a lower increase in cost of funds between 4Q21 and 2Q24 of ~200bps compared to ~300bps for large banks (note: the FDIC defines community banks as having assets less than $10 billion).

The increase in funding costs also occurred against the backdrop of a flood of liquidity into the banking system during 2020 and 2021. This left the spread between deposit rates and short-term market yields unusually wide on the eve of the failure of SVB, that in turn forced most banks to aggressively reprice deposits.

As for loan yields, smaller banks reported a higher yield in 2Q24 as larger markets are more competitive and pricing is tighter. Larger banks reported a more substantial increase in loan yield between 4Q21 and 2Q24, primarily given more loans with a base rate tied to SOFR. Yield on securities were all relatively similar in 4Q21 but increased more for larger banks for several reasons (shorter maturities, greater willingness to take losses to reposition the portfolio, etc.).

Consistent with history, NIM was highest for small banks and was lowest for large banks in 2Q24. Interestingly, the bookends were the biggest beneficiaries in terms of margin expansion during the most recent up rate cycle.

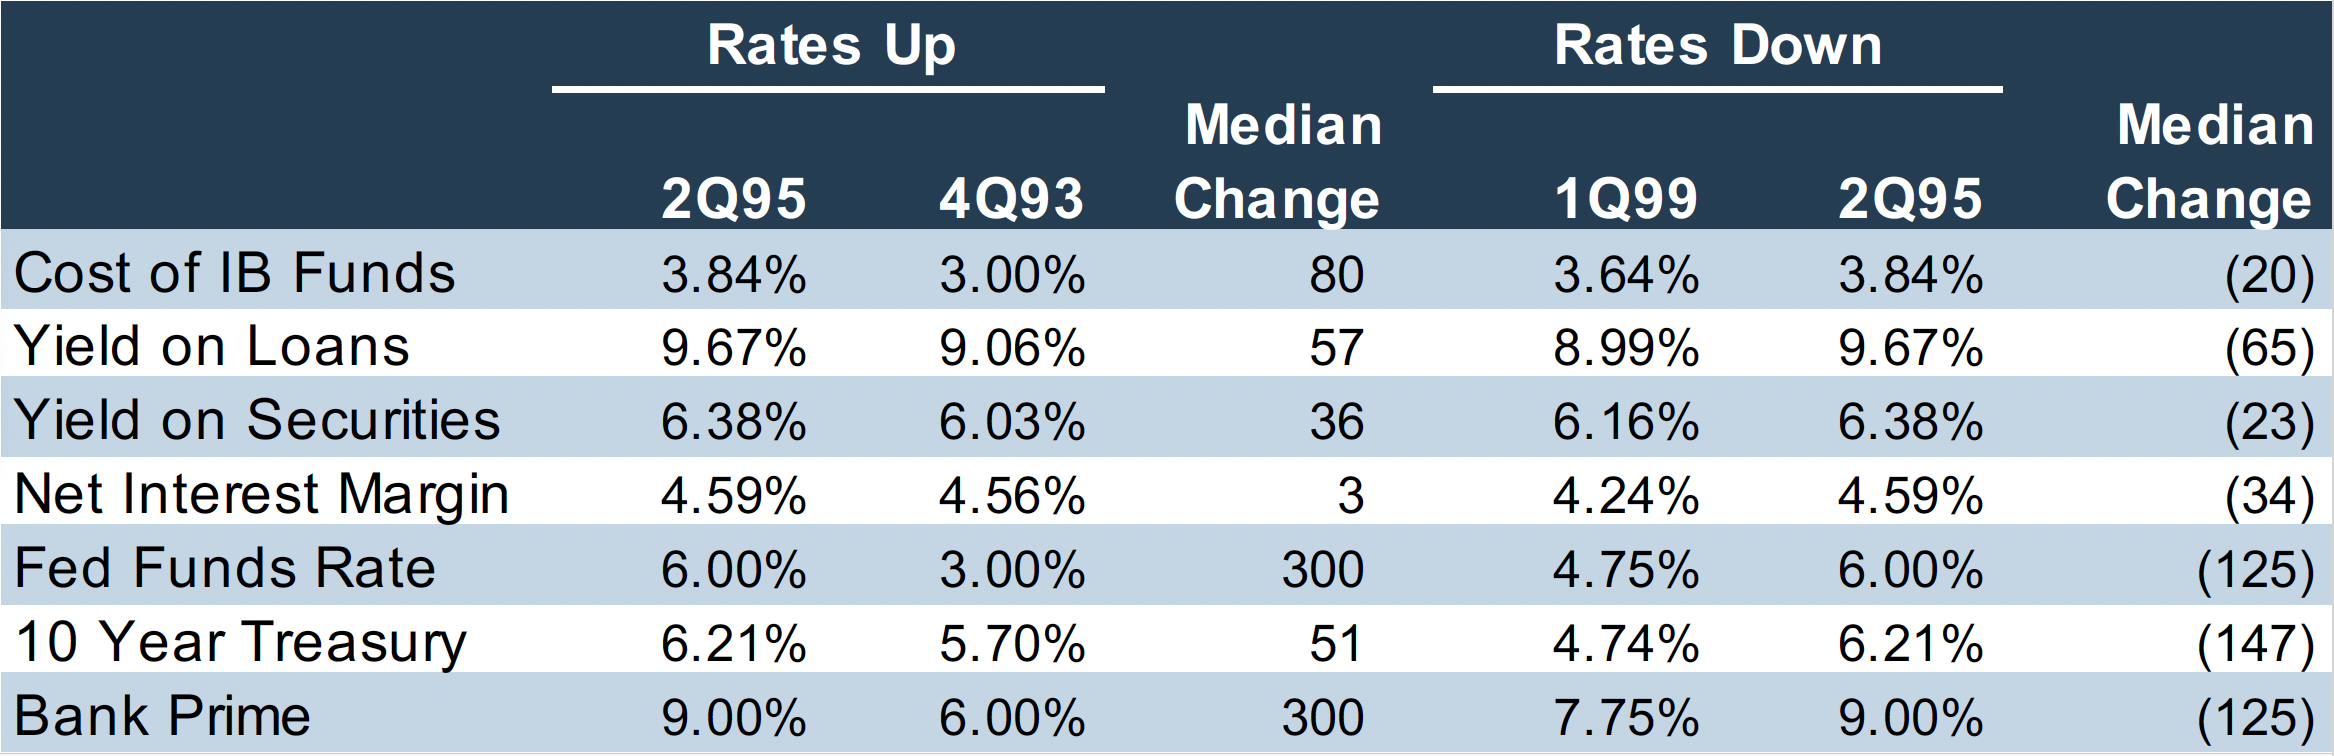
The next figure provides a look at the change in the COF, yields and NIMs during the up rate cycle of 1994 and subsequent down rate cycle of 2Q95 to 1Q99. Although the Fed hiked its policy rates 300bps in a little over 12 months and thereby produced a ferocious bond bear market in 1994, bank fundamentals remained solid given a backdrop of a growing economy and stable real estate values. The median change in the COF was 80bps while the median yield on loans increased 57bps. However, the delta between bank prime rate and yield on loans tightened from 4Q93 (~300bps) to 2Q95 (~70bps). Net interest margin was approximately flat between time periods.

Between 2Q95 and 1Q99 the Fed lowered the policy rate 125bps as inflationary pressures receded (1995-96) and later as the global currency and LTCM crisis took hold (1998). For banks, this resulted in a modest COF reduction (20bps lower) while loan yields declined more significantly (65bps) which resulted in a lower NIM for the industry.

After the dotcom bubble burst in 2000, the Fed cut its policy rate to 1.0% and thereby ignited a housing bubble that eventually popped in the 425bps hiking cycle of 2004-2006, which in turn was the catalyst for cuts that ended with a zero interest rate policy—ZIRP—in December 2008.

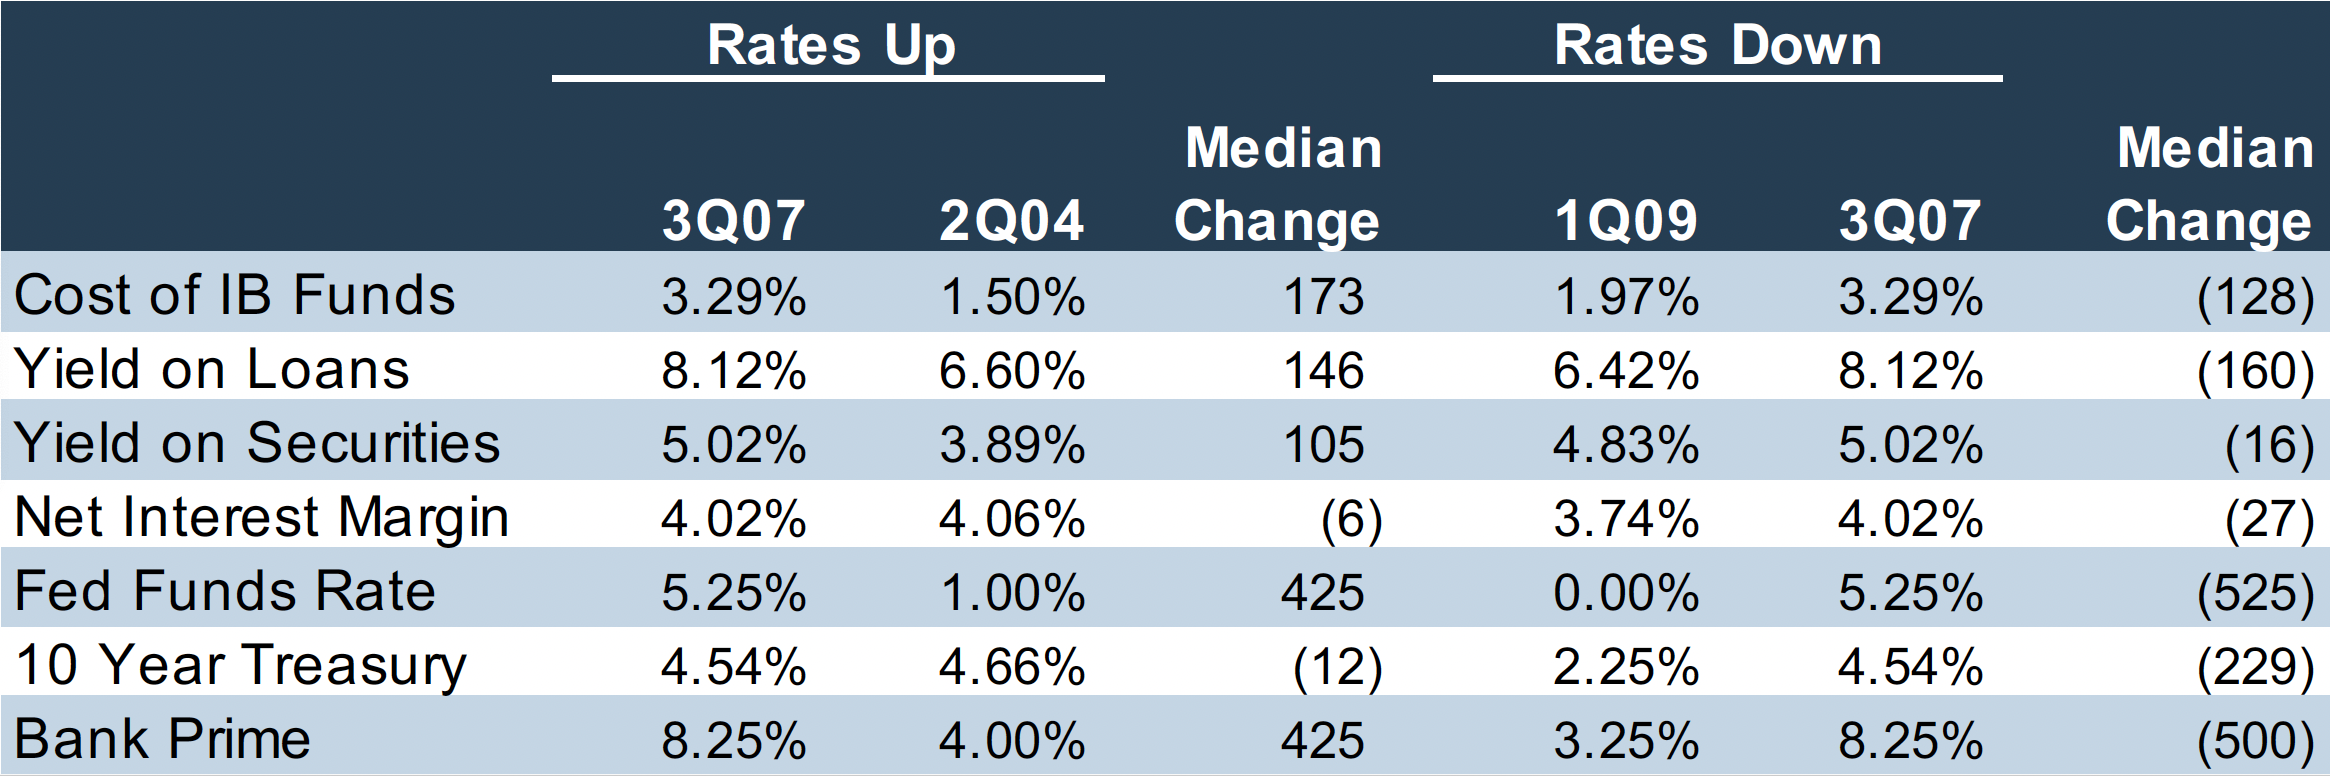
In our last figure, we compare changes in the COF/yields/NIM between 2Q04 before the first hike with 3Q07 immediately before the first cut as the disaster begins to unfold, and then 3Q07 with 1Q09 after ZIRP was implemented.

The median change in the COF was 173 basis points between 2Q04 and 3Q07, while yield on loans increased 146 bps and NIM was flattish. Similar to the 1990s scenario discussed previously, the delta between loan yield and bank prime tightened during the uprate cycle while the increase in COF was less than half of the increase in fed funds rates.

What began with a 50bps rate cut in the fall of 2007 eventually increased to a 525bps reduction by year-end 2008. By 1Q09, the median COF reduction was 128bps while loan yields fell 160bps. The result was a median reduction in the NIM of 27bps. However, our measurement period does not do justice to the impact of ZIRP on NIMs in which the value of NIB deposits were crushed vs a “normal” environment when short-term rates are in the vicinity of 4%. Over the next several years, NIMs would decline as asset yields fell much more than funding costs.

Where from here? We do not know for sure, but bank investors are optimistic that Fed rate cuts will allow banks to cut their COFs more than yields decline and thereby produce limited margin expansion after a period of margin pressure due to the need to aggressively reprice deposits post-SVB.

Count us as skeptical – besides the data is nuanced as are individual bank balance sheets.

For both cycles (1990s and pre-GFC 2000s), NIM was flat on the way up but declined in down rate scenarios. During 2Q22-1Q23, bank NIMs expanded as banks sat on deposit rates as yields rose with 525bps of Fed hikes. Since 2Q23, NIMs trended lower until what appeared to be emerging stability with initial 3Q24 earnings reports. It may be that limited Fed cuts over the balance of the current down rate cycle may be neutral for NIMs, whereas if the Fed is forced to cut sharply for whatever reason will produce lower NIMs in time.


Originally appeared in the October 2024 issue of Bank Watch.

Continue Reading

March 2026 | Capital Allocation: The Strategic Decision in a Slower Growth Environment
Bank Watch: March 2026

Capital Allocation: The Strategic Decision in a Slower Growth Environment

Following several years of balance sheet volatility and margin pressure, the operating environment for banks improved in 2025 as most posted higher earnings on expanded net interest margins. The outlook for 2026, at least prior to the outbreak of the U.S./Israel-Iran war, reflects(ed) a relatively stable operating environment.Stability, however, introduces a different challenge. Loan growth has moderated across much of the industry, and the benefit from asset repricing has largely been realized. In this environment, earnings growth is less dependent on external tailwinds and more dependent on internal discipline. As a result, capital allocation has moved to the center of strategic decision-making.The Expanding Capital Allocation ToolkitCapital allocation discussions are often framed around dividends and, to a lesser extent, share repurchases. In practice, the range of capital deployment decisions is broader and more interconnected. Banks today are balancing:Organic balance sheet growthTechnology and infrastructure investmentDividendsShare repurchasesM&ABalance sheet repositioningRetained capital for flexibilityEach alternative carries different implications for risk, return, and long-term franchise value.Organic growth often is the preferred use for internally generated capital when the risk-adjusted returns exceed the cost of equity. However, competitive loan pricing and a tough environment to grow low cost deposits have narrowed spreads, reducing the margin for error. Similarly, technology investments may improve efficiency over time but require upfront capital with uncertain timing of returns.Returns, Valuation, and Market DisciplinePublic market valuations provide a useful lens for evaluating capital allocation decisions. As shown in Figure 1(on the next page), banks that generate higher returns on tangible common equity (ROTCE) tend to command higher price-to-tangible book value multiples. This can also be expressed algebraically, at least on paper, whereby P/E x ROTCE = P/TBV, while P/Es reflect investor assessments about growth and risk.This relationship reflects a straightforward principle: capital should be deployed where it earns returns in excess of the cost of equity. When internal opportunities meet that threshold, reinvestment should be appropriate. When returns are below the threshold, returning capital to shareholders through special dividends or repurchases may create greater per-share value.Share repurchases, in particular, can be an effective tool when executed below intrinsic value and when capital levels remain sufficient to support strategic flexibility. However, repurchases that do not improve per-share metrics or are offset by dilution from other sources may have limited impact.Figure 1: Publicly Traded Banks with Assets $1 to $5 BillionBalance Sheet Repositioning as Capital AllocationIn some cases, capital allocation decisions are embedded within the balance sheet itself. One example is securities portfolio repositioning.Many banks continue to hold securities originated during the low-rate environment of 2020 and 2021. While unrealized losses associated with these portfolios have moderated, the yield on these assets often remains well below current market rates.Repositioning the portfolio, by realizing losses and reinvesting at higher yields, represents a tradeoff between near-term capital impact and longer-term earnings improvement. In effect, this decision can be evaluated similarly to other capital deployment alternatives, with management weighing the upfront reduction in Tier 1 Capital against the expected lift to net interest income and returns over time.As with M&A, the concept of an “earnback period” can be applied. Institutions that approach repositioning with a clear understanding of the payback dynamics are better positioned to evaluate whether the strategy enhances long-term shareholder value. We offer the caveat that institutions who evaluate restructuring transactions should compare the expected return from realizing losses (i.e., reducing regulatory capital) with instead holding the securities and repurchasing shares. If the bank’s shares are sufficiently cheap, then it could make sense to continue to hold the underwater bonds until the shares rise sufficiently.M&A and Capital FlexibilityM&A remains a viable capital deployment option, particularly for institutions seeking scale or improved operating efficiency. However, transaction activity continues to be constrained by pricing discipline, tangible book value dilution, and investor expectations around earnback periods.Public market valuations ultimately serve as a governor on deal pricing, reinforcing the importance of aligning capital deployment decisions with shareholder return expectations.Conclusion: Discipline Drives OutcomesIn a slower growth environment, capital allocation is not a secondary consideration; it is a core driver of performance. While banks cannot control market multiples, they can control how capital is deployed across competing opportunities.Institutions that consistently allocate capital with a clear focus on risk-adjusted returns, strategic alignment, and per-share value creation are more likely to generate sustainable growth in earnings and tangible book value. In the current environment, disciplined execution may prove more valuable than more aggressive but less certain alternatives.
The Tariff Hangover: How a Year of Trade Volatility Is Reshaping Transportation
The past year has been defined by a series of rapid and often unpredictable shifts in trade policy. New tariffs, temporary pauses, retaliatory measures, and evolving global supply chains have left a measurable impact on the transportation and logistics industry. These developments have influenced freight volumes, pricing dynamics, capital allocation, and ultimately the valuation of transportation companies.
Specialty Finance Acquisitions
In 2021, there were 21 deals announced with a U.S. bank or thrift buyer and a specialty lender target. This represents a significant uptick from the prior two years and the highest level since 2017. Deals in 2021 were largely driven by a desire to deploy excess liquidity and grow loans. Other drivers of deal activity include efforts to find a niche in the face of competition or diversify revenue and earnings. Through May 19, six deals had been announced in 2022.

Cart

Your cart is empty