How to Read a Royalty Check
The information on royalty checks is beneficial because it gives mineral interest owners plenty of granular detail on how the operator calculates their monthly payment. The problem is that companies may issue checks with differing formats (see two examples below) and they can be hard to read. However, with a trained eye, mineral interest owners can learn to read these checks and glean valuable insight into what is driving the value of their interests.
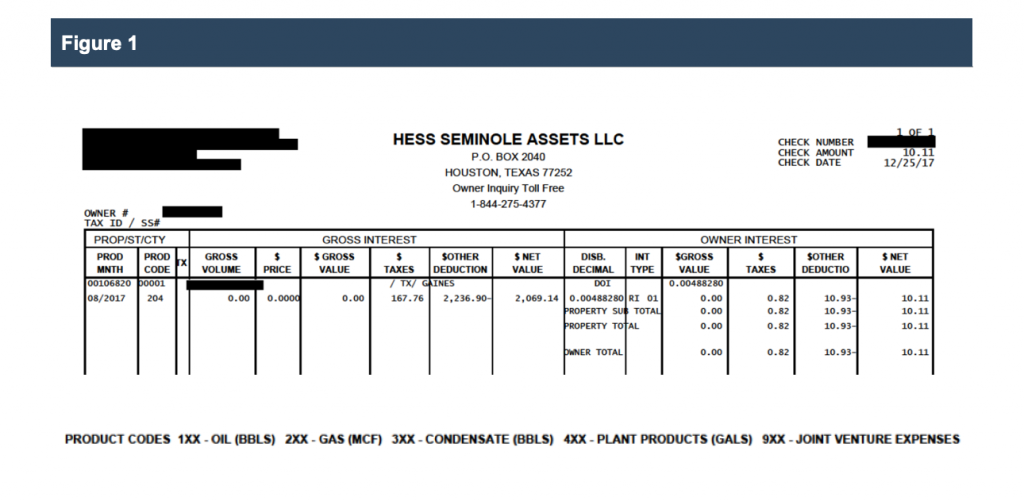
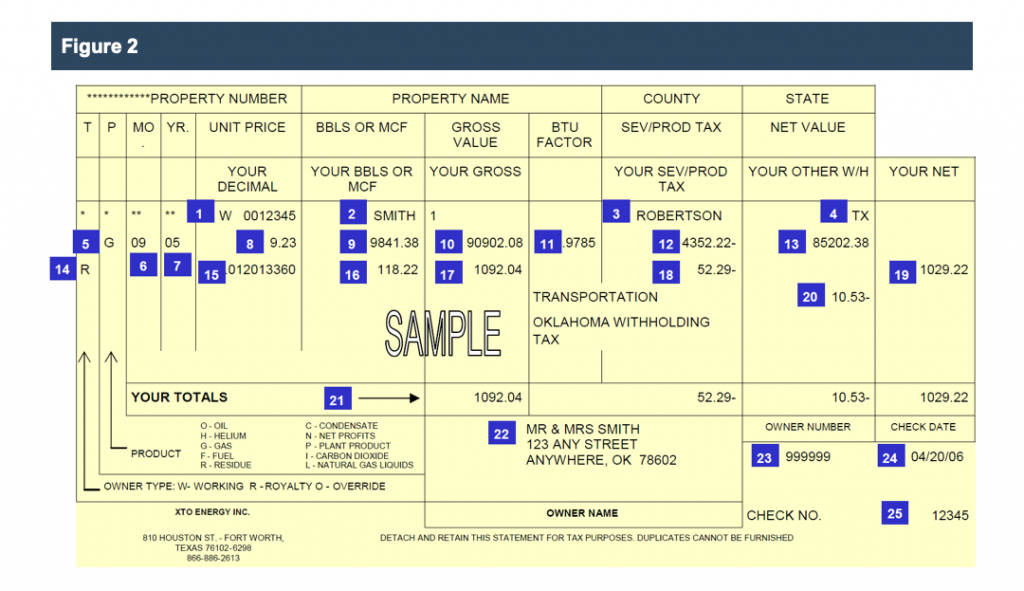
The first example is a check one might actually receive in the mail. The second is a sample check provided by an operator to help owners understand what it means. Regardless of the operator, there are a few key items that appear on every check:
- Ownership Percentage
- Product Code
- County
Ownership Percentage
A lease arrangement is designed to be a mutually beneficial agreement. Mineral owners own the rights to a valuable commodity, but they lack the ability to harvest it themselves. Operators come in with the equipment and requisite knowledge necessary to extract minerals from the ground. In exchange for the right to drill on the property, operators pay mineral owners a fraction of the revenue generated from the production. This fraction can appear on a check as a string of numbers like 0.0234375. You may be wondering, where does this number come from? This is the product of the net mineral acreage owned multiplied by the royalty percentage negotiated.
Most of the United States uses the Public Land Survey System which is divided into townships and further into sections. A township is 36 sections and a section is 640 acres (or one square mile).[1]
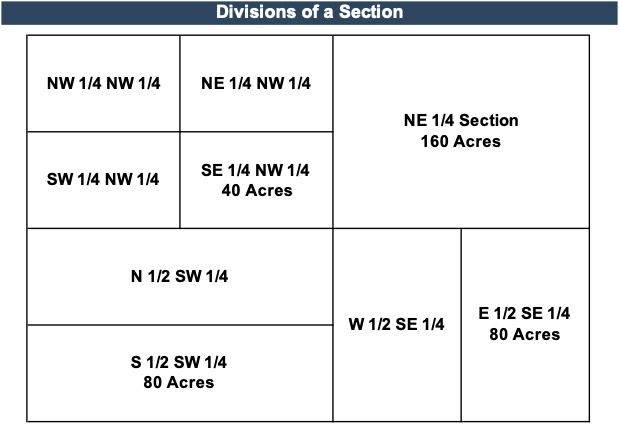
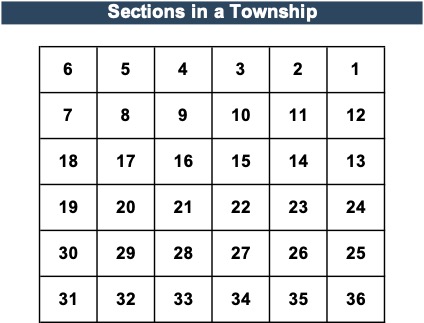 Sections are further broken down into quadrants, or some other division as the land is passed down over time. For instance, a lease could specify “all of the mineral interest under the E ½ SE ¼ of 11-2N.” This is read “The east half of the southeast quarter of Section 11, township 2 North.” As depicted below, this would be the rectangle in the bottom right quarter, and would represent 80 net mineral acres. That is: 640 acres per section times ¼ times ½.
 The lease would go on to specify the royalty percentage to be paid, like 3/16. This will frequently be presented in some form similar to the follow:
“To pay Lessor for gas (including casinghead gas) and all other substance covered hereby, a royalty of 3/16 of the proceeds realized by Lessee from the sale thereof.”
This simply means the operator will pay a royalty of 3/16 of revenue generated from production on the property. Multiplied by the 80 net mineral acres that make up the 640 acre section, we arrive at:
The lease would go on to specify the royalty percentage to be paid, like 3/16. This will frequently be presented in some form similar to the follow:
“To pay Lessor for gas (including casinghead gas) and all other substance covered hereby, a royalty of 3/16 of the proceeds realized by Lessee from the sale thereof.”
This simply means the operator will pay a royalty of 3/16 of revenue generated from production on the property. Multiplied by the 80 net mineral acres that make up the 640 acre section, we arrive at:
80/640 x 3/16 = 0.0234375
Owners will note much larger dollar figures on their checks which represent the gross revenue the operator receives from production of the minerals. This gross value is multiplied by the ownership percentage, which determines the amount actually received by the owner on their check. Knowing the net mineral acreage owned (not determined by the operator) can help determine the royalty rate the mineral owner is being paid, which helps to understand the value ultimately being paid for their interests.
Product Code
The information on royalty checks is beneficial because it gives mineral interest owners plenty of granular detail on how the operator calculates their monthly payment.
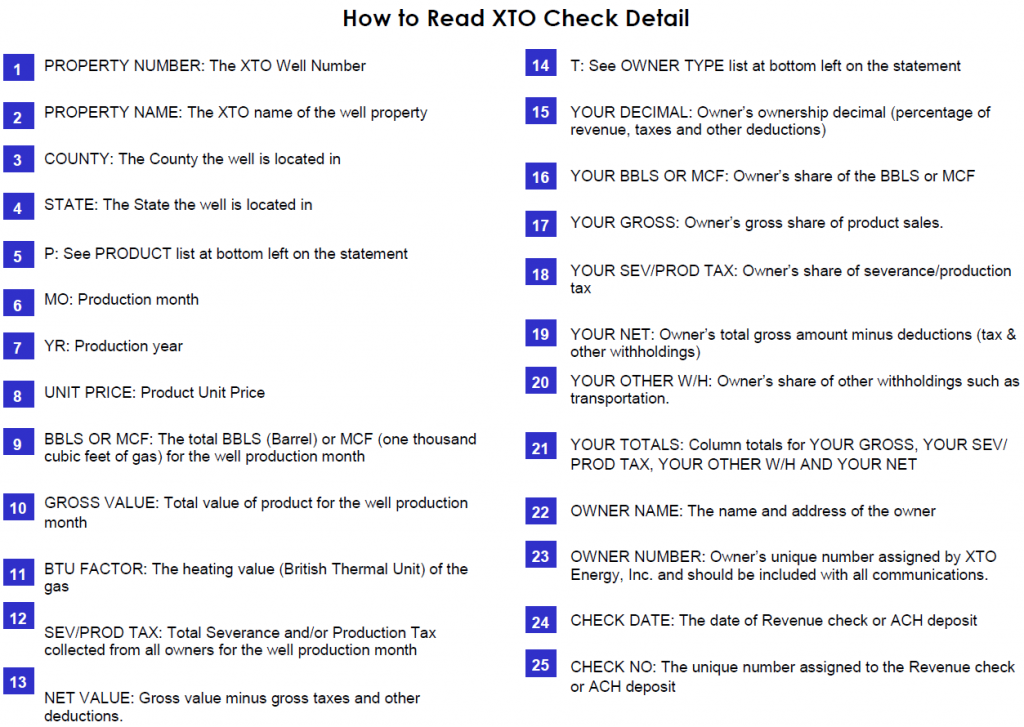
The revenue received by both the operator and ultimately the owner depends on both the quantity produced and the price achieved. As of the writing of this article, crude oil prices are trading around $53 per barrel for West Texas Intermediate (WTI), the most commonly tracked figure for U.S. crude oil. By comparison, natural gas is trading around $3.04 per Mcf at the Henry Hub, the most common benchmark for natural gas in the country. Knowing what is being produced: oil, gas, NGL, or a combination of these is crucial to understanding the value of the interests. Owners can figure this out by looking at the product code on their checks, which can be expressed as either a letter or number. Our first example lists the product code as 204, and the legend at the bottom of the check indicates that gas is being produced. Even less clearly, our second example shows the letter “G” under the “P” column, and which, according to the legend, means gas is being produced. This can be far from intuitive without some sort of key describing each item.
When oil prices decline, as they have since the beginning of October, mineral owners who receive royalty checks based on oil production can expect to see smaller figures on their checks. But the price isn’t purely based on the value listed on an exchange. It also depends on location and infrastructure to bring the commodity to market.
County
The county where the minerals are produced is another common feature of royalty checks. However, it is not clearly stated as “Gaines County” for example. In our first example, we see the check says /TX/ Gaines which tells us the mineral interests are in Gaines County, Texas, which is located in the prolific Permian Basin. Again, this isn’t very clear just from looking at the check, and someone not from the region may not automatically know the names of counties in different states.
Knowing the county where the minerals are located can go a long way to understanding their value. For instance, oil production in the Permian Basin has increased significantly in recent years and has been a very attractive place for industry players. However, a lack of pipeline infrastructure has led to oversupply, meaning operators were forced to take a discount to the WTI price. Mineral owners have no control over where and when operators choose to produce, and current production leads to more upfront revenue, but taking a discounted price to get the revenue upfront could ultimately be detrimental to mineral owners in the long term, given the way production tends to decline significantly.
Other Sources of Information
While royalty checks are tangible pieces of information sent frequently to mineral owners, there’s more information out there that owners can turn to. The lease agreement itself can be the primary source for determining what you own. While many may look the same, lease agreements are ultimately an economic agreement between two parties and can have a variety of different clauses. However, there are frequently instances where our clients do not have access to these key documents. In the case of interests being passed down or donated, clients are usually dealing with legacy arrangements with operators and may not have all the documents that spell out the specific rights with their particular lease.
Royalty checks provide valuable information to mineral owners that can help determine the value of their minerals.
There are other potential sources of information published online that owners can access free of charge. For instance, in Texas, there’s the Texas General Land Office and Texas Railroad Commission where mineral owners can, among other things, zoom in on plots of land and see well locations. Mineral owners can also learn about historical drilling permits and activity by region. The FDIC also publishes sales of oil and gas interests which can be helpful to see actual sales prices for mineral interests observed in the market.
Conclusion
Royalty checks are hardly intuitive, and not everyone would bother asking too many questions when they regularly receive a check in the mail. However, without putting in some research, it can be hard to know if the next check will be higher or lower, or if there will even be one next month. That’s where it becomes crucial to understand what drives the value for mineral interests and what are the relevant risk factors. For those looking to sell their interests, or simply looking to understand the value of what they own, an appraisal can be a helpful tool in understanding both the value of mineral interests, and what drives this value. It is important to seek advice from someone who has experience valuing mineral interests and is well-versed in all potential sources of information.
Mercer Capital is an employee-owned independent financial advisory firm with significant experience (both national and internationally) valuing assets and companies in the energy industry (primarily oil and gas, bio fuels and other minerals). Our oil and gas valuations have been reviewed and relied on by buyers and sellers and Big 4 Auditors.
As a disinterested party, we can help you understand the fair market value of your royalty interest and ensure that you get a fair price for your interest. Contact anyone on Mercer Capital’s Oil and Gas team to discuss your royalty interest valuation questions in confidence.
[1] Exampled based on a presentation at the National Association of Royalty Owners (NARO) 2018 Conference in Denver, CO


